Performance based classification of
structural water management measures
Pennine Water Group, University of Sheffield in collaboration
with the partners of the FloodResilienCity, MARE and SKINT
projects
Co funded by the European Union through the European Regional Development Fund
Written by: John Blanksby, Pennine Water Group, Department of Civil and Structural Engineering, University of Sheffield, UK With input from, Will Shepherd, Simon Doncaster, Sarah Moore and Richard Ashley, Pennine Water Group.
If you have any comments or suggestions to enhance this document please email John Blanksby at [email protected]
Summary
Over the years many slightly different classification systems have been developed to describe different structural water management measures. The aim of this document is to suggest a classification system that brings consistency over a wide range of measures that everybody can understand. To do this, the focus is on the performance of the different measures in terms of flooding and water quantity and pollution and water quality. Other benefits, although an important consideration in the selection of measures to be used are not dealt with in detail in this document, because it would take forever to do so. The document is written in four sections
An introduction
A description of the classification system
A description of the performance of different types of measures under normal and extreme operational conditions A broad list of other benefits
Contents
1 Introduction ... 1
2 The classification system... 4
2.1 Water quantity and flood management ... 4
2.1.1 Flow storage measures ... 4
2.1.2 Flow conveyance measures ... 4
2.1.3 Flow control measures ... 5
2.2 Water quality and pollution management ... 5
2.2.1 Physical treatment processes ... 5
2.2.2 Biochemical treatment processes ... 5
3 Performance of the measures under normal and extreme flow conditions ... 10
3.1 Flow storage measures ... 10
3.1.1 Normal operation ... 10
3.1.2 Extreme operation ... 13
1
Introduction
In recent years there has been a tendency to differentiate between water management measures for coastal water, rivers and streams and surface water. Even within surface water management this differentiation extends to conventional urban surface water management measures, (sewers and drains) and more recently introduced measures known as BMPs or SuDS.
The introduction of BMPs and SuDS as a practice distinct from piped drainage systems has by necessity required the development of a whole series of publications promoting their use and how to build and maintain them. These publications have to get their message across, but contain potentially inflammatory statements like “SuDS are more sustainable than conventional drainage methods” when in fact they can be more
sustainable, although depending on the measures of sustainability in some circumstances they may not be because sustainability is dependent upon the context and boundaries of any application.
This type of statement promotes an either/or situation when a more reasoned approach based on appropriateness is required.
The time has come to draw the two approaches together to provide best practice urban surface water management that is relevant to 21st Century cities, rather than to those of the 19th or 20th Century.
The first step in this process is to define how different surface water management measures can contribute to the management of flooding and pollution in the built, natural and water environments. Having done this, the wider benefits of the different measures can be considered. To
carry out the first step there is a need for a simple performance based classification system.
Over the years, many classification systems have been developed, but each has different characteristics. Examples of these include OFWAT’s “Comparing the Arrangements for the Management of Surface Water in England and Wales to Arrangements in Other Countries”1 (Table 1), the “SuDS manual”2 (Table 2), “Retrofitting to manage surface water”3 (Table 3) by CIRIA, and Urban green – blue grids4 (Table 4). There are many other documents that provide guidance on water management measures. Examples of these include reports and documents published by United States sources, such as the US Environmental Protection Agency5. The place of these measures within integrated water management is also considered important in Australian practice, termed ‘Water Sensitive Urban Design’ (WSUD) which brings city planning and water management together6.
1
Comparing the Arrangements for the Management of Surface Water in England and Wales to Arrangements in Other Countries, OFWAT 2011
2
Woods Ballard B., Kellagher R., Martin P., Jefferies C, Bray R. And Shaffer P. The SuDS manual, CIRIA 2007, ISBN 978-0-86017.
3 Digman C., Ashley R., Balmforth D., Balmforth D., Stovin V. And Glerum J.
Retrofitting to manage surface water, CIRIA 2012, ISBN 978-0-86017-915-9
4
Potz H. And Bleusé P. Urban green - blue grids, Coop for Life, Delft, 2012, ISBN 978-90-818804-0-4
5 http://cfpub.epa.gov/npdes/stormwater/menuofbmps/ 6
Table 1: Drivers and principal benefits (derived from Comparing the Arrangements for the Management of Surface Water in England and Wales to Arrangements in Other Countries)
Flow control Flow reduction
Ground water recharge Flow attenuation Flow conveyance
Water quality Control of pollution
Control of sediment Filtration
Amenity Amenity
Rainwater Harvesting Flood prevention Flood defence Flood resistance Flood resilience
Biodiversity Biodiversity
[image:8.842.66.431.127.325.2]
Table 2: Capability of different SuDS techniques (The SuDS manual) Management train suitability Prevention
Conveyance Pre treatment Source control Site control Regional control
Water quantity Conveyance
Detention Infiltration Water harvesting
Water quality Sedimentation
Filtration Adsorption Biodegradation Volatilisation Precipitation Uptake by plants Nitrification Environmental benefits Aesthetics
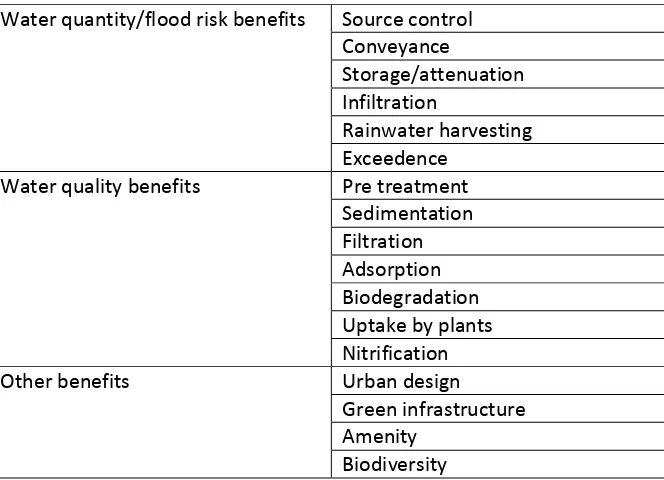
Table 3: Benefits of Surface water management measures (Retrofitting to manage surface water)
Water quantity/flood risk benefits Source control Conveyance
Storage/attenuation Infiltration
Rainwater harvesting Exceedence
Water quality benefits Pre treatment Sedimentation Filtration Adsorption Biodegradation Uptake by plants Nitrification
Other benefits Urban design
Green infrastructure Amenity
Biodiversity
Table 4: Overview of measures (Urban green – blue grids) Water challenge Making water visible –
above ground drainage Buffering and infiltration Decentralised treatment Use of other water Flood risk management Desiccation
Heat Biodiversity
Urban agriculture Private or communal initiatives
Commercial initiatives Air quality
Energy Limit demand
Using residual flows
Use of renewable sources Solar energy Wind
Ambient heat Energy from water Efficient use of fossil and
renewable sources Social and economic
importance Costs
[image:9.842.72.404.111.351.2]The three approaches set out in Tables 1 – 3 have much in common and are clearly water environment centred, the benefits to the wider aspects of urban design and management being given less prominence. Table 4 provides a much broader approach to classification, but still only reflects the knowledge and experience of the people who created it.
The classifications in Tables 2 and 3 have been produced by the same organisation and Table 1 has commonalities but there are differences. These differences may be a reflection of evolving knowledge and experience, differences in the fundamental requirements of the
organisations commissioning the reports and differences in the focus of the individual reports. So is it really possible to develop a common form to classify surface water management methods that will stand the test of time? The answer is yes, it is possible, providing that the classification focuses on what the different measures do and leave out the benefits. Potential benefits can be identified, but when it comes down to making decisions, it’s down to the decision makers, the advisors and all the stakeholders to take a position on these, not for the developer of the classification system.
On this basis, the classification system developed here focuses on two aspects of the water environment:
Water quantity and flood management Water quality and pollution management
The classification system is described in Section 2 and the performance of different classes of measure under normal and extreme conditions is described in Section 3. For completeness a broad list of other benefits is suggested in Section 4
2
The classification system
2.1
Water quantity and flood management
There are three basic classes into which the different measures fall; measures that store flow, measures that convey flow and measures that control flow. Each category is further sub divided as follows:
2.1.1 Flow storage measures
These are classified by the way that water is emptied from the storage which are:
1. Flow conveyance measures (possibly through controls} 2. Flow infiltration measures (to groundwater)
3. Harvesting measures (for re-use) 4. Evaporation / Evapotranspiration
Flow storage measures can be simple, single celled or complex, multi celled devices.
2.1.2 Flow conveyance measures 1. Sheet flow (over a surface)
2. Channel flow (formal or informal, large or small) 3. Pipe flow (beneath the ground)
4. Ground water flow
2.1.3 Flow control measures 1. Level controls (weirs)
2. Discharge controls (valves and orifices)
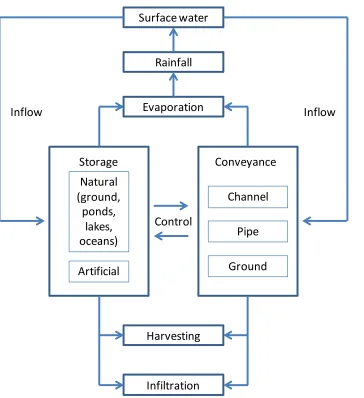
Although the focus within the tables is on surface water management measures, this classification system can also be used to describe any type of water body, even coastal water as the sea is flow storage from which water is removed by evaporation.
The interaction between the different classes with respect to surface water management measures and to inland and coastal water bodies are illustrated in Figures 1 and 2.
2.2
Water quality and pollution management
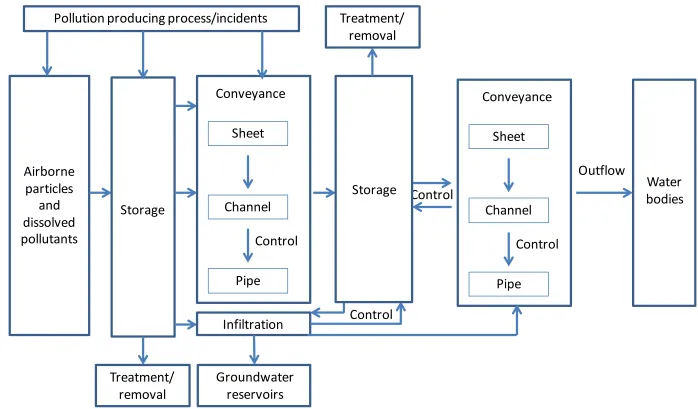
There are two main types of treatment processes; physical ones and biochemical ones, but even biochemical processes require the removal of the physical products at some point in time, which otherwise may be reabsorbed into the system under a given set of circumstances.The difference between sewage treatment processes and surface water management processes lie in the differences in continuity and scale of the processes. Surface water management processes tend to be intermittent and at small scale, whereas sewage treatment processes are largely continuous and can range from small to large scale. Urban surface water runoff, although requiring treatment because it is polluted, is problematic to the sewage treatment process.
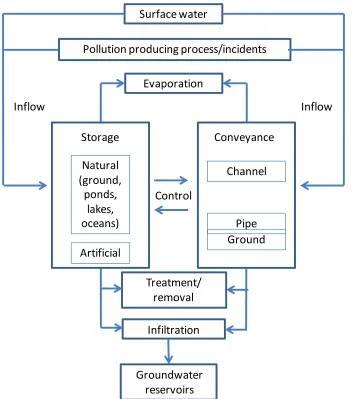
Most treatment methods require the flow rate to be reduced to allow time for treatment process to take place. This means that they are often linked to flow storage and flow control measures. Figures 3 and 4
illustrate these processes for water quality and pollution in a similar way to Figures 1 and 2.
2.2.1 Physical treatment processes
1. Litter and debris removal (Using screens, floatation and separation to remove gross solids)
2. Oil and grease removal (Using floatation and separation) 3. Sedimentation (to remove fine solids and attached pollution) 4. Precipitation (requiring a chemical reaction to cause the
precipitate to form and coalesce)
5. Filtration (to capture very fine particles on a natural or artificial matrix)
6. Pollutant capture and diversion (where pollutant concentrations are captured and diverted for treatment when capacity is available)
2.2.2 Biochemical treatment processes 1. Adsorption
2. Aerobic biological processes 3. Anaerobic biological processes 4. Nutrient removal
Rainfall
Storage
Control
Control
Sheet
Channel
Pipe
Conveyance
Control
Evaporation
Infiltration
Harvesting
Sheet
Channel
Pipe
Conveyance
Control
Storage
bodies
Water
[image:12.842.67.773.77.431.2]Outflow
Control
Evaporation
Infiltration
Harvesting
Channel
Ground
Conveyance
Storage
Natural
(ground,
ponds,
lakes,
oceans)
Artificial
Inflow
Inflow
Pipe
Surface water
[image:13.842.248.612.92.490.2]Rainfall
Airborne
particles
and
dissolved
pollutants
Storage
Control
Control
Sheet
Channel
Pipe
Conveyance
Control
Infiltration
Treatment/
removal
Sheet
Channel
Pipe
Conveyance
Control
Storage
Water
bodies
Outflow
Pollution producing process/incidents
Treatment/
removal
[image:14.842.69.767.68.477.2]Groundwater
reservoirs
Control
Evaporation
Infiltration
Channel
Ground
Conveyance
Storage
Natural
(ground,
ponds,
lakes,
oceans)
Artificial
Inflow
Inflow
Pipe
Surface water
Pollution producing process/incidents
Treatment/
removal
[image:15.842.248.605.70.469.2]Groundwater
reservoirs
3
Performance of the measures under normal and
extreme flow conditions
3.1
Flow storage measures
3.1.1 Normal operation
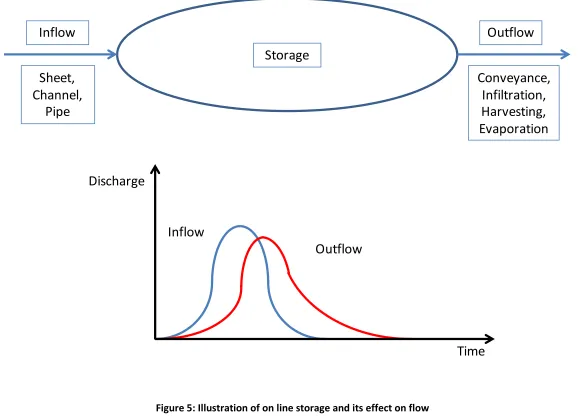
1. Emptying by flow conveyance measures (possibly through controls) There are two basic types of storage within this class:
a. On line storage (Figure 5) in which the flow passes through the storage and then enters the downstream conveyance system.
The storage starts to fill when the rate of flow increases and the depth starts to increase in the outgoing channel or pipe. This means that it normally fills during the first half of an event. As the tank fills the depth of water increases and the pressure pushes more flow down the outgoing channel or pipe. The emptying process is the reverse of this.
Examples of online storage include: swales, river washlands, ponds and lakes
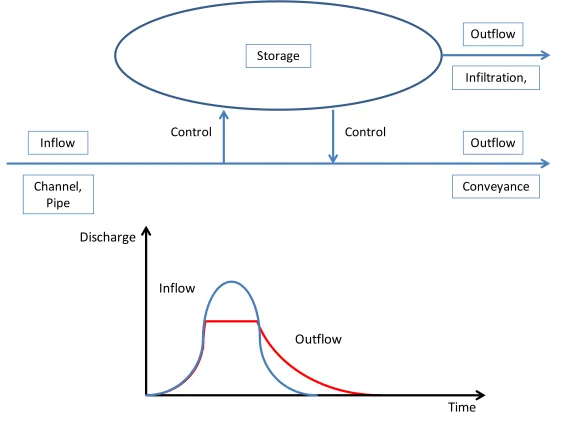
b. Off line storage (Figure 6) in which the storage sits alongside the conveyance system. The flow enters through a control such as a weir and exits through another control such as a non return valve.
The depth of flow in the storage system increases as the capacity of the conveyance system is reached. Eventually
when the downstream conveyance system is at full capacity, the weir level is reached and the storage tank starts to fill. As incoming flows reduce, the storage tank starts to empty through the non return valve as the level in the conveyance system starts to fall.
Examples of off line storage include: river flood storage polders and trench trough surface water management measures (Mulden Rigollen/Wadis)
2. Emptying by flow infiltration measures (to groundwater)
Online and off line tanks can be constructed to empty by infiltration. Storage associated with permeable pavements and dry ponds can be examples of the former and trench trough surface water
management measures are an example of the latter
3. Emptying by harvesting measures (for re-use)
Harvesting measures are normally designed to maximise the benefits of the water that is captured. Therefore as on line tanks maximise the volume of water captured, these are more likely to be used than off line tanks
4. Emptying by evaporation / evapotranspiration
Inflow
Sheet,
Channel,
Pipe
Outflow
Conveyance,
Infiltration,
Harvesting,
Evaporation
Storage
Discharge
Time
Outflow
[image:17.842.138.719.76.492.2]Inflow
Inflow
Channel,
Pipe
Outflow
Infiltration,
Storage
Outflow
Conveyance
Control
Control
Discharge
Time
Outflow
[image:18.842.147.709.73.500.2]Inflow
Online storage
Water quantity and flood management
Because on line storage fills at the beginning of an event, it can often be full before it is really needed as the system nears its design capacity. However it can help to reduce the volume of flow passed down the conveyance system if it is also designed to allow infiltration to take place or alternatively can delay the peak of the flood wave as it passes downstream.
Water quality and pollution management
Because this type of storage starts to operate during almost every event it creates the ideal platform for many physical and
biochemical treatment processes.
Off line storage
Water quantity and flood management
This type of storage doesn’t delay the start of the flood wave as it passes downstream: it passes more water downstream than an online tank and remains empty until it’s needed at the peak of an event. This maximises the combination of the conveyance and storage capacity available to prevent flooding.
Water quality and pollution management
Because off line storage is not designed to fill until later during a rainfall event, it is not as effective as on line storage when used as a surface water management measure for water quality and
pollution management. However, it is as effective as an online tank within a combined sewer system.
Making online storage work like offline storage
It is possible to make online storage act like off line storage by using a variable control mechanism at its outlet. The control which could be a sluice gate or a raising weir can be left open until a specified rate of discharge is reached. At that point the control can then be operated to limit the rate of flow to be passed forward and to start to fill the storage volume. 3.1.2 Extreme operation
Whereas performance in normal operational conditions is largely to do with the type of storage (on line or off line), performance under extreme conditions is not, as the storage will be full when this occurs. In this case, it is a combination of the way in which the storage is emptied, the way that it has been designed and in the case of infiltration, the ground conditions that affect performance.
The rate at which infiltration takes place depends on the type of soil, the depth and location of the underlying bedrock and the level of the water table. If the ground becomes saturated during an event the infiltration rate is likely to reduce and may even become zero. This means that more or even all of the water will have to be conveyed over the surface. Providing a conveyance system does not become drowned by
downstream conditions it will continue to flow at its full capacity during extreme conditions. This means that the need to convey flow over the ground will be minimised. The actual conveyance capacity depends on how the system has been designed and whether or not performance under extreme conditions has been considered. If a system has been designed to operate using conveyance and infiltration, the built conveyance capacity may have been reduced due to the expected infiltration capacity; but if infiltration stops under extreme conditions, then the flow to be managed on the surface will be greater than if only conveyance measures without storage capacity were used.
4
Urban design and other benefits
The following broad classes of benefits have been identified during the research carried out to produce this document:
Water supply Green Infrastructure Amenity
Nature Cooling Air Quality Energy
Economic