RESEARCH
An integrative genomic analysis
of transcriptional profiles identifies
characteristic genes and patterns
in HIV-infected long-term non-progressors
and elite controllers
Jiwei Ding
1†, Ling Ma
1†, Jianyuan Zhao
1, Yongli Xie
1, Jinming Zhou
2, Xiaoyu Li
1*and Shan Cen
1*Abstract
Background: Despite that most HIV-infected individuals experience progressive CD4+ T cell loss and develop AIDS, a minority of HIV-infected individuals remain asymptomatic and maintain high level CD4+ T cell counts several years after seroconversion. Efforts have been made to understand the determinants of the nonprogressive status, exempli-fied by the clinical course of elite controllers (ECs) who maintain an undetectable viremia and viremic nonprogressors (VNPs) who have a normal CD4+ count in spite of circulating viral load. However, the intrinsic mechanism underly-ing nonprogression remained elusive. In this study, we performed an integrative analysis of transcriptional profiles to pinpoint the underlying mechanism for a naturally occurring viral control.
Methods: Three microarray datasets, reporting mRNA expression of the LTNPs or ECs in HIV-infected patients, were retrieved from Gene Expression Ominbus (GEO) or Arrayexpress databases. These datasets, profiled on the same type of microarray chip, were selected and merged by a bioinformatic approach to build a meta-analysis derived tran-scriptome (MADNT). In addition, we investigated the different transcriptional pathways and potential biomarkers in CD4+ and CD8+ cells in ECs and whole blood in VNPs compared to HIV progressors. The combined transcriptome and each subgroup was subject to gene set enrichment analysis and weighted co-expression network analysis to search potential transcription patterns related to the non-progressive status.
Results: 30 up-regulated genes and 83 down-regulated genes were identified in lymphocytes from integrative meta-analysis of expression data. The interferon response and innate immune activation was reduced in both CD4+ and CD8+ T cells from ECs. Several characteristic genes including CMPK1, CBX7, EIF3L, EIF4A and ZNF395 were indicated to be highly correlated with viremic control. Besides that, we indicated that the reduction of ribosome components and blockade of translation facilitated AIDS disease progression. Most interestingly, among VNPs who have a relatively high viral load, we detected a two gene-interaction networks which showed a strong correlation to immune control even with a rigorous statistical threshold (p value = 2−e4 and p value = 0.004, respectively) by WGCNA.
© The Author(s) 2019. This article is distributed under the terms of the Creative Commons Attribution 4.0 International License (http://creat iveco mmons .org/licen ses/by/4.0/), which permits unrestricted use, distribution, and reproduction in any medium, provided you give appropriate credit to the original author(s) and the source, provide a link to the Creative Commons license, and indicate if changes were made. The Creative Commons Public Domain Dedication waiver (http://creat iveco mmons .org/ publi cdoma in/zero/1.0/) applies to the data made available in this article, unless otherwise stated.
Open Access
*Correspondence: lixiaoyu@imb.pumc.edu.cn; shancen@imb.pumc.edu.cn
†Jiwei Ding and Ling Ma contributed equally to this work
1 Institute of Medicinal Biotechnology, Chinese Academy of Medical
Sciences, Beijing 100050, China
Background
Despite the great progress in combination anti-retroviral therapy (cART), AIDS is still a non-curative disease that causes a high death rate every year. It is interesting that there are a small proportion of HIV-infected individuals
who maintain a stable CD4+ T cell count within the
nor-mal reference range over several years from the diagno-sis of HIV infection in the absence of ART and clinical symptoms. These patients with spontaneous and sus-tained control of HIV disease progression were identified
as long term nonprogressors (LTNPs) [1, 2]. Similarly,
there are approximately 1% of HIV-infected patients who maintain undetectable viral load for a prolonged period (generally less than 50 copies/ml), who are identified as elite controllers. These two groups of patients classified by the immunologic parameters or viral parameters rep-resent useful models of natural protection against disease progression and may have important implications for
prophylactic and therapeutic strategies [3]. Thus far it is
still in debate whether viral factor, host or
environmen-tal factor contributes to the LTNP status [2, 4].
Associa-tion of augmented control with attenuated viruses due to deletions or mutations of regulatory proteins or other special viral polymorphism have been reported by
sev-eral researches [5–8]. For instance, a F72L mutation in
HIV-1 Vpr in a LTNP was reported to confer a significant reduction in Vpr nuclear import and virion incorpora-tion implying a link between efficient Vpr nuclear import
and HIV disease progression [9]. Moreover, viruses
iso-lated from some LTNPs were found to have gross dele-tions in nef genes, suggesting the importance for nef
gene in AIDS disease progression [10, 11]. However,
studies of nef genes in elite controller yield contradict-ing results [12, 13]. A phylogenetic analysis revealed that nef sequences from patients with different rates of pro-gression did not form distinct cluster between LTNP and progressors, suggesting the degree of variation in nef is unlikely to be indicative of disease progression [14, 15].
Cellular immune responses have also been reported to contribute to viral control [16, 17]. For instance, a tight
association was observed between Gag specific CD8+ T
cells and viral control [17–20]. Some elite suppression
was linked with higher level of cytolytic granules within
HIV-specific CD8+ T cells [21]. Additionally, CD8+ T
cells isolated from ECs exhibited more polyfunctional
capability in response to HIV specific antigens [22–25].
On the other hand, CD4+ T cells from ECs retained an
ability to proliferate and produce interleukin 2 (IL-2) in response to HIV compared with normal patients under
ART [26]. In addition to CD4+ and CD8+ T
lympho-cytes, a correlation of Interleukin 17 secreting T (Th17) cell level and HIV disease progression was observed in LTNPs compared to TPs, supporting a role of this
cell subset in HIV pathogenesis [27]. Besides, humoral
immune response also plays a role in the context of natu-ral vinatu-ral control. Some researchers have reported that ECs maintained HIV-1 specific memory B cell response which contributed to neutralizing responses in contrast to treated patients [28].
Moreover, various approaches have been undertaken to uncover the host genetic factors or specific genes involved in virologic control of HIV infection in ECs
[29, 30]. A study showed a role of p21 in ECs via
indi-rectly blocking reverse transcription by inhibiting
CDK2-dependent phosphorylation [31]. The HLA class I allele
HLA-B*57 [32, 33] and HLA-B*27 alleles [34, 35] were
overrepresented among elite controllers and viremic controllers (VCs) compared with normal progressors,
which underscored the important role of CD8+ T cells
in naturally viral control. [25]. Most notably, HLA class
I molecules might affect HIV-1 immune control by inter-acting with their receptors on innate immune cells, such as the killer cell immunoglobulin-like receptors (KIR) on natural killer (NK) cells. Two studies reported that activating KIR3DS1 allele in combination with Bw4-80I and KIR3DL1*004 in the presence of HLA-Bw4 showed
a pronounced protection against AIDS progression [36,
37]. Genome-wide association studies have been
car-ried out to decipher the association between naturally occurring single nucleotide polymorphism (SNPs) and
viremic control in ECs and LTNPs [38, 39]. An
interna-tional HIV controllers study identified over 300 SNPs on
chromosome 6 involved in viral control [39]. However,
only approx. 20% of the protective effects can be attrib-utable to the SNPs discovered, indicating other unknown mechanisms were accountable for the observed control. Further studies are necessary to pinpoint more novel pathways and intrinsic host factors responsible for viro-logical control.
In most studies investigating the host intrinsic fac-tors controlling disease progression, only a few ECs or LTNPs were involved and the conclusions are often
Conclusions: We have identified differentially expressed genes and transcriptional patterns in ECs and VNPs com-pared to normal chronic HIV-infected individuals. Our study provides new insights into the pathogenesis of HIV and AIDS and clues for the therapeutic strategies for anti-retroviral administration.
controversial. To overcome this limitation of individual studies, a large-scale transcriptional study was necessary to reduce random error and increase statistical power. In this study, we combined relevant microarray data to increase statistical power to uncover the biological differ-ences between LTNP or ECs and chronic progressors. To decrease the heterogeneity and increase the consistency between different datasets, we only select microarray data from Human Genome U133A or Human Genome U133 plus 2 Array (Affemetrix Company). Furthermore, a new illumina data series GSE87620 was used as a vali-dating set. To be most informative, we conducted our analysis in two steps. First, we combined the three data-sets into meta-analysis derived transcriptome, which provided a comprehensive comparison of nonprogres-sors (NP) with progresnonprogres-sors (PP). Second, we split these
study subjects into three subgroups, namely CD4+ T cell
samples from ECs, CD8+ T cell samples from ECs and
whole blood samples from VNPs, thereby providing an elaborate comparison between aviremic controllers or viremic controllers and progressors. Differential expres-sion analysis, gene set enrichment analysis and WGCNA approach were carried out in each step. Our study have revealed some characteristic biomarkers and transcrip-tional patterns and highlight several key genes in non-pathogenic individuals, Most strikingly, we identified key transcriptional modules in VNPs which have never been reported before. These findings may better the under-standing of HIV-1 viremic and immune control and AIDS progression.
Methods
Selection of studies and datasets
Expression profiling studies including LTNPs or ECs were identified through Gene Expression Omnibus
(GEO, http://www.ncbi.nlm.nih.gov/geo) using search
term (“long term no progressor” OR “elite controller”). To ensure the relevant studies were not missed, search
in Arrayexpress (http://www.ebi.ac.uk/array expre ss)
was also performed. Nine microarray gene expression
datasets, reporting expression data of LTNPs or ECs and normal patients were retrieved from public repositories. Three datasets (GSE24081, GSE6740 and GSE57730) pro-filing on the same version of microarray chips [Human Genome U133 Plus 2.0 Array (HG-U133_Plus_2) or Human Genome U133A ver2.0 (U133A)], met the inclu-sion criteria and were included in the integrated analysis to build a MADNT set. The characteristics of these
data-sets were listed in Table 1. Detailed clinical parameters
of each patient involved were listed in Additional file 1:
Table S1.
Data processing
Microarray meta-analysis were carried out according
to the guidelines described in [40]. Each datasets were
log2 transformated and normalized by Agilent Gene-Spring software (Version 11.5, Agilent, USA). Then, gene matching was done for all probes. When multiple probes matched the same gene symbol, the probe presented the greatest inner-quartile range (IQR) was selected to rep-resent the target gene symbol. After matching all the probes to a common gene symbol, “MetaDE” R package
[41] was exploited to merge the common gene symbols
across multiple studies by p value combination using Fisher methods. Differentially expressed genes were
selected with adjusted p value < 0.05, based on false
dis-covery rate (FDR) by the Benjamini–Hochberg procedure and moderated t test.
Enrichment analysis
Enrichment analysis for KEGG pathway and Gene
Ontol-ogy terms were carried out by David online tool (https ://
david .ncifc rf.gov). Gene set enrichment analysis (GSEA)
[42] was carried out using GSEA version 3.0, downloaded
from the Broad Institute (http://www.broad insti tute.org/
gsea/downl oads.jsp). Expression data sets and phenotype labels were created according to GSEA specifications. Gene set permutations were set to be done 1000 times for each analysis using the weighted enrichment statistic
Table 1 General information of each dataset
PP progressor, NP nonprogressor, EC elite controllers, VNP viremic nonprogressor
First author GEO number Platform Sample source Sample size (PP/NP)
Martin Hyrcza GSE6740 GPL96; Affymetrix Human Genome U133A Array CD4+ T cell
CD8+ T cell PP *3 NPs are ECs and 2 = 10; NP = 10 with extremely low viral load
W. Nicholas Haining GSE24081 GPL3921; Affymetrix HT Human Genome U133A Array CD8+ T cell PP = 18;NP = 24 *All NPs are ECs Gregory K Tharp GSE57730 GPL570; Affymetrix Human Genome U133 Plus 2.0 Array Whole blood PP = 7; NP = 5
[image:3.595.58.541.612.714.2]and signal to noise metric. Gene sets with FDR lower than 0.05 were considered significant.
WGNCA
Weighted gene coexpression network analysis (WGCNA)
is a gene coexpression network-based approach [43, 44].
A gene co-expression network is defined as undirected, weighted gene network, in which the nodes represent expression profiles while edges represent pairwise cor-relation between gene expressions. Briefly, corcor-relation coefficient Smn between characteristic gene m and gene n is calculated by their expression values between
differ-ent samples using the formulation: Smn = |cor(mn). The
correlation matrix was then transformed into an undi-rected network by raising the absolute value of each entry to a power β using 6 as correlation coefficient thresh-old. Genes were clustered into different modules using dynamic tree cutting method.
Protein–protein interactions (PPI) networks in each module were visualized by Cytoscape 3.6.0. The Network Analyzer examined the network for topological param-eters, including degree, connectivity, betweenness and closeness.
HIV infection assay and western blotting
To analyze the antiviral activity of several up-regulated genes, HIV infection assay was performed as previously
described [45, 46]. Briefly, 200 ng pNL4-3-R-E-Luc vector
and 150 ng pCMV-VSV-G packaging vector were trans-fected into the 293T cells together with 200 ng empty pCMV6-Entry vector, control gene (SLFN11, GADD45G) or pCMV6-Entry-CMPK1, ZNF395, METTL9, GADD45A, PKKAR2B, OAT, CHPT1, SPOCK2 and CBX7 in 12-well plate using Lipofectamine 2000 (Thermo Scientific) according to the manufacturer’s instructions. The old culture medium was replaced with fresh cul-ture medium at 6 h post-transfection. Subsequently, the supernatants were collected at 48 h post-transfection and cleared by filtration with the 0.45 μm filter. Cell lysis were harvested for SDS-PAGE and western blotting with α-myc, p24 (Gag) and β-actin antibody, respectively. The amount of (infectious) virus particles in the supernatants was determined via one-cycle infection assay. For
infec-tion assays, 200 μl of 1 × 10⁵ SupT1 or Jurkat cells per
well in 96 well plate were infected with supernatants col-lected from 293T cells. At 48 h post-infection, the SupT1 cells were lysed and luciferase activity was determined using a firefly Luciferase Assay System (Promega).
293T cells were maintained at 37 °C in high glucose Dulbecco’s modified Eagle medium (DMEM) supple-mented with 10% fatal bovine serum (Gibco). SupT1 and Jurkat cells were maintained at RPMI 1640 Medium with 10% fetal bovine serum.
Results
Description of datasets
We searched two public repositories for mRNA tran-scriptional profile related to viremic control using the search term” “elite controller” [OR] “long-term non-progressors”. The inclusion criteria were set as (1) the microarray chips used in the study was from Human Genome U133A or Human Genome U133 plus 2 Array
(Affemetrix Company); (2) sample source was CD4+,
CD8+ T cells or whole blood. Three studies met the
inclusion-criteria were selected for the meta-analysis study. Details about these datasets were outlined as in
Table 1. The three series included 35 PPs, 34 ECs (except
for two patients with extremely low viremia) and 5 VNPs. The following information was extracted from each data series including GEO number, author name, sam-ple source, platform and the number of progressors and controllers.
Microarray meta‑analysis
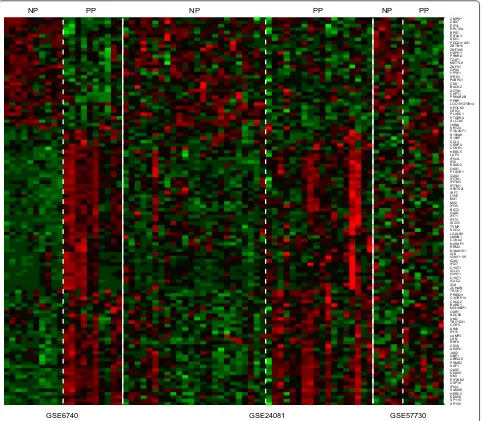
To compile expression data for meta-analysis, Cel raw data was firstly preprocessed by GeneSpring 11.5 soft-ware (Agilent Technologies, Santa Clara, CA). The background subtraction, normalization, and log base 2 transformation of gene signals were carried out using Robust Multi-Array Analysis (RMA) summarization algorithm. Quality of each dataset was assessed in spring and expression data was retrieved from Gene-Spring. MetaDE packages were exploited to combine the three datasets and differentially expressed genes (DEG) in NPs compared to normal chronic progressors. DEG p value in each study was calculated by moderated-t statis-tical analysis. Fisher combined probability test was cho-sen for meta-analysis statistical method. For statistics, Benjamini and Hochberg method was used for multiple testing correction. Genes with FDR less than 0.05 was accepted as DEGs. We found 30 upregulated DEG and 83
down-regulated DEGs in NPs compared with PPs (Fig. 1).
Up-regulated genes included CMPK1, CD9, METTL9, EIF4A3, ZNF395 and so on, while down-regulated genes were overrepresented by CD38, LAG3, some Interferon-stimulated genes (ISGs) and inflammatory genes. Upreg-ulated and down-regUpreg-ulated DEGs in the comparison of
NPs and PPs were shown in Additional file 2: Table S2.
response” and “B cell signaling pathway” were enriched
in down-regulated genes (Fig. 2a). In the pathway
analy-sis, several anti-viral response pathways was enriched, including “Measles”, “Influenza A”, “Hepatitis B” and
“Hepatitis C” (Fig. 2b). The analysis failed to enrich GO
terms or KEGG pathways with FDR less than 0.05 in up-regulated genes. Unlike down-regulated genes, the biological meanings with up-regulated genes were spo-radic and their relevance to AIDS disease progression was not immediately clear. Furthermore, night genes (CMPK1, METTL9, CHPT1, OAT, GADD45A, SPOCK2, CBX7, ZNF395 and PPKAR2B) were selected to validate
the anti-HIV activity. 293T cells were transfected with NL4-3lucR-E- and VSV-G along with these genes, empty vector or control genes (GADD45G, SLFN11). 48 h post-transfection, the supernatant was harvested and used for infecting SupT1 and Jurkat cells. After another 48 h, luciferase activity in SupT1 or Jurkat cells was measured to assess the anti-HIV activity. CMPK1, GADD45A, PPKAR2B and CHPT1 suppressed HIV-1 production by more than twofold. METTL9, ZNF395 SPOCK2 and OAT exerted a moderate inhibitory effect on HIV-1 production. Notably, GADD45A inhibited HIV-1
pro-duction by more than eightfold in Jurkat cells (Fig. 2c).
SP100SP110 DDX58 HERC6 SAMD9 IFI44 USP18 EIF2AK2 NMI DDX60 OAS2 XAF1 PSME2 UBE2L6 GBP1 JAK2 AKAP2 CD38 RNF8 LXN LAMP3 IFI16 AIM2 CCR5 TBC1D31 UNG NDC80 OXR1 MIS18BP1 BARD1 CHI3L2 C3ORF14 PRSS23 TRGV7 JCHAIN IGK IGLC2 CYAT1 IGHG1 IGLC1 CYAT1 IFI27 IGKC IGKV1−39 IGK KIAA0101 RRM2 NUSAP1 CCNA2 LMNB1 LGALS9 SCO2 TYMP ISG15 IFIT3 IFIT1 OASL BST2 IFI35 MX2 MX1 LY6E IRF7 SPATS2L IFITM1 IFITM3 IFITM1 OAS2 PLSCR1 OAS1 RSAD2 IFI6 IFI44L LAP3 HERC5 CCNE1 CENPU CCL3 S100P S100A9 POU2AF1 KRT24 LMNA SLC7A5 PTGER4 PLXDC1 LRIG1 SPOCK2 LOC105370914 PPBP PRKAR2B CHPT1 ACTN1 BACH2 CD9 PABPC1 IFRD1 VPS51 GPX4 ZNF91 METTL9 TGIF1 PRKRA HSPH1 ZNF395 ZBTB10 PDCD4−AS1 DSC1 EIF4A3 RPS7 RPL10A EIF3L CBX7 CMPK1
NP PP NP PP NP PP
GSE6740 GSE24081 GSE57730
[image:5.595.59.541.88.509.2]GADD45G, the expression of which varied little between NPs and PPs was used here as a negative control gene and showed no effect on HIV replication. SLFN11 which was reported to inhibit HIV-1 production in the
previ-ous studies was used here as a positive control [47]. To
further investigate whether these up-regulated DEGs influences the expression of HIV gene, Gag expression in 293T cells was assessed by Western blotting. CHPT1, CMPK1, GADD45A, OAT, METTL9, PPKAR2B and
ZNF395 significantly decreased the expression of HIV-1
Gag (Fig. 2d). The functional assay confirmed the
reliabil-ity of our analysis results.
A pilot study reported that serum from LTNPs and ECs have distinct neutralizing capabilities and anti-body-dependent cellular cytotoxicity (ADCC)
activ-ity [48]. To uncover the divergent transcription pattern
between aviremic controllers and VNPs from different cell types, study subjects were grouped into three subsets
Gene Ontology of down-regulated DEGs (MADNT)
Type I interferons signaling pathway -log(pvalue) defense response to virus
response to virus negative regulation of viral genome replication
postive regulation of interleukin-1 beta production negative regulation of type I interferon production response to type I interferon response to interferon alpha
response to interferon-gamma
signaling
response to interferon beta innate immune response
immune response B cell receptor signaling pathway
ISG15 protein conjugation interferon gamma-mediated signaling pathway
0 5 10 15 20 25 30 1 3 4 6 7 -log(pvalue)
KEGG enrichment of down-regulated DEGs (MADNT)
Measles Influenza A Herpes Simplex infection
Cytosolic DNA-sensing pathway RIG-I like receptor signaling pathway Epstein-Barr virus infection Hepatitis C
Hepatitis B Viral Carcinogenesis
0 2 5
β-actin DEGs Gag
EV SLFN11 CHPT1 CMPK
1
GADD45
A
OA
T
METTL9 PPKAR2
B
ZNF395 CBX7 SPOCK2 GADD45
G
SupT1
EV SLFN11CHP
T1 CMPK
1 GADD
45AOAT METT
L9 PPKA
R2B ZNF3
95 CBX7
SPOC K2 GADD
45G
0.0 0.5 1.0 1.5
Re
la
tive
Luc
ac
tivi
ty
Jurkat
0.0 0.5 1.0 1.5
Re
la
tive
Luc
ac
tivi
ty
EV SLFN11CHP
T1 CMPK
1 GADD45A
OAT METT
L9 PPKA
R2B ZNF3
95 CBX7
SPOC K2 GADD
45G a
c d
b e
[image:6.595.56.541.86.499.2]aforementioned. Data of CD8+ T cells from two datasets were merged into a combined transcriptome by MetaDE
package. 115 DEGs were identified in CD8+ T cells
(Additional file 3: Table S3), which highly overlap with
those identified in MADNT. Only 4 DEGs (OAS3, IFI44,
IFI44L and EIF2AK2) were identified in CD4+ T cells of
ECs (Fig. 2e), and no DEGs met the criteria (FDR < 0.05)
in VNPs.
Taken together, statistical combination of the relevant datasets has created a meta-analysis derived nonprogres-sor transcriptome (MADNT) and different subgroups, which can be subject to downstream GSEA and WGCNA analysis.
Gene set enrichment analysis
Given the limited power to detect the transcriptional pattern in up-regulated genes in LTNPs and ECs, GSEA was carried out to investigate the intrinsic common fea-tures associated with virological or immunologic con-trol. Rather than setting a cutoff value for single DE genes, GSEA evaluates the whole dataset at biological pathway level by performing unbiased global search for predefined gene sets. MADNT and different subgroups mentioned above were interrogated for pathway enrich-ment using canonical pathway from MSigDb 2 GO-BP collection and also C2 (KEGG and Reactome) collec-tion. Fourteen pathways were enriched with FDR less than 0.05 in NPs which included “KEGG_RIBOSOME”,
“3′UTR mediated translational regulation”, “Nuclear
tran-scribed mRNA catabolic process nonsense-mediated decay“, ”SRP-dependent cotranslational protein
target-ing to membrane” and “translational initiation” (Fig. 3a).
Besides, we noticed that KEGG pathway “Graft verse host disease” was also enriched at moderately signifi-cant level (FDR around 0.19 and nominal p < 0.03), which included DQB1, DQA1, DOB, HLA-DMA and HLA-DOA. More than 30 pathways were enriched in progressors, which included “responses to type I interferon”, “mitotic cell cycle”, “defense response to virus”, “innate immune response” and “regulation of interleukin_1 beta production”. Furthermore, to validate the reliability of these datasets from Affemetrix microar-ray, we selected another dataset (GSE87620) published recently, using illumina Human HT-12 V4 microarrays. Using GSE87620 as a validating set, we selected the up-regulated genes with FDR < 0.05 using online tool GEO2R
and performed Gene Ontology annotation (Fig. 3b). The
enriched pathways were highly consistent with the results from MADNT. “translational initiation”, “SRP-depend-ent cotranslational protein targeting to membrane” and “nuclear-transcribed-mRNA catabolic process, non-sense-mRNA decay” was enriched in NPs.
In the aspect of stratification subgroup, 6 pathways
were enriched with FDR less than 0.25 in CD4+ T cells of
ECs which included “multi organism metabolic process”, “translational initiation”, “Nuclear transcribed mRNA catabolic process nonsense-mediated decay”, “protein targeting to membrane”; Similarly, 32 pathways were
enriched with FDR less than 0.01 in CD8+ T cells of ECs,
most of which were associated with pathways related to translation and protein-targeting to membrane (Addi-tional file 4: Table S4).
Weighted gene co‑expression network analysis
WGCNA provides insights to disease pathogenesis by studying co-expression genes between clinical samples based on gene expression correlation coefficients. The reliability of this algorithm depends on a large sample size, which we are able to apply the MADNT and two
subgroups (CD8+ T cells (EC) and VNP) expression set
into WGCNA analysis.
Using WGCNA, 15 distinct modules was found
(Fig. 4a). The expression data from different genes within
each calculated module was used to determine the mod-ule epigengenes (ME, the first component of the respec-tively module), which was correlated to the clinical parameter (AIDS progression). Several modules showed significant positive correlation with lose of viremic
con-trol, including the tan modules (p = 4e−07, correlation
coefficient = 0.55) and purple modules (p = 0.001,
corre-lation coefficient = 0.37) and grey60 module (p = 0.003,
correlation coefficient = 0.34) (Fig. 4b). However, no
modules were obviously correlated to viremic control. For the three modules related to disease progression, 39 characteristic genes were subject to functional annota-tion and pathway enrichment. They were totally enriched in 19 GO terms. The genes were largely related to type I interferon signaling pathway (IFIT1, IFIT3, IFI6, OAS1, OAS2, MX1), complement activation (IGHA1, IGHD, IGHG1, IGHM, IGKV1-17, IGKV1-37, IGKV1-39) and positive regulation of B cell activation (IGHA, IGHD, IGKC, IGLC1). Additionally, PPI networks of the three
modules were visualized by Cytoscape 3.6 (Fig. 4c).
RRM2, IGLC2 and RSAD2 were the hub genes of grey60, purple and tan modules, respectively.
As to the stratification subgroup, WGCNA approach
was applied to CD8+ T cells of ECs and VNPs,
respec-tively. We identified 24 distinct coexpression
mod-ules in CD8+ T cells containing 28 to 1174 genes per
module. Salmon module showed a strong positive cor-relation with AIDS progression including CD38 and ISGs which is consistent with DEG and GSEA
analy-sis. Magenta and purple module (Additional file 5:
cellular response to stress (DNAJA1, HSPA5, PIK3R1 and PMAIP1), leukocyte migration (SCL7A5, YES1, B4GALT1, NRAS, PDE4B, PIK3R1 and PODXL) and
response to cytokines (REL, SKIL, MAPKAPK2 and NFKB2). Interestingly, two modules were significantly associated with immune control in VNPs (darkturquoise, translational initiation
cell-cell adhension SRP-dependent cotranslational protein targeting to membrane
regulation of mRNA stability mRNA splicing, via splicesome
cytoplasmic translation nuclear transcribed-mRNA catabolic process, nonsense-mediated decay
viral transcription
rRNA processing
mRNA processing translation
RNA splicing
0 5 10 15 20 25 30
Gene Ontology of up-regulated genes (GSE87620)
-log(pvalue) NES=2.16
FDR=0.005 NES=2.09FDR=0.008
NES=1.92 FDR=0.038
NES=1.82 FDR=0.008
NES=1.90 FDR=0.096
a
b
[image:8.595.56.538.86.614.2]ME correlation = 0.87, p-value = 2e−4; red, ME
correla-tion = 0.77, p-value = 0.004) (Fig. 5a). ZNF395,
PDCD4-AS1 and EIF4A3 that are among the 30 up-regulated genes were involved in the darkturquoise module, Nota-bly, KIR2DS3 and KIR3DL3 which were reported to affect immune control of HIV by interacting with HLA-B molecules in a specific manner also appeared in the dark-turquoise module. We failed to enrich GO or KEGG terms of these modules, probably indicating unknown important pathways or interactions between genes in these two modules accounting for the immune control in
VNPs. PPI networks of the two modules were visualized by Cytoscape 3.6 (Fig. 5b, c).
Discussion
Increasing transcriptional profiles allowed us to inves-tigate the significant genes and functional pathways rel-evant to viral control in ECs and VNPs in a large scale level. In this study, we adopted an integrative approach to uncover the transcriptional patterns in LTNPs and ECs and identified several key genes and functional pathways
0.
60
.7
0.
80
.9
1.
0 Cluster Dendrogram
Height
Merged dynamic Dynamic Tree cut
HIV progression
−0.072 (0.5) −0.16 (0.2) −0.081
(0.5) 0.13 (0.3) −0.024
(0.8) 0.087 (0.5) −0.14 (0.2) 0.1 (0.4) −0.053
(0.7) −0.055
(0.6) 0.34 (0.003)
0.37 (0.001)
0.14 (0.2) 0.22 (0.06)
0.55 (4e−07)
Module−trait relationships
−1 −0.5 0 0.5 1 MEyellow
MElightcyan MEgreenyellow MEcyan MEbrown MEmidnightblue MEmagenta MEsalmon MEblack MEred MEgrey60 MEpurple MEpink MEgreen MEtan
KIAA0101 RRM2
CCNB2 KIF18B CEP55
TOP2A MKI67 SPC25
OAS1
PLSCR1
IFI44L
IFI6 OAS2
MX1
IFIT1 IFIT3
XAF1 IFI44 RSAD2
IGK
IGKV1D-13
IGLL3P
IFI27
IGLV IGLC1
IGH IGKV1-37
JCHAIN IGHA1
IGLJ3 IGKC
CYAT1 IGHG1 IGKV1-17
IGHM IGKV1-39
IGHD
IGKV2-28
IGLC2
a
c
b
[image:9.595.61.541.87.489.2]which are significantly connected to viral control and dis-ease progression.
We found several common genes up-regulated in all ECs and VNPs, some of which have never been reported before, including ZBTB10, ZNF395, GPX4, CHPT1, METTL9, SPOCK2, EIF4A3, GADD45A, SLC75A, TGIF1, CMPK1, LMNA, PLXDC1 and BACH2. GADD45A is a stress-induced protein and participate in various cellular pathways. A recent study reported that overexpression of GADD45 proteins reduces HIV-1 production through suppressing transcription from
the HIV-1 LTR promoter [49]. We have experimentally
examined several up-regulated genes for their anti-HIV
activity in cell lines, most of which were demonstrated to suppress the replication of VSVG-pseudotyped HIV-luc viruses. The biological relevance of these up-regulated genes in the context of HIV pathogenesis needs further investigation.
On the other hand, an arsenal of ISGs were down-reg-ulated in NPs compared to chronic progressors, which further debates the role of interferon in chronic HIV infection. Several researches by other groups observed similar phenomenon. Margalida Rotger showed sev-eral ISGs (IF44, MX1, EIF2AK2, IFI6, LY6E, TRIM22) were up-regulated in RPs who got a progressive immu-nosuppression soon after seroconversion while a lower
Module−trait relationships −1 −0.5 0 0.5 1 MEsteelblue MEdarkgreen MEviolet MEtan MElightgreen MElightsteelblue1 MEblack MEbrown4 MEdarkolivegreen MEsalmon MEdarkturquoise MEred MEgreen MEblue MEmidnightblue MEdarkmagenta MEdarkorange MEfloralwhite MEpink MEdarkgrey MEdarkslateblue MEbrown MEcyan MEgrey 0.26 (0.4) 0.024 (0.9) −0.55 (0.07) 0.16 (0.6) 0.32 (0.3) −0.015 (1) −0.39 (0.2) −0.31 (0.3) −0.47 (0.1) −0.29 (0.4) −0.87 (2e−04) −0.77 (0.004) 0.23 (0.5) 0.29 (0.4) 0.32 (0.3) 0.44 (0.2) 0.16 (0.6) 0.58 (0.05) 0.32 (0.3) 0.3 (0.3) 0.67 (0.02) 0.44 (0.2) −0.25 (0.4) −0.2 (0.5) HIV progression ETFDH RRN3P1 IQCA1 MMP20 MOBP RNF43 GNG5 IGFBP1 GPS1 PTPRE CHI3L1 NEUROG2 SLC4A4 C22ORF24 MYH2 GPC3 ADGRB3 GALC PLXNB1 PADI1 ADGRG3 LOC100131510 HYPK BET1L TMEM14B SEC14L3 NT5C1B-RDH COL9A2 KCTD17 FBXW12 GYPE RIMS1 LHFP TLR6 VRTN DCPS AGFG2 BACH2 ORC2 NEK3 SPOCK3 KIAA0125 MAGEA10-MAGEA5 KCTD3 EFNA3 GPR6 MSX2 CCL23 HCRT SCAND2P THUMPD2 LEP CEMP1 NRBP1 FXYD6 HLA-DRB6 LOC440792 DFFB DDX11 LINC00302 DGCR5 RAB15 TAS2R4 PARD3 HIST1H4F TGFBI PSG2 FAAP24 EIF4A3 PDLIM4 BRDT KIR2DS3 RBX1 PDCD4-AS1 MED20 ZNF395 KLK5 CCNF NHLH1 TMPRSS5 CBY1 SPTBN5 LTN1 MIR622 DNAJA4 GRIK4 MGAT4C TEX2 RPH3AL CDRT1 UCK2 TBX5 NAA15 SCUBE3 PRTN3 KIR3DL3 RYR3 UGGT2 FUT5 LUNAR1 LOC157562 a c b
[image:10.595.57.538.89.475.2]expression of ISGs was observed in CD8+ T cells in
viremic nonprogressor (VNP) profile [50]. Sankaran et al.
reported a significant increase in gene expression regu-lating immune activation and inflammatory response in intestinal mucosa in HIV-infected patients with high
viral load compared to LTNPs [51]. In accordance with
this, CD38 and LAG3 which were found to be elevated in RPs have also been identified in our analysis. Consist-ent with this knowledge, a research reported a signifi-cant increase of ISG expression with increased viral load,
including genes of intrinsic antiretroviral defense [52].
Currently, the contribution of IFN-Is to the control of viral infection and to the immunopathogenesis of AIDS
is still under debate [53, 54]. Supportively, Liang [55]
implied that type I interferon contributed to aberrant immune activation, T cell depletion and dysfunction dur-ing chronic HIV-1 infection. They found that persistent HIV-1 infection in humanized-mice led to induction of IFNs and ISGs including MX2, IFITM3, Trim22, ISG15, OAS1, and IFN regulatory factor 7 (IRF7) both in periph-eral blood mononuclear cells (PBMCs) and in the spleen. They also observed the enhanced expression of CD38 and HLA-DR, similar to our data. Persistent immune
activation plays a central role in CD4+ T cell depletion
and progression to AIDS and may be considered to be a predictor of disease progression in ART-naïve patients. Taken together, our analysis supports the concept that IFNs and ISGs are a double-edged sword during chronic infection and highlighted the caution of IFNs usage in HIV-1 chronically infected patients.
Given the limited power of classical function annota-tion, GSEA and WGCNA algorithm was performed on our combined transcriptional profile individually.
Path-ways including “translational initiation”, “3′UTR mediated
translational regulation” and “nuclear transcribed-mRNA nonsense-mediated decay” were shown to be positively correlated with viremic control. In contrast, pathways related to interferon and immune response, complement activation and cell cycle seemed to be highly correlated with AIDS disease progression. Notably, ribosomal sub-stitutes including RPS20, RPS28, RPS15A, RPS25, RPS6, RPS21, RPS3, RPL36, RPL9, RPL31, RPL23, RPL27, RPL30, RPL29, RPL35 and translational initiation fac-tors including EIF2S3, EIF1, EIF2C2, EIF4G2, EIF4A3 were elevated in NPs compared with chronic progres-sors by GSEA analysis. This indicates that defects in ribosome components and blockade of translational ini-tiation probably play a significant deleterious role in HIV progression. In agreement with our findings, a recent study reported several ribosomal formation genes includ-ing RPL27, PRS7, RPL24, RPS13 and RPL10L was down
regulated in NK cells from HIV infected individuals [56].
Our most interesting findings were the identification of
gene networks which were highly associated with non-progression status in VNPs. These patients who retained a functional immune control of circulating viruses repre-sented a very perplexing question pertinent to the LTNP status. Our findings hopefully provide a clue to resolve the mystery.
Nevertheless, we can not rule out the possibility that the changed transcription level of some gene found herein may reflect a consequence rather than a cause of low viral replication in LTNPs. The role of these candi-date genes reported herein in controlling HIV-1 infection awaits further investigation.
Conclusions
In summary, our integrative analysis of microarray data relevant to ECs and VNPs provides an overview of the biomarkers and transcriptional patterns in nonpatho-gen individuals compared with chronic progressors. We observed that HIV controllers had reduced immune acti-vation and interferon response, which collaborates the concept that interferons might play a deleterious role in AIDS disease progression. Moreover, we have identified several key genes responsible for the non-progressive sta-tus, some of which were validated in cell lines. We also detected several pathways that may be related to the exacerbation of immunosuppression in AIDS patients, i.e., blockade of translation and dysfunction of T cell homeostasis. Altogether, our integrative genome-wide analysis has provided new knowledge for HIV-1 patho-genesis and immune intervention of the disease progres-sion of AIDS.
Additional files
Additional file 1. Clinical parameters of patients involved.
Additional file 2. DEGs in NPs compared with PPs in MADNT.
Additional file 3. DEGs in NPs compared with PPs in CD8+ T cells.
Additional file 4. Pathways enriched in CD8+ T cells from ECs analyzed by GSEA.
Additional file 5. Genes in modules correlated with protection in CD8+ T cells (EC).
Abbreviations
cell; IRF7: IFN regulatory factor 7; IQR: inner-quartile range; DMEM: Dulbecco’s modified Eagle medium.
Authors’ contributions
DJW performed the majority of work described here. DJW and ML wrote and edited the manuscript. ZJY and XYL collected and examined the data. SC and XYL supervised the project. All authors read and approved the final manuscript.
Author details
1 Institute of Medicinal Biotechnology, Chinese Academy of Medical
Sci-ences, Beijing 100050, China. 2 Key Laboratory of the Ministry of Education
for Advanced Catalysis Materials, Department of Chemistry, Zhejiang Normal University, Jinhua, Zhejiang 321004, China.
Acknowledgements
We are grateful to Charles MA (University of Pittsburgh) for helpful advices on MetaDE Package. We thank National Infrastructure of Microbial Resources (NIMR-2014-3) for providing valuable reagents.
Competing interests
The authors declare that they have no competing interests.
Availability of data and materials
All data in the current study are based on public data available in the Gene
Expression Omnibus (GEO) datasets (http://www.ncbi.nlm.nih.gov/geo/).
Consent for publication
All the authors have read and approved the paper and declare no potential conflicts of interest in the paper. If their paper is accepted, all the authors will observe the terms of the license to publish.
Ethics approval and consent to participate
Not applicable.
Funding
This work was supported by The National Mega-Project for Infectious Disease (2018ZX10301408 SC), The National Key Research and Development program of China (2016YFD0500307 SC), The National Natural Science Foundation of China (81772205 SC), CAMS innovation fund for Medical Sciences (2018-I2M-3-004, 2016-I2M-2-002 XYL and 2017-I2M-1-012 YXZ) and Xiehe Scholar to SC.
Publisher’s Note
Springer Nature remains neutral with regard to jurisdictional claims in pub-lished maps and institutional affiliations.
Received: 3 October 2018 Accepted: 9 January 2019
References
1. Imami N, Westrop SJ, Grageda N, Herasimtschuk AA. Long-term non-progression and broad HIV-1-specific proliferative T-cell responses. Front Immunol. 2013;4:58.
2. Saksena NK, Rodes B, Wang B, Soriano V. Elite HIV controllers: myth or reality? AIDS Rev. 2007;9(4):195–207.
3. Grabar S, Selinger-Leneman H, Abgrall S, Pialoux G, Weiss L, Costagliola D. Prevalence and comparative characteristics of long-term nonprogressors and HIV controller patients in the French Hospital Database on HIV. Aids. 2009;23(9):1163–9.
4. Gonzalo-Gil E, Ikediobi U, Sutton RE. Mechanisms of virologic control and clinical characteristics of HIV+ elite/viremic controllers. Yale J Biol Med. 2017;90(2):245–59.
5. Blankson JN, Bailey JR, Thayil S, Yang HC, Lassen K, Lai J, et al. Isolation and characterization of replication-competent human immunodeficiency virus type 1 from a subset of elite suppressors. J Virol. 2007;81(5):2508–18. 6. Wang B, Dyer WB, Zaunders JJ, Mikhail M, Sullivan JS, Williams L, et al.
Comprehensive analyses of a unique HIV-1-infected nonprogressor reveal
a complex association of immunobiological mechanisms in the context of replication-incompetent infection. Virology. 2002;304(2):246–64. 7. Lum JJ, Cohen OJ, Nie Z, Weaver JG, Gomez TS, Yao XJ, et al. Vpr R77Q is
associated with long-term nonprogressive HIV infection and impaired induction of apoptosis. J Clin Investig. 2003;111(10):1547–54.
8. Yamada T, Iwamoto A. Comparison of proviral accessory genes between long-term nonprogressors and progressors of human immunodeficiency virus type 1 infection. Adv Virol. 2000;145(5):1021–7.
9. Caly L, Saksena NK, Piller SC, Jans DA. Impaired nuclear import and viral incorporation of Vpr derived from a HIV long-term non-progressor. Retro-virology. 2008;5:67.
10. Kirchhoff F, Greenough TC, Brettler DB, Sullivan JL, Desrosiers RC. Brief report: absence of intact nef sequences in a long-term survivor with nonprogressive HIV-1 infection. N Engl J Med. 1995;332(4):228–32. 11. Salvi R, Garbuglia AR, Di Caro A, Pulciani S, Montella F, Benedetto
A. Grossly defective nef gene sequences in a human immunode-ficiency virus type 1-seropositive long-term nonprogressor. J Virol. 1998;72(5):3646–57.
12. Pushker R, Jacque JM, Shields DC. Meta-analysis to test the association of HIV-1 nef amino acid differences and deletions with disease progression. J Virol. 2010;84(7):3644–53.
13. Brambilla A, Turchetto L, Gatti A, Bovolenta C, Veglia F, Santagostino E, et al. Defective nef alleles in a cohort of hemophiliacs with progressing and nonprogressing HIV-1 infection. Virology. 1999;259(2):349–68. 14. Michael NL, Chang G, d’Arcy LA, Tseng CJ, Birx DL, Sheppard HW.
Functional characterization of human immunodeficiency virus type 1 nef genes in patients with divergent rates of disease progression. J Virol. 1995;69(11):6758–69.
15. Mourich DV, Lee S, Reyes-Teran G, Mackewicz CE, Levy JA. Lack of differ-ences in nef alleles among HIV-infected asymptomatic long-term survi-vors and those who progressed to disease. AIDS Res Hum Retroviruses. 1999;15(17):1573–5.
16. Pernas M, Casado C, Arcones C, Llano A, Sanchez-Merino V, Mothe B, et al. Low-replicating viruses and strong anti-viral immune response associ-ated with prolonged disease control in a superinfected HIV-1 LTNP elite controller. PLoS ONE. 2012;7(2):e31928.
17. Edwards BH, Bansal A, Sabbaj S, Bakari J, Mulligan MJ, Goepfert PA.
Magnitude of functional CD8+ T-cell responses to the gag protein of
human immunodeficiency virus type 1 correlates inversely with viral load in plasma. J Virol. 2002;76(5):2298–305.
18. Goonetilleke N, Liu MK, Salazar-Gonzalez JF, Ferrari G, Giorgi E, Ganusov VV, et al. The first T cell response to transmitted/founder virus con-tributes to the control of acute viremia in HIV-1 infection. J Exp Med. 2009;206(6):1253–72.
19. Berger CT, Frahm N, Price DA, Mothe B, Ghebremichael M, Hartman KL, et al. High-functional-avidity cytotoxic T lymphocyte responses to HLA-B-restricted Gag-derived epitopes associated with relative HIV control. J Virol. 2011;85(18):9334–45.
20. Ferrando-Martinez S, Casazza JP, Leal M, Machmach K, Munoz-Fernandez MA, Viciana P, et al. Differential Gag-specific polyfunctional T cell matura-tion patterns in HIV-1 elite controllers. J Virol. 2012;86(7):3667–74. 21. Blankson JN, Siliciano RF. Elite suppression of HIV-1 replication. Immunity.
2008;29(6):845–7.
22. Betts MR, Nason MC, West SM, De Rosa SC, Migueles SA, Abraham J, et al. HIV nonprogressors preferentially maintain highly functional HIV-specific
CD8+ T cells. Blood. 2006;107(12):4781–9.
23. Ferre AL, Hunt PW, Critchfield JW, Young DH, Morris MM, Garcia JC, et al. Mucosal immune responses to HIV-1 in elite controllers: a potential cor-relate of immune control. Blood. 2009;113(17):3978–89.
24. Almeida JR, Price DA, Papagno L, Arkoub ZA, Sauce D, Bornstein E, et al. Superior control of HIV-1 replication by CD8+ T cells is reflected by their avidity, polyfunctionality, and clonal turnover. J Exp Med. 2007;204(10):2473–85.
25. Walker BD, Yu XG. Unravelling the mechanisms of durable control of HIV-1. Nat Rev Immunol. 2013;13(7):487–98.
•fast, convenient online submission •
thorough peer review by experienced researchers in your field • rapid publication on acceptance
• support for research data, including large and complex data types •
gold Open Access which fosters wider collaboration and increased citations maximum visibility for your research: over 100M website views per year •
At BMC, research is always in progress.
Learn more biomedcentral.com/submissions
Ready to submit your research? Choose BMC and benefit from:
27. Salgado M, Rallon NI, Rodes B, Lopez M, Soriano V, Benito JM. Long-term non-progressors display a greater number of Th17 cells than HIV-infected typical progressors. Clinical immunology. 2011;139(2):110–4.
28. Rouers A, Klingler J, Su B, Samri A, Laumond G, Even S, et al. HIV-specific B cell frequency correlates with neutralization breadth in patients naturally controlling HIV-infection. EBioMedicine. 2017;21:158–69.
29. Wu JQ, Sasse TR, Wolkenstein G, Conceicao V, Saksena MM, Soedjono M, et al. Transcriptome analysis of primary monocytes shows global down-regulation of genetic networks in HIV viremic patients versus long-term non-progressors. Virology. 2013;435(2):308–19.
30. O’Connor GM, Holmes A, Mulcahy F, Gardiner CM. Natural Killer cells from long-term non-progressor HIV patients are characterized by altered phenotype and function. Clin Immunol. 2007;124(3):277–83.
31. Leng J, Ho HP, Buzon MJ, Pereyra F, Walker BD, Yu XG, et al. A cell-intrinsic inhibitor of HIV-1 reverse transcription in CD4(+) T cells from elite con-trollers. Cell Host Microbe. 2014;15(6):717–28.
32. Leitman EM, Willberg CB, De Burgh-Thomas A, Streeck H, Goulder PJ, Mat-thews PC. Subdominant Gag-specific anti-HIV efficacy in an HLA-B*57-positive elite controller. Aids. 2016;30(6):972–4.
33. Moosa Y, Tanko RF, Ramsuran V, Singh R, Madzivhandila M, Yende-Zuma N, et al. Case report: mechanisms of HIV elite control in two African women. BMC Infect Dis. 2018;18(1):54.
34. Magierowska M, Theodorou I, Debre P, Sanson F, Autran B, Riviere Y, et al. Combined genotypes of CCR5, CCR2, SDF1, and HLA genes can predict the long-term nonprogressor status in human immunodeficiency virus-1-infected individuals. Blood. 1999;93(3):936–41.
35. Horton H, Frank I, Baydo R, Jalbert E, Penn J, Wilson S, et al. Preservation of T cell proliferation restricted by protective HLA alleles is critical for immune control of HIV-1 infection. J Immunol. 2006;177(10):7406–15. 36. Martin MP, Gao X, Lee JH, Nelson GW, Detels R, Goedert JJ, et al. Epistatic
interaction between KIR3DS1 and HLA-B delays the progression to AIDS. Nat Genet. 2002;31(4):429–34.
37. Martin MP, Qi Y, Gao X, Yamada E, Martin JN, Pereyra F, et al. Innate partnership of HLA-B and KIR3DL1 subtypes against HIV-1. Nat Genet. 2007;39(6):733–40.
38. Guergnon J, Dalmasso C, Broet P, Meyer L, Westrop SJ, Imami N, et al. Single-nucleotide polymorphism-defined class I and class III major his-tocompatibility complex genetic subregions contribute to natural long-term nonprogression in HIV infection. J Infect Dis. 2012;205(5):718–24. 39. International HIVCS, Pereyra F, Jia X, McLaren PJ, Telenti A, de Bakker PI,
et al. The major genetic determinants of HIV-1 control affect HLA class I peptide presentation. Science. 2010;330(6010):1551–7.
40. Ramasamy A, Mondry A, Holmes CC, Altman DG. Key issues in conduct-ing a meta-analysis of gene expression microarray datasets. PLoS Med. 2008;5(9):e184.
41. Wang X, Kang DD, Shen K, Song C, Lu S, Chang LC, et al. An R pack-age suite for microarray meta-analysis in quality control, differentially
expressed gene analysis and pathway enrichment detection. Bioinfor-matics. 2012;28(19):2534–6.
42. Subramanian A, Tamayo P, Mootha VK, Mukherjee S, Ebert BL, Gillette MA, et al. Gene set enrichment analysis: a knowledge-based approach for interpreting genome-wide expression profiles. Proc Natl Acad Sci USA. 2005;102(43):15545–50.
43. Zhang B, Horvath S. A general framework for weighted gene co-expres-sion network analysis. Stati Appl Genet Mol Biol. 2005;4:17.
44. Langfelder P, Horvath S. WGCNA: an R package for weighted correlation network analysis. BMC Bioinform. 2008;9:559.
45. Ma L, Zhang Z, Liu Z, Pan Q, Wang J, Li X, et al. Identification of small molecule compounds targeting the interaction of HIV-1 Vif and human APOBEC3G by virtual screening and biological evaluation. Sci Rep. 2018;8(1):8067.
46. Ding J, Zhao J, Yang Z, Ma L, Mi Z, Wu Y, et al. Microbial natural product
alternariol 5-O-methyl ether inhibits HIV-1 integration by blocking
nuclear import of the pre-integration complex. Viruses. 2017;9:5. 47. Li M, Kao E, Gao X, Sandig H, Limmer K, Pavon-Eternod M, et al.
Codon-usage-based inhibition of HIV protein synthesis by human schlafen 11. Nature. 2012;491(7422):125–8.
48. Brombin C, Diomede L, Tudor D, Drillet AS, Pastori C, Poli E, et al. A non-parametric procedure for defining a new humoral immunologic profile in a pilot study on HIV infected patients. PLoS ONE. 2013;8(3):e58768. 49. Liang Z, Liu R, Zhang H, Zhang S, Hu X, Tan J, et al. GADD45 proteins
inhibit HIV-1 replication through specific suppression of HIV-1 transcrip-tion. Virology. 2016;493:1–11.
50. Rotger M, Dalmau J, Rauch A, McLaren P, Bosinger SE, Martinez R, et al. Comparative transcriptomics of extreme phenotypes of human HIV-1 infection and SIV infection in sooty mangabey and rhesus macaque. J Clin Investig. 2011;121(6):2391–400.
51. Sankaran S, Guadalupe M, Reay E, George MD, Flamm J, Prindiville T, et al. Gut mucosal T cell responses and gene expression correlate with protec-tion against disease in long-term HIV-1-infected nonprogressors. Proc Natl Acad Sci USA. 2005;102(28):9860–5.
52. Rotger M, Dang KK, Fellay J, Heinzen EL, Feng S, Descombes P, et al.
Genome-wide mRNA expression correlates of viral control in CD4+ T-cells
from HIV-1-infected individuals. PLoS Pathog. 2010;6(2):e1000781. 53. Doyle T, Goujon C, Malim MH. HIV-1 and interferons: who’s interfering
with whom? Nat Rev Microbiol. 2015;13(7):403–13.
54. Bosinger SE, Utay NS. Type I interferon: understanding its role in HIV pathogenesis and therapy. Current HIV/AIDS reports. 2015;12(1):41–53. 55. Cheng L, Yu H, Li G, Li F, Ma J, Li J, et al. Type I interferons suppress viral replication but contribute to T cell depletion and dysfunction during chronic HIV-1 infection. JCI Insight. 2017;2:12.