RESEARCH
Neuroregenerative potential
of intravenous G-CSF and autologous peripheral
blood stem cells in children with cerebral palsy:
a randomized, double-blind, cross-over study
Wee‑Jin Rah
1, Young‑Ho Lee
1,2,3*, Jin‑Hwa Moon
1, Hyun‑Ju Jun
1, Hye‑Ryeong Kang
1, Hani Koh
1,2,
Hye Jung Eom
2, Ji Young Lee
4, Young Jun Lee
4, Ji Young Kim
5, Yun‑Young Choi
5, Kyeongil Park
6, Mi Jung Kim
6and Seung‑Hyun Kim
3Abstract
Objective: We performed a randomized, double‑blind, cross‑over study to assess the neuroregenerative potential of intravenous granulocyte colony‑stimulating factor (G‑CSF) followed by infusion of mobilized peripheral blood mono‑ nuclear cells (mPBMCs) in children with cerebral palsy (CP).
Methods: Children with non‑severe CP were enrolled in this study. G‑CSF was administered for 5 days, then mPB‑ MCs were collected by apheresis and cryopreserved. One month later (M1), recipients were randomized to receive either mPBMCs or a placebo infusion, and these treatment groups were switched at 7 months (M7) and observed for another 6 months (M13). We assessed the efficacy of treatment by evaluating neurodevelopmental tests, as well as by brain magnetic resonance imaging‑diffusion tensor imaging (MRI‑DTI) and 18F‑fluorodeoxyglucose (FDG) brain positron emission tomography‑computed tomography (PET‑CT) scanning to evaluate the anatomical and functional changes in the brain.
Results: Fifty‑seven patients aged 4.3 ± 1.9 (range 2–10) years and weighing 16.6 ± 4.9 (range 11.6–56.0) kg were enrolled in this study. The administration of G‑CSF as well as the collection and reinfusion of mPBMCs were safe and tolerable. The yield of mPBMCs was comparable to that reported in studies of pediatric donors without CP and patients with nonhematologic diseases. 42.6% of the patients responded to the treatment with higher neurodevelop‑ mental scores than would normally be expected. In addition, larger changes in neurodevelopment test scores were observed in the 1 month after G‑CSF administration (M0–M1) than during the 6 months after reinfusion with mPBMCs or placebo (M1–M7 or M7–M13). Patients who received G‑CSF followed by mPBMC infusion at 7 months (T7 group) demonstrated significantly more neurodevelopmental improvement than patients who received G‑CSF followed by mPBMC infusion at 1 month (T1 group). In contrast to the results of neurodevelopment tests, the results of MRI‑DTI at the end of this study showed greater improvement in the T1 group. Although we observed metabolic changes to the cerebellum, thalamus and cerebral cortex in the 18F‑FDG brain PET‑CT scans, there were no significant differences in such changes between the mPBMC and placebo group or between the T1 and T7 group.
Conclusions: Neurodevelopmental improvement was seen in response to intravenous G‑CSF followed by mPBMC reinfusion, particularly to the G‑CSF alone even without mPBMC reinfusion. Further studies using a larger number of mPBMCs for the infusion which could be collected by repeated cycles of apheresis or using repeated cycles of
© The Author(s) 2017. This article is distributed under the terms of the Creative Commons Attribution 4.0 International License (http://creativecommons.org/licenses/by/4.0/), which permits unrestricted use, distribution, and reproduction in any medium, provided you give appropriate credit to the original author(s) and the source, provide a link to the Creative Commons license, and indicate if changes were made. The Creative Commons Public Domain Dedication waiver (http://creativecommons.org/ publicdomain/zero/1.0/) applies to the data made available in this article, unless otherwise stated.
Open Access
*Correspondence: cord@hanyang.ac.kr
1 Department of Pediatrics, Hanyang University Medical Center, 222‑1,
Background
Children with cerebral palsy (CP) have disabilities both from motor impairment and from related disorders in other functions, including sensation, cognition, commu-nication, vision, and behavior. Although various strate-gies have been used to improve neurologic impairment in patients with CP, most strategies used to date are com-plementary therapies, and there is currently no medical treatment that can repair the damaged nervous tissues [1]. Recent studies revealed that persistent neuroinflam-mation and associated apoptosis in brains affected by CP could be therapeutic targets [2]. Apoptosis is an attrac-tive target because anti-apoptotic agents could be used to reverse apoptosis during a therapeutic time window after hypoxia-induced injury [3]. Other potential therapeutic targets include hematopoietic growth factors, such as erythropoietin (EPO) and granulocyte colony-stimulat-ing factor (G-CSF), which influence the proliferation of neural stem and progenitor cells. EPO and G-CSF have specific receptors in the brain and both factors are pro-duced in the brain [4, 5]. Therefore, EPO and G-CSF have been investigated for their ability to stop neurodegenera-tive conditions [6, 7].
Recently, cell therapy has emerged as a potential treat-ment for patients with CP. Bone marrow (BM)- or cord blood (CB)-derived mesenchymal stem cells (MSCs) have generally been used for cell therapy. In addition, intrave-nous CB mononuclear cells (CB MNCs) or intrathecal BM MNCs have been also assessed for safety and efficacy in children with CP [8–12]. Studies show that in children with CP recovery from neurologic impairment is prom-ising, but not complete, following stem cell therapy with CB MNCs. However, there are limitations to the use of CB MNCs and BM MNCs for repeated therapy, as there is only one opportunity to collect CB MNCs, and the procedure for extracting BM MNCs is very invasive in children with CP.
We hypothesized that mobilized peripheral blood mononuclear cells (mPBMCs) would be a better source of cell therapy for children with CP, if these cells had a similar neuroregenerative potential to BM/CB MNCs. Multipotent precursor cells exist in peripheral blood, and a fraction of elutriated blood cells from normal individu-als contains MNCs that have the potential to be MSCs [13]. There are several advantages to using mPBMCs for cell therapy in children with CP: the G-CSF that is used
to mobilize peripheral blood mononuclear cells (PBMCs) has neuroregenerative potential; the collection and frac-tionation of stem cells can be repeated; and, the therapy is suitable for most children with CP. So far, there have been no clinical trials of cell therapy with autologous mPBMCs for children with CP. The current study describes a ran-domized, double-blind, cross-over study of intravenous G-CSF followed by infusion with autologous mPBMCs in children with CP to determine the safety and feasibil-ity of the procedure, as well as the potential efficacy for improving neurological impairment.
Methods Study design
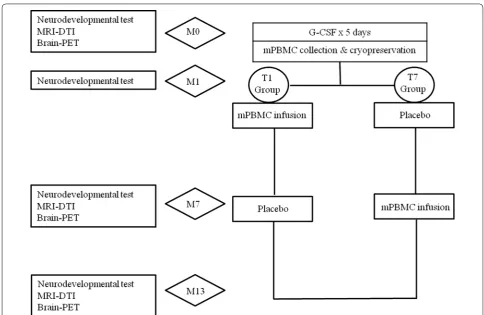
Patients were included in the study if they were between 2 and 10 years of age and had a non-severe type of CP After baseline studies at enrollment (M0), intravenous G-CSF of 10 μg/kg was administered for 5 days. On the fifth day mPBMCs were collected with a single-day course of apheresis and then cryopreserved (Fig. 1). The detailed apheresis procedure is described in our previ-ous study [14]. One month after cryopreservation of the mPBMCs (M1), patients were randomized to receive either mPBMCs or placebo. Six months after randomi-zation (M7), cross-over infusion of mPBMCs or pla-cebo was performed and the patients were observed for another 6 months. During the study, comprehensive physiotherapy and occupational therapy for individual patients were not modified. We assessed the neurode-velopmental status of patients at M0, M1, M7, and M13 after enrollment using various evaluation tools for neu-rodevelopmental tests. Brain magnetic resonance imag-ing-diffusion tensor image (MRI-DTI) and brain positron emission tomography-computed tomography (PET-CT) were used to evaluate the anatomical and functional changes in the brain at enrollment (M0), M7, and M13. This study was approved by the Institutional Review Board of Hanyang University Hospital (201103002).
Evaluation of neurodevelopment
We assessed the parents’ feeling for the changes of motor or cognitive functions during study periods of their chil-dren, which even could not provide the clear and objec-tive information on the neurodevelopmental evaluation. Comprehensive neurodevelopmental examinations were performed using the Denver development screening test G‑CSF alone, are needed to clarify the effect of mPBMC reinfusion or G‑CSF alone (Trial registration: ClinicalTrials.gov, NCT02983708. Registered 5 December, 2016, retrospectively registered).
II (DDST-II) to assess gross developmental screening, the pediatric evaluation of disability inventory (PEDI) to assess detailed developmental, the gross motor func-tion classificafunc-tion system (GMFCS) to assess gross motor function staging, the gross motor function measure-88 (GMFM) to assess detailed motor function, the manual ability classification system (MACS) to assess fine motor staging, and the quality of upper extremity skill test (QUEST) to assess fine motor function. The results for each examination tool were evaluated by well-trained physical and occupational therapists, and therapeutic responses were comprehensively assessed by rehabilita-tion specialists.
Neuroimaging studies Brain MRI
All patients underwent MRI examination using a 3.0T system (Achieva, Philips, Best, Netherlands). Conven-tional images including axial T1-weighted, T2-weighted, and fluid-attenuated inversion recovery (FLAIR) were obtained for the anatomical evaluation. DTI data were obtained for the functional evaluation using a single shot
echo planar sequence with the following parameters; 15 diffusion gradient directions, maximum b value = 800 s/ mm2, TR/TE = 9000/55 ms, slice thickness = 2 mm. The
DTI datasets were transferred to a workstation for pro-cessing. Fractional anisotropy (FA) and apparent diffu-sion coefficient (ADC) values for 18 regions of interest (ROIs) were obtained from the DTI data. All ROIs were set and analyzed by a pediatric neurologist.
Brain PET‑CT scanning
Brain PET images were acquired using a dedicated PET-CT system (Biograph 6, Siemens Medical System, Knox-ville, TN) at M0, M7, and M13 to monitor metabolic improvements of the brain. The patients fasted at least 6 h prior to PET-CT scanning. After intravenous injection of
18F-FDG (3.7 MBq/kg, 33–207 MBq), patients waited for
60 min in a dark room with a dim light before imaging, while 18F-FDG was distributed in brain. PET scans were
obtained for 10 min, and images were reconstructed with a 168 × 168 matrix (pixel size = 1.95 × 1.95 mm with a slice thickness of 3.0 mm), and the ordered subset expec-tation maximum iterative reconstruction algorithm, Fig. 1 Design of the clinical study. MRI-DTI magnetic resonance imaging‑diffusion tensor imaging; PET positron emission tomography; G-CSF
[image:3.595.55.540.85.400.2]an 5 mm Gaussian filter, and a 30 cm field of view. Two board-certified nuclear medicine physicians reviewed all three set of individual subject by visual assessment in consensus to check for the differences between the mPBMC group and placebo group, as well as T1 group and T7 group.
Data analyses
We analyzed the following: safety and yield of G-CSF-mobilized PBMC collection; outcomes at M13; the booster effect of mPBMC infusion (by comparing the mPBMC group and the placebo group); and, outcomes according to mPBMC infusion time (T1 group: mPBMC infusion at 1 month after G-CSF infusion; T7 group: mPBMC infusion at 7 months after G-CSF infusion). The statistical software SAS for Windows (version 9.4, Cary, NC, USA) was used for data analysis. Logistic regres-sion was used to analyze parental assessments, and the Mann–Whitney U test was used to analyze the neurode-velopment tests. The Wilcoxon rank sum test was used to analyze data from the brain MRI-DTI and PET-CT scans. P values ≤0.05 were considered to be statistically significant.
Results
Demographic data
Fifty-seven patients were enrolled in the current study and their mean age and body weight were 4.3 ± 1.9 years (range 2–10 years) and 16.6 ± 4.9 kg (range 11.6– 56.0 kg), respectively. Types of CP were as follows: 31 diplegia, 15 hemiplegia, 11 others (triplegia, ataxic, athet-oid). Possible causes of CP were periventricular leukoma-lacia (n = 37), hypoxic ischemic encephalopathy (n = 2), intracranial hemorrhage (n = 2), and unknown (n = 16). Forty-seven patients for whom complete study data were available were included in this analysis.
Safety of G‑CSF administration and yield of PBMCs
G-CSF-mobilized PBMC collection was safe in children with CP. We observed only two cases of fever and one epi-sode of irritability during the G-CSF infusion. Transient hemoglobinuria (n = 3) and abdominal pain (n = 1) were reported during the mPBMC infusion, and these were resolved with supportive treatments. The total nucleated cell (TNC) count of mPBMCs was 5.97 ± 1.99 × 10⁸/kg,
and the TNC count of CD34+ cells was 3.07 ± 2.1 × 10⁶/
kg. Pre-freezing and post-thawing cell data were not sig-nificantly different between the two groups (T1 and T7), except for the post-thawing TNC counts, where the TNC count was significantly higher in the T7 group (Table 1).
Parental assessments
Even before randomization for mPBMC infusion at M1 (i.e. during the one month after G-CSF administration), functional changes were noted by parents of 27 patients from the total group of 47 patients. After randomiza-tion, at M13, functional changes were noted by parents of 41 patients in the mPBMC group and by parents of 45 patients in the placebo group, although this difference was not statistically significant. There were also no sig-nificant differences in the functional changes recorded by parents at M13 between the T1 and T7 groups (Table 2).
Neurodevelopmental tests
Although we observed no significant changes in the GMFCS and MACS domains, 20 of 47 patients (42.6%) showed overall improvement at M13 in the domains of GMFM, PEDI and QUEST. We defined overall improve-ment as a score change in GMFM >4 points and/or score changes in PEDI >7 points in at least three items. The clinical characteristics of patients according to their over-all therapeutic response are shown in Table 3. There were no risk factors associated with therapeutic responses; however, the number of responders was significantly higher in the T7 group than in the T1 group (p = 0.028). When comparing T1 and T7 groups (Table 4), the only significant score improvements were in the over-all GMFM and GMFM-crawling domains, and these improvements were observed between enrollment and completion of study (M0–M13). Furthermore, when we compared the change in score after randomization (M1– M13), the GMFM, GMFM-crawling and GMFM-sitting domains showed significant improvement in the T7 group compared to the T1 group. Although there were no significant differences in neurodevelopment score improvement between mPBMC and placebo groups after randomization, more significant score changes in the GMFM, PEDI, and QUEST domains were observed before randomization (Table 5).
Table 1 Cell counts of cryopreserved and infused mPBMCs
mPBMC mobilized peripheral blood mononuclear cell; TNC total nucleated cell; T1 and T7 refer to a group who received mPBMC at 1 and 7 months of study, respectively
T1 (N = 28) T7 (N = 29) p
Pre‑freezing TNC (×108/kg) 5.84 ± 2.18 6.09 ± 1.89 0.574
CD34 (×106/kg) 3.16 ± 2.72 2.99 ± 1.40 0.678
Post‑thawing TNC (×108/kg) 4.63 ± 2.88 6.20 ± 1.94 0.018
[image:4.595.307.540.103.171.2]Brain MRI‑DTI scanning
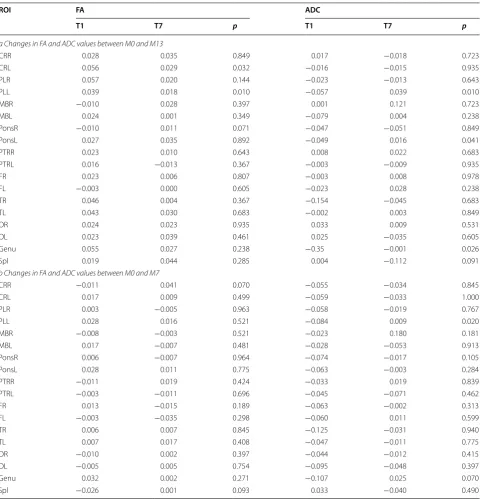
In the MRI-DTI scans, there was a trend of increasing FA values and decreasing ADC values over time (M0–M13). However, these trends were not statistically significant, and there were also no significant differences between mPBMC and placebo groups (M1–M7 and M7–M13) in FA or ADC values in any ROIs. To evaluate the effect of mPBMC infusion on the changes in MRI-DTI scans, we analyzed the data according to the time of mPBMC infu-sion. The FA and ADC values were significantly greater in the T1 group than in the T7 group for the left corona radiata (CRL), left posterior limb of internal capsule (PLL), and the ADC values were significantly decreased in genu ROIs between M0 and M13 (Table 6), and in PLL ROI between M0 and M7 (Table 6). However, there were no significant differences in any ROI between M7 and M13.
Brain PET‑CT scanning
Although we observed metabolic changes to the cerebel-lum, thalamus and cerebral cortex in the brain PET-CT,
there were no significant differences in the incidence of metabolic changes between the mPBMC and placebo groups, or between the T1 and T7 groups.
Discussion
We have performed a clinical trial using G-CSF and mobilized PBMCs in patients with CP, based upon the following backgrounds. The use of G-CSF in children with CP is ethical and beneficial because it is already proven to be safe in normal volunteer donors [15, 16], and G-CSF has the potential to induce neuroregenera-tion in patients with neurodegenerative diseases [5, 7]. Also, the mobilization and apheresis of mPBMCs in chil-dren are safe and effective [15], and mPBMCs contain MSCs which can be isolated and then secrete various cytokines potentially able to repair the damaged tis-sues [13, 17]. Additionally, we have previously reported upon the safety of administering G-CSF and collect-ing mPBMCs in children with CP [14], and we have also reported on the intracellular expression of neurotrophic factors and inflammatory cytokines, which could exert a Table 2 Number of patients for functional improvement by parental assessment according to randomization (before vs after) and time of mPBMC infusion (T1 vs T7)
mPBMC mobilized peripheral blood mononuclear cell; T1 and T7 refer to a group who received mPBMC at 1 and 7 months of study, respectively
+p indicates statistical significances of items between placebo and mPBMC groups *p indicates statistical significances of items between before T1 and T7 groups
Before randomization After randomization T1 T7 p*
Placebo mPBMC p+
Cognitive function 19 31 23 0.09 8 11 0.59
Motor function 3 0 2 0.15 0 0 –
Cognitive + motor function 5 14 16 0.65 13 14 0.83
No interval change 20 2 6 0.13 1 0 0.28
Table 3 Clinical characteristics according to overall therapeutic response, as measured by neurodevelopment tests
CP cerebral palsy; T1 and T7 refer to a group who received mobilized peripheral blood mononuclear cell at 1 and 7 months of study, respectively
a Responder refers to a patient showing overall improvement at M13 as measured by neurodevelopment tests
Total (number or mean ± SD) Responder (N = 20)a Non‑responder (N
= 27) p
Sex 0.915
Male 25 11 14
Female 22 9 13
Age (years) 4.1 ± 1.9 3.2 ± 1.5 4.7 ± 1.9 0.968
Body weight (kg) 16.6 ± 7.70 13. 8 ± 2.57 18.5 ± 9.35 0.142 Infused TNC (×108/kg) 5.2 ± 2.54 5.7 ± 1.52 4.8 ± 3.04 0.847
CP type 0.215
Diplegia 25 10 15
Non‑diplegia 22 10 12
Infusion time 0.028
T1 22 5 17
[image:5.595.56.539.112.200.2] [image:5.595.60.540.264.430.2]neuroregenerative effect, in mPBMCs from children with CP [17].
In the current study, we demonstrated that G-CSF administration and collection/reinfusion of mPBMCs were safe and tolerable in children with CP. A single-day apheresis in children with CP yielded TNC counts
of 5.97 ± 1.99 × 10⁸/kg, and CD34+ cell counts of
3.07 ± 2.1 × 10⁶/kg. These numbers are sufficient for
hematopoietic reconstitution, although the target dose of MNCs or MSCs for cell therapy is yet to be determined. The yield of mPBMCs from children with CP was com-parable to the yield from normal pediatric donors and patients with nonhematologic disease, reported in other studies [18, 19]. We cryopreserved all collected mPBMCs for at least 1 month and then reinfused them (after rand-omization) at 1 month or 7 months. With this protocol, we tried to reveal the neuroregenerative effect of G-CSF alone, without circulating mPBMCs, as well as any possi-ble augmented effect following reinfusion with mPBMCs.
We observed that 42.6% of patients showed overall responses in the neurodevelopment tests than would nor-mally be expected. In addition, the largest neurodevelop-ment score improveneurodevelop-ments were obtained during 1 month after G-CSF administration followed by mPBMC collec-tion (M0–M1), suggesting that G-CSF alone, irrespec-tive of circulating mPBMCs, can counter neurological impairment in children with CP. We also tried to assess the booster effects of mPBMCs on neurodevelopmental functions. Compared to the placebo group, the group that had a mPBMC infusion at 7 months experienced a greater improvement in neurodevelopmental functions than the group receiving a mPBMC infusion at 1 month. However, it should be pointed out that the higher infused cell doses in the T7 group were associated with neurodevelopmen-tal improvement, because there is, as yet, no evidence that cell dose has an effect on neurologic improvements. In addition, Hara [20] and Hayashiji [21] reported that G-CSF positively affects the recovery of muscle mass, Table 4 Change in neurodevelopment test score according to time of mPBMC infusion
mPBMC mobilized peripheral blood mononuclear cell; GMFM gross motor function measure; PEDI pediatric evaluation of disability inventory; QUEST quality of upper extremity skills test. M0, M1, and M13 refer to months after enrollment. T1 and T7 refer to a group who received mPBMC at 1 and 7 months of study, respectively
M0–M13 M1–M13
T1 T7 p T1 T7 p
GMFM 4.28 8.30 0.002 2.90 6.37 0.001
Lying 1.34 1.33 0.398 0.89 0.71 0.780
Sitting 2.65 9.08 0.103 1.74 7.35 0.044
Crawling 5.19 12.86 0.010 2.92 10.41 0.002
Standing 4.78 7.18 0.093 3.50 5.13 0.079
Walking 7.45 10.02 0.391 5.43 8.45 0.198
PEDI_selfcare 8.64 8.13 0.370 5.58 6.54 0.204
Mobility 8.86 10.00 0.856 6.35 6.53 0.621
Social function 13.78 9.33 0.327 9.54 6.28 0.296
Selfcare (caregiver) 7.88 10.92 0.228 5.54 8.44 0.455
Mobility (caregiver) 4.90 7.28 0.221 3.29 6.22 0.052
Social function (caregiver) 11.45 14.65 0.236 8.87 12.13 0.208
QUEST 21.28 25.66 0.394 13.79 18.44 0.183
Table 5 Changes in neurodevelopment test scores accord-ing to randomization
mPBMC mobilized peripheral blood marrow cell; GMFM gross motor function measure; PEDI_C pediatric evaluation of disability inventory self-care; PEDI_M
pediatric evaluation of disability inventory mobility; PEDI_F pediatric evaluation of disability inventory social function; PEDI_CC pediatric evaluation of disability inventory mobility self-care with caregiver assistance; PEDI_MC pediatric evaluation of disability inventory mobility with caregiver assistance; PEDI_FC
pediatric evaluation of disability inventory mobility social function with caregiver assistance; QUEST quality of upper extremity skills test M0, M1, M7 and M13 refer to months after enrollment
+p indicates statistical significances of items between placebo and mPBMC
groups
* p indicates statistical significances of items between before randomization and after randomization
Before randomization
(M0–M1) After randomization (M1–M7 or M7–M13) p*
Placebo mPBMC p+
[image:6.595.57.542.101.296.2] [image:6.595.57.291.363.506.2]therefore delayed effect of G-CSF on muscle regeneration may be contributed to synergistic improvement of neu-rodevelopmental functions in T7 group. Contrary to the results from neurodevelopment tests, MRI-DTI showed
greater increase of FA values in the CRL, PLL, and Genu ROIs in the T1 group than in the T7 group, indicating that the neuroregenerative effect of G-CSF coupled with mPBMC infusion is higher at 1 month than at 7 months. Table 6 Changes in FA and ADC values
M0, M7, and M13 refer to months after enrollment
FA fractional anisotropy; ADC apparent diffusion coefficient; ROI region of interest; CRR corona radiata, right; CRL corona radiata, left; PLR internal capsule, posterior limb, right; PLL internal capsule, posterior limb, left; MBR midbrain, right; MBL midbrain, left; PonsR pons, right; PonsL pons, left; PTRR posterior thalamic radiation, right;
PTRL posterior thalamic radiation, left; FR frontal, right; FL frontal, left; TR temporal right; TL temporal left; OR occipital right; OL occipital left; Spl splenium
ROI FA ADC
T1 T7 p T1 T7 p
a Changes in FA and ADC values between M0 and M13
CRR 0.028 0.035 0.849 0.017 −0.018 0.723
CRL 0.056 0.029 0.032 −0.016 −0.015 0.935
PLR 0.057 0.020 0.144 −0.023 −0.013 0.643
PLL 0.039 0.018 0.010 −0.057 0.039 0.010
MBR −0.010 0.028 0.397 0.001 0.121 0.723
MBL 0.024 0.001 0.349 −0.079 0.004 0.238
PonsR −0.010 0.011 0.071 −0.047 −0.051 0.849
PonsL 0.027 0.035 0.892 −0.049 0.016 0.041
PTRR 0.023 0.010 0.643 0.008 0.022 0.683
PTRL 0.016 −0.013 0.367 −0.003 −0.009 0.935
FR 0.023 0.006 0.807 −0.003 0.008 0.978
FL −0.003 0.000 0.605 −0.023 0.028 0.238
TR 0.046 0.004 0.367 −0.154 −0.045 0.683
TL 0.043 0.030 0.683 −0.002 0.003 0.849
OR 0.024 0.023 0.935 0.033 0.009 0.531
OL 0.023 0.039 0.461 0.025 −0.035 0.605
Genu 0.055 0.027 0.238 −0.35 −0.001 0.026
Spl 0.019 0.044 0.285 0.004 −0.112 0.091
b Changes in FA and ADC values between M0 and M7
CRR −0.011 0.041 0.070 −0.055 −0.034 0.845
CRL 0.017 0.009 0.499 −0.059 −0.033 1.000
PLR 0.003 −0.005 0.963 −0.058 −0.019 0.767
PLL 0.028 0.016 0.521 −0.084 0.009 0.020
MBR −0.008 −0.003 0.521 −0.023 0.180 0.181
MBL 0.017 −0.007 0.481 −0.028 −0.053 0.913
PonsR 0.006 −0.007 0.964 −0.074 −0.017 0.105
PonsL 0.028 0.011 0.775 −0.063 −0.003 0.284
PTRR −0.011 0.019 0.424 −0.033 0.019 0.839
PTRL −0.003 −0.011 0.696 −0.045 −0.071 0.462
FR 0.013 −0.015 0.189 −0.063 −0.002 0.313
FL −0.003 −0.035 0.298 −0.060 0.011 0.599
TR 0.006 0.007 0.845 −0.125 −0.031 0.940
TL 0.007 0.017 0.408 −0.047 −0.011 0.775
OR −0.010 0.002 0.397 −0.044 −0.012 0.415
OL −0.005 0.005 0.754 −0.095 −0.048 0.397
Genu 0.032 0.002 0.271 −0.107 0.025 0.070
[image:7.595.58.541.99.599.2]Given these differences between the results of neurode-velopment tests and the changes observed in MRI-DTI scans, the neuroregenerative effect of mPBMC reinfusion may be minimal and/or the additive effect of G-CSF on the central nervous system as well as muscles could be considered. Furthermore, the collection and reinfusion of mPBMCs after G-CSF administration may not be essen-tial because G-CSF could synergize with endogenous cir-culating mPBMCs. Although we could not demonstrate the effect of G-CSF on muscle and an additional effect of mPBMCs on the changes of FA/ADC values in the MRI-DTI scans, several investigators have found a correlation between ROI-based FA and clinical motor outcome in children with CP [22–24]. Therefore, future studies using MRI-DTI would be needed to reveal the association of infusion timing or cell doses of mPBMCs and clinical outcomes in children with CP.
Conclusion
We observed a neuroregenerative potential of intrave-nous G-CSF followed by mPBMC reinfusion. The neu-rodevelopmental improvement observed may have been caused by G-CSF alone without a contribution from the reinfused mPBMCs. Further studies using higher con-centrations of mPBMCs which could be collected by repeated cycles of apheresis or using repeated cycles of G-CSF alone are needed to clarify any benefit of mPBMC reinfusion or G-CSF alone.
Abbreviations
G‑CSF: granulocyte colony‑stimulating factor; mPBMC: mobilized peripheral blood mononuclear cells; CP: cerebral palsy; M0: month at enrollment; M1: 1 month after enrollment; M7: 7 months after enrollment; M13: 13 months after enrollment; MRI‑DTI: magnetic resonance imaging‑diffusion tensor imag‑ ing; FDG: 18F‑fluorodeoxyglucose; PET‑CT: positron emission tomography‑
computed tomography; T1: group for mPBMC infusion at 1 month; T7: group for mPBMC infusion at 7 months; EPO: erythropoietin; BM: bone marrow; CB: cord blood; MSCs: mesenchymal stem cells; MNCs: mononuclear cells; DDST II: Denver development screening test II; PEDI: pediatric evaluation of disability inventory; GMFCS: gross motor function classification system; MACS: manual ability classification system; QUEST: quality of upper extremity skill test; FLAIR: fluid‑attenuated inversion recovery; FA: fractional anisotropy; ADC: apparent diffusion coefficient; ROIs: regions of interest; TNC: total nucleated cell; CRL: left corona radiata; PLL: left posterior limb of internal capsule.
Authors’ contributions
WJR analyzed the clinical data and wrote the manuscript. YHL designed the study and reviewed the manuscript. HK, JHM, HJJ, HRK, HJE, JYL, YJL, KP, MJK and SHK performed clinical studies and analyzed their clinical data. All authors read and approved the final manuscript.
Author details
1 Department of Pediatrics, Hanyang University Medical Center, 222‑1,
Wangsimni‑ro, Seongdong‑gu, Seoul 04763, South Korea. 2 Blood and Mar‑
row Transplantation Center, Hanyang University Medical Center, Seoul, South Korea. 3 Cell Therapy Center, Hanyang University Medical Center, Seoul, South
Korea. 4 Department of Radiology, Hanyang University Medical Center, Seoul,
South Korea. 5 Department of Nuclear Medicine, Hanyang University Medical
Center, Seoul, South Korea. 6 Department of Rehabilitation Medicine, Hanyang
University Medical Center, Seoul, South Korea.
Acknowledgements
This study was supported by grants from the Korea Healthcare Technology R&D Project of the Ministry for Health & Welfare Affairs of the Republic of Korea (A101712).
Competing interests
The authors declare that they have no competing interests.
Availability of data and materials
Please contact author for data requests.
Ethics approval and consent to participate
This study was approved by the Institutional Review Board of Hanyang Univer‑ sity Hospital (201103002).
Received: 5 December 2016 Accepted: 6 January 2017
References
1. Patel DR, Greydanus DE, Calles JL Jr, Pratt HD. Developmental disabilities across the lifespan. Dis Mon. 2010;56:304–97.
2. Dammann O. Persistent neuro‑inflammation in cerebral palsy: a thera‑ peutic window of opportunity? Acta Paediatr. 2007;96:6–7.
3. Goni‑de‑Cerio F, Alvarez A, Caballero A, Mielgo VE, Alvarez FJ, Rey‑ Santano MC, et al. Early cell death in the brain of fetal preterm lambs after hypoxic‑ischemic injury. Brain Res. 2007;1151:161–71.
4. Brines M, Cerami A. Emerging biological roles for erythropoietin in the nervous system. Nat Rev Neurosci. 2005;6:484–94.
5. Schneider A, Kuhn HG, Schäbitz WR. A role for G‑CSF (granulocyte‑ colony stimulating factor) in the central nervous system. Cell Cycle. 2005;4:1753–7.
6. Wang H, Zhang L, Jin Y. A meta‑analysis of the protective effect of recom‑ binant human erythropoietin (rhEPO) for neurodevelopment in preterm infants. Cell Biochem Biophys. 2015;71(2):795–802.
7. Grassinger J, Khomenko A, Hart C, Baldaranov D, Johannesen SW, Mueller G, et al. Safety and feasibility of long term administration of recombinant human granulocyte‑colony stimulating factor in patients with amyo‑ trophic lateral sclerosis. Cytokine. 2014;67(1):21–8.
8. Lee YH, Choi KV, Moon JH, Jun HJ, Kang HR, Oh SI, et al. Safety and feasi‑ bility of countering neurological impairment by intravenous administra‑ tion of autologous cord blood in cerebral palsy. J Transl Med. 2012;10:58. 9. Papadopoulos KI, Low SS, Aw TC, Chantarojanasiri T. Safety and feasibil‑
ity of autologous umbilical cord blood transfusion in 2 toddlers with cerebral palsy and the role of low dose granulocyte‑colony stimulating factor injections. Restor Neurol Neurosci. 2011;9(1):17–22.
10. Sun J, Allison J, McLaughlin C, Sledge L, Waters‑Pick B, Wease S, et al. Dif‑ ferences in quality between privately and publicly banked umbilical cord blood units: a pilot study of autologous cord blood infusion in children with acquired neurologic disorders. Transfusion. 2010;50(9):1980–7. 11. Min K, Song J, Kang JY, Ko J, Ryu JS, Kang MS, et al. Umbilical cord blood
therapy potentiated with erythropoietin for children with cerebral palsy: a double‑blind, randomized, placebo‑controlled trial. Stem Cells. 2013;31(3):581–91.
12. Sharma A, Gokulchandran N, Sane H, Nagrajan A, Paranjape A, Kulkarni P, et al. Autologous bone marrow mononuclear cell therapy for autism: an open label proof of concept study. Stem Cells Int. 2013;2013:623875. 13. Tondreau T, Meuleman N, Delforge A, Dejeneffe M, Leroy R, Massy M, et al.
Mesenchymal stem cells derived from CD133‑positive cells in mobilized peripheral blood and cord blood: proliferation, Oct4 expression, and plasticity. Stem Cells. 2005;23(8):1105–12.
14. Moon JH, Kim MJ, Song SY, Lee YJ, Choi YY, Kim SH, et al. Safety and efficacy of G‑CSF mobilization and collection of autologous peripheral blood stem cells in children with cerebral palsy. Transfus Apher Sci. 2013;49:516–21.
• We accept pre-submission inquiries
• Our selector tool helps you to find the most relevant journal • We provide round the clock customer support
• Convenient online submission • Thorough peer review
• Inclusion in PubMed and all major indexing services • Maximum visibility for your research
Submit your manuscript at www.biomedcentral.com/submit
Submit your next manuscript to BioMed Central
and we will help you at every step:
16. Rhodes B, Anderlini P. Allogeneic peripheral blood stem cell collection as of 2008. Transfus Apher Sci. 2008;38:219–27.
17. Koh H, Hwang K, Lim HY, Kim YJ, Lee YH. Mononuclear cells from the cord blood and granulocyte colony stimulating factor‑mobilized peripheral blood: is there a potential for treatment of cerebral palsy? Neural Regen Res. 2015;10(12):2018–24.
18. Díaz MA, Sevilla J, de la Rubia J, Verdeguer A, Espigado I, Mg Vicent, et al. Factors predicting peripheral blood progenitor cell collection from pediatric donors for allogeneic transplantation. Haematologica. 2003;88:919–22.
19. Hofling AA, Sands MS, Lublin DM, Bauer G, Devine S. Collection of a mobilized peripheral blood apheresis product from a patient with muco‑ polysaccharidosis type VII and subsequent CD34 + cell isolation. J Clin Apher. 2004;19:151–3.
20. Hara M, Yuasa S, Shimoji K, Onizuka T, Hayashiji N, Ohno Y, et al. G‑CSF influences mouse skeletal muscle development and regeneration by stimulating myoblast proliferation. J Exp Med. 2011;208(4):715–27.
21. Hayashiji N, Yuasa S, Miyagoe‑Suzuki Y, Hara M, Ito N, Hashimoto H, et al. G‑CSF supports long‑term muscle regeneration in mouse models of muscular dystrophy. Nat Commun. 2015;6:6745.
22. Yoshida S, Hayakawa K, Yamamoto A, Okano S, Kanda T, Yamori Y, et al. Quantitative diffusion tensor tractography of the motor and sensory tract in children with cerebral palsy. Dev Med Child Neurol. 2010;52(10):935–40.
23. Ludeman NA, Berman JI, Wu YW, Jeremy RJ, Kornak J, Bartha AI, et al. Diffusion tensor imaging of the pyramidal tracts in infants with motor dysfunction. Neurology. 2008;71:1676–82.