R E S E A R C H
Open Access
Development of a cDNA microarray for the
measurement of gene expression in the sheep
scab mite
Psoroptes ovis
Stewart TG Burgess
1*, Alison Downing
2, Craig A Watkins
1, Edward J Marr
1, Alasdair J Nisbet
1, Fiona Kenyon
1,
Carol McNair
3and John F Huntley
1Abstract
Background:Sheep scab is caused by the ectoparasitic mite Psoroptes oviswhich initiates a profound cutaneous inflammatory response, leading to the development of the skin lesions which are characteristic of the disease. Existing control strategies rely upon injectable endectocides and acaricidal dips but concerns over residues, eco-toxicity and the development of acaricide resistance limit the sustainability of this approach. In order to identify alternative means of disease control, a deeper understanding of both the parasite and its interaction with the host are required.
Methods:Herein we describe the development and utilisation of an annotatedP. oviscDNA microarray containing 3,456 elements for the measurement of gene expression in this economically important ectoparasite. The array consists of 981P. ovisEST sequences printed in triplicate along with 513 control elements. Array performance was validated through the analysis of gene expression differences between fed and starvedP. ovis mites.
Results:Sequences represented on the array include homologues of major house dust mite allergens and tick salivary proteins, along with factors potentially involved in mite reproduction and xenobiotic metabolism. In order to validate the performance of this unique resource under biological conditions we used the array to analyse gene expression differences between fed and starvedP. ovismites. These analyses identified a number of house dust mite allergen homologues up-regulated in fed mites andP. ovistranscripts involved in stress responses, autophagy and chemosensory perception up-regulated in starved mites.
Conclusion:TheP. ovis cDNA microarray described here has been shown to be both robust and reproducible and will enable future studies to analyse gene expression in this important ectoparasite.
Keywords:Psoroptes, sheep, microarray, gene, expression
Background
Sheep scab, a highly contagious disease caused by the mitePsoroptes ovis, is characterised by pruritis and irri-tation of host skin and is therefore a major welfare con-cern in addition to the substantial costs associated with lost performance, preventative measures, and treatment [1,2]. Current disease control strategies are heavily reli-ant upon injectable endectocides and acaricidal dips but concerns over residues, environmental contamination
and the development of acaricide resistance limit the sustainability of this approach and have resulted in growing interest in the development of alternative con-trol methods [3]. The development of such methods requires a more detailed understanding of both the parasite and its interaction with the host.
The basic biology of the mite is well understood: The entire life cycle of P. ovis is carried out on the ovine host and takes from 11-19 days from egg hatch to egg production by the adult [4]. Mites can survive off-host, enabling their transfer from animal to animal; however, they only remain infective for 15-16 days once removed
from the skin [5]. P. ovis is a non-burrowing, surface
* Correspondence: [email protected]
1
Moredun Research Institute, Pentlands Science Park, Bush Loan, Edinburgh. Midlothian. EH26 0PZ. UK
Full list of author information is available at the end of the article
exudate feeder capable of consuming serous fluids, lymph and red blood cells [6]. Mites survive on the sur-face of the skin and their mouthparts, which are thought to abrade rather than pierce the skin, do not penetrate beyond the stratum corneum, the outermost layer of the skin [7]. The available evidence suggests that mites abrade the stratum corneum and deposit allergens as they progress. The combination of mechanical skin abrasion, mite allergen deposition and grooming beha-viour by the host in response to the pruritis caused by the mites triggers the subsequent activation of a cuta-neous inflammatory response [8,9] including an exudate which has been proposed to supply the mite with a food
source [10]. Establishment of a P. ovis infestation is
therefore the result of a complex interaction between the host and the mite, during which the mite appears to initiate reactions conducive to its own establishment and maintenance [11]. The skin lesions are induced by mite-derived pro-inflammatory factors, a likely source of which are mite excretory/secretory products, including potent enzymes and allergens (reviewed in [10]). While several mite products have been identified, including enzymes and homologues of allergens of the house dust
mite (HDM),Dermatophagoides pteronyssinusand the
scabies miteSarcoptes scabiei, their functions in disease progression remain largely unknown [12].
In the host, a major histological feature of sheep scab is the rapid (within 24 hours) epidermal influx of eosi-nophils and neutrophils, followed by blister formation and a pronounced serous fluid exudate resulting in der-mal oedema [13]. Prior infestation with sheep scab mites alters the progression of subsequent infestations and reductions in lesion size have been observed in sec-ondary infestations in sheep [14]. This evidence points to the development of a protective immune response to P. ovisin sheep and offers encouragement for control by
vaccination [3]. Vaccination with fractionated P. ovis
soluble extracts has resulted in a 15-fold reduction in mite numbers and a 4-fold reduction in lesion size [15,16]. However, identification of the individual teins involved in the development of this partially pro-tective immunity has not yet been achieved. To further understand the mite:host interaction and identify suita-ble avenues for the discovery of novel interventions we
have previously generated a P. ovis cDNA library and
undertaken an expressed sequence tag (EST) approach [17]. This paper describes the use of these ESTs in the construction of aP. ovis cDNA microarray and the utili-sation of this array, the first resource of its type for this economically important ectoparasite, under biological conditions to analyse mite gene expression during expo-sure to, and removal from, the host. This approach was used to analyse which mite genes were expressed at enhanced levels during critical events in the host
parasite relationship, for example mite feeding and digestion - processes which are vital to parasite survival.
Methods
Psoroptes ovismite collection
Ethical approval for this study was obtained from the
Moredun Research Institute Experiments Committee.P.
ovis mites (a mixed population consisting of adults,
nymphs and larvae) were harvested from infested donor animals maintained at the Moredun Research Institute as previously described [8]. For the construction of the
P. ovis cDNA library ~800 mg of live mites were snap
frozen in liquid nitrogen and stored at -80°C for
subse-quent RNA extraction. This stock ofP. ovismite RNA
was used in the construction of the mite cDNA library and also represented the “fed” mite sample. “Starved” mites were obtained by following the same procedure as above, except that, following harvesting, mites (~100
mg) were placed into a 75 cm2 vented cap cell culture
flask (Corning, UK) and incubated for 4 days at 25°C with 80-90% relative humidity.
Extraction of total RNA fromP. ovis
Total RNA was isolated from mites as described pre-viously [18]. RNA samples were further purified using a
Qiagen RNeasy kit, following the manufacturer’s RNA
cleanup protocol and on-column DNase I digestion for 15 minutes at room temperature, before elution into RNase free dH2O. Total RNA yield was assessed using a Nanodrop spectrophotometer and RNA quality was assessed using an Agilent Bioanalyser (Agilent, UK).
Construction and sequencing of aP. ovismite cDNA library
A normalisedP. oviscDNA library was constructed by
ribosomal, tRNA, mitochondrial andEscherichia coliwere removed, leaving 1,033 ESTs for subsequent polymerase chain reaction (PCR) amplification.
Amplification of clonedP. oviscDNAs
P. ovisamplicons, representing the EST sequences (n =
1,033) described above were amplified by PCR using vector-specific oligonucleotide primers in the following reaction for each 384 well plate (3 plates in total used): 168μl FastStart Taq polymerase (Roche, UK); 15,378 μl dH2O; 2,100μl 10× Buffer (Roche, UK); 2,100μl 2 mM
dNTPs (Roche, UK); 1,260 μl 25 mM MgCl (Roche,
UK); 42 μl BSKS F primer (100 pmol/μl) and 42 μl
BSKS R primer (100 pmol/μl) (ARK Genomics, UK) for
a total PCR reaction volume of 50μl per well (reactions carried out in 96-well plates). PCR amplification was performed in a Dyad PCR machine (MJ Research, UK) and started with incubation at 95°C for 6 mins followed by 15 cycles of 95°C for 30 secs; 58°C for 30 secs and 72°C for 1 min. Amplification then progressed for a further 19 cycles with the same conditions except that the 72°C product extension phase was extended by 5 seconds after each cycle. PCR amplification was con-cluded with 7 min incubation at 72°C. PCR product cleanup was performed using a Sciclone Liquid Hand-ling System (Caliper, UK). Each 50μl PCR reaction was filtered through a 384-well PCR filter plate (Millipore, UK) using positive head pressure for 10 mins, washed
with 100 μl of MilliQ water and positive pressure
applied for a further 10 minutes. Forty microlitres of
dH2O was added to each well and mixed with shaking
for 10 mins, samples were then aspirated with mixing and transferred to a 384-well cleanup plate (Genetix, UK). Successful PCR product amplification was assessed by the presence of a single product band through gel electrophoresis; 2μl PCR product was mixed with 7μl TE/glycerol (2:1) mix and 5μl loaded onto a 1% agarose gel. PCR amplification yield was assessed using a Fluor-oskan Ascent microplate fluorometer (Thermo Fisher, UK). Briefly, PCR product concentration was assessed
by adding 20 μl of a 1:200 dilution in TE of each
cleaned PCR product into a 384-well Fluorotrac plate
(Greiner, UK) along with 20 μl Picogreen solution
(Thermo Fisher, UK) and DNA concentration deter-mined by comparison to a standard curve. Fifty two of the 1,033 EST sequences failed to sufficiently amplify either a single PCR product or a sufficient yield of pro-duct for printing and were therefore excluded from the microarray generation, leaving 981 ESTs represented on
theP. oviscDNA microarray.
EST annotation
The 981 P. ovis ESTs used for printing the cDNA
microarray were annotated by homology comparison
employing the NCBI non-redundant (nr) database using the NCBI BLASTn function within the blast2go software package [20-22]. Where available, Gene Ontology (GO) annotation was also associated with each probe from within the blast2go package. This process and the anno-tated dataset has been published previously [17] and
annotation of theP. ovis cDNA microarray is available
in Additional File 1.
Construction of theP. oviscDNA microarray
In order to obtain representative data for the relative expression of each probe and reduce overall variation, all EST probes were printed onto the arrays in triplicate. To aid data analysis and interpretation, a number of standard control probes were also printed, including Landing Lights for array alignment, salmon sperm DNA, Cot-1
DNA,P. ovis and murine genomic DNA probes and a
range of positive and negative spike-in control probes (Alien Spot Report, Stratagene, UK). Both positive and negative control probes were printed onto the array in a minimum of triplicate. Array printing was performed on a Super Marathon microarray Inkjet printer (Arrayjet, UK) using a 32 JetSpyder to pick up DNA samples from the plate and transfer to the inkjet print head. Slides used were GAPSII (Corning, UK). All test probes were printed at 115 ng/μl using a print volume of 14μl. Alien Spot Report probes were printed at either 100 ng/μl or in a dilution series of 8 spots (100 ng/μl - 10 fg/μl). Human Cot-1 DNA and Salmon Sperm DNA controls were printed at 50 ng/μl, polyA control probe was printed at 5
ng/μl whilst P. ovisand murine genomic DNA were
printed at 150 ng/μl. After printing, slides were baked at 80°C for 4 hours to allow covalent bond formation, fixing the cDNA to the slide. Slides were then blocked with bovine serum albumin (BSA, 0.1 mg/ml in dH2O) at 42°C for 1 hour to prevent non-specific binding.
Arrays were printed, four on each slide, to fit within the confines of the MAUI (A4 mixer) 4× hybridisation cassette (BioMicro Systems, USA) allowing 4 arrays to be run on a single slide. Each array consisted of 3 repli-cate blocks of 36 × 32, arranged 12 blocks per slide for the 4 arrays. Each slide contained a total of 13,824 probes, with each of the 4 arrays consisting of 3,456
probes. This was broken down into 2,943P. ovisprobes
(981 ESTs printed in triplicate) and 513 control ele-ments which included 15 positional controls with 5 probes per block [Landing Lights, Alien Spot Report
(Stratagene, UK) PCR product 1], 9 P. ovis genomic
5 sets of 9 probes (Alien Spot Report PCR products
2-6). The P. ovis cDNA microarray and the associated
GAL file have been submitted to the ArrayExpress data-base and are accessible under the following accession
number: A-MEXP-2063, with the title: Psoroptes ovis
cDNA microarray.
Microarray quality control
To limit the degree of slide to slide variation for array analysis, theP. oviscDNA arrays were printed in a single print run. Array print quality was checked by randomly selecting 4 microarray slides from across the print run and hybridising with Panomer-9 oligonucleotides to visualise both the shape and size of all printed spots, ensuring uniformity in the amount of DNA spotted. This analysis confirmed that the microarray printing was of a consistent and acceptable quality (Data not shown).
RNA preparation, labelling and amplification
Linearly amplified RNA (aRNA) was generated from 100 ng total RNA of each sample for analysis using the Mes-sageAmp aRNA kit (Ambion, UK) according to the
manufacturer’s instructions. The aRNA was indirectly
coupled with a fluorescent Cy dye, either Cy3 or Cy5 (GE Bioscience, UK) by the incorporation of a 5-(3-ami-noallyl)-UTP in a cDNA synthesis reaction, followed by dye binding and purification following the protocol available on the ARK Genomics website (http://www. ark-genomics.org/protocols/DyeCouplingAaRNA.php).
Microarray hybridisation and washing
Hybridisations were performed on a MAUI microarray hybridisation system (BioMicro Systems, USA) using the MAUI Mixer A4 hybridisation cassette with a 16μl fill volume per chamber (BioMicro Systems, USA) which allowed the four microarrays on a single slide to be trea-ted independently. The hybridisation mixture consistrea-ted of the following: 13.6 μl of a 1:1 mixture of UltraHyb
(Ambion, UK) and 2 × SSC (Sigma, UK); 1.6μl PolyA
(10 mg/ml, Sigma, UK); 1.6μl of 25 pmol Cy3 labelled
sample; 1.6μl of 25 pmol Cy5 labelled samples; 0.8μl Salmon Sperm DNA (10 mg/ml, Invitrogen, UK) and
0.8 μl BSA (50 mg/ml, Ambion, UK) to a final volume
of 20 μl. Hybridisation was performed at 42°C for 16
hours in a microarray hybridisation oven (Agilent Tech-nologies, UK). Slides were washed by dipping up and down for 1 min in Buffer 1 (0.2× SSC + 0.5% SDS) and then for one min in Buffer 2 (0.2× SSC). Slides were then placed into slide racks with lint free tissue at the bottom, and centrifuged at 1,200 rpm for 6 mins to dry.
Microarray scanning, data extraction and data analysis
Slides were scanned on an Axon 4200AL microarray scanner (Molecular Devices, UK) with laser power set at
80%. The optimum fluorescent signal with limited saturation was selected using the Auto PMT setting. Data extraction was performed within GenePix Pro (Version 7, Molecular Devices) for each individual array using the GenePix Array List (GAL) file. Data analysis was performed using the Partek Genomics Suite (Partek Inc, USA). Dye swaps were performed for all of the array comparisons and raw microarray data for each array were normalised using the default RMA function within the software and differential expression of tran-scripts represented by the probes determined using the one way analysis of variance (ANOVA) function. The batch effect ANOVA function of Partek was run to remove the effect of dye from the results. Multiple test correction was performed using the Benjamini & Hoch-berg False Discovery Rate (FDR) procedure with an FDR corrected p-value cut-off of≤0.05 [23].
Scatter plot analysis of microarray performance
In order to determine the ability of the array to detect differences in gene expression under experimental con-ditions a range of hybridisations were performed com-paring control (fedP. ovisRNA) and biological (starved
and fed P. ovis RNA) samples. Scatter plots were
pre-pared using the raw non-normalised, transformed (nat-ural log) array data, averaged for each comparison from the four hybridisations (2 dye-swapped (Cy3/Cy5) repli-cates each) and linear regression analysis performed to determine the degree of variance between the individual comparisons using GraphPad Prism (GraphPad Software Inc, Version 5.04).
Quantitative real-time PCR (qPCR) analysis of selected microarray probes
qPCR analysis was performed on the original RNA sam-ples used to generate the aRNA employed in the micro-array studies, i.e. control (fed)P. ovisand starvedP. ovis mite RNA. Two differentially expressed candidate genes
from the fed vs starvedP. ovis microarray comparison
were selected for further analysis by qPCR, namely Pso o 1 and Pso o 2. Gene specific primers were designed
based on theP. ovis sequence data for Pso o 1 and Pso
o 2 using the Primer3 program [24]. Primer sequences
were as follows: Pso o 1-Forward (5’
TCAAGCTTGC-CAAATCGGCGC’3), Pso o 1-Reverse (5’
CACCACCG-CAACCGTGTTGTG’3), Pso o 2-Forward (5’AGGCTG
TTCAGGTGATTACTGCGT’3), Pso o 2-Reverse
(5’TGGCAACCATCATGATCACGCCA’3). Relative
quantification of gene expression was performed using the standard curve method and data was normalised to the level of a housekeeping gene [P. ovisbeta-actin,
pri-mer sequences as follows: beta-actin-Forward
(5’TGAATTGCCTGATGGTCAAG’3),
strand cDNA was synthesised from 100 ng of theP. ovis aRNA samples using Superscript II (Invitrogen, UK) and oligo(dT) primers (Sigma-Aldrich, UK) according to
manufacturer’s instructions. qPCR was performed in
quadruplicate on cDNA samples using an ABI Prism 7000 real-time thermal cycler (Applied Biosystems, UK) and the primer sets as defined above. Standard curves were constructed from serial 10-fold dilutions (108-102 copies per μl) of previously constructed and linearised plasmids containing the relevant P. ovisgene (Pso o 1, Pso o 2 or beta-actin) and amplified in parallel with each series of samples allowing the automatic generation of standard curves using the Applied Biosystems 7000 System SDS software. Correlation co-efficients of the standard curves were between 0.97-0.99 and PCR
effi-ciencies calculated from the slopes were ≥90%. The
number of copies per microlitre of cDNA was calculated and the results normalised to that ofP. ovisbeta-actin.
Results
Microarray construction and gene products represented on the microarray
The most abundant phylum associated with the top BLAST hits for the ESTs used in the construction of the array was the arthropoda, with the most common repre-sentative species being the deer tick,Ixodes scapularis (172 ESTs or 18% of the total with significant BLAST hits). This probably reflects the observation thatI. scapu-larisrepresents the most closely related species toP. ovis with an annotated genome. In addition, a number of ESTs shared homology with gene products from the closely
related HDMsD. pteronyssinus(10 ESTs) andD. farinae
(8 ESTs), including homologues of mite allergens, i.e. Der p 1, Der p 2, Der p 3 and Der p 21. Annotation of theP. oviscDNA microarray can be seen in Additional File 1.
Gene ontology (GO) annotation of the microarray
The sequences of the probes on the array cover a total of 3,509 individual GO terms and GO term annotation showed that 644 of the 981 microarray probes (67%) were associated with at least 1 GO term, with 89 probes being associated with > 10 GO terms. These GO associations can be broken down into the major categories of biological process (43%), molecular function (31%) and cellular com-ponent (26%). All EST sequences represented on the array have been submitted to GenBank and the relevant acces-sion numbers associated with each probe are denoted in Additional File 1. In addition the full GO annotation of
theP. ovisESTs used for the construction of the cDNA
microarray has been published previously [17].
Microarray performance
To assess the performance of the array the following
dye-swapped hybridisation comparisons were set up:A.
Self (fedP. ovis)vsself (fedP. ovis),B. Biological repli-cates (replicated analysis of fedP. oviscontrol vsstarved
P. ovis, compared using two separate dye swapped
arrays),C. Activated biological sample (starvedP. ovis) vs control sample (fedP. ovis). Scatter plots demonstrat-ing the degree of variance between each of these com-parisons can be seen in Figure 1. These demonstrate the high degree of correlation between the self vsself
hybri-disations (R2 = 0.9709) and between replicate samples
(R2 = 0.9786), whilst also showing the increased level of variation within the biological comparison, i.e. fed P. ovis vsstarved P. ovismites (R2 = 0.8920).
Experimental Design
Array performance on biological samples was assessed
through the comparison of RNA from “fed” P. ovis
mites compared with RNA from P. ovis mites, which
had been“starved” for 4 days. Samples were prepared as described above and analysed in duplicate with dye swapped (Cy3/Cy5) samples included, i.e. four hybridisa-tions each.
FedvsstarvedP. oviscomparison
Based on the parameters described above (FDR ≤0.05
and FC ≥1.5) a total of 684 probes represented
tran-scripts which were differentially expressed between the
fed and starved P. ovis mite samples. Nine of these
probes represented transcripts which were present at higher levels in the fed mites (FC range from 1.51 -2.47) whilst the remaining 675 probes represented tran-scripts which were present at lower levels in fed mites (i.e. higher levels in starved mites) FC range 1.5 - 2.68.
FedP. ovis -enriched transcripts
Transcripts present at higher levels in the fed mites included well-characterised mite allergens; the cysteine protease Pso o 1 (FC = 2.17), the gut associated factor
Pso o 2 (FC = 2.15) and a P. ovis homologue of the
HDM group 21 allergen (Der p 21), termed here Pso o 21 (FC = 1.83). The full list of transcripts found to be up-regulated in the fed P. ovismite sample can be seen in Table 1.
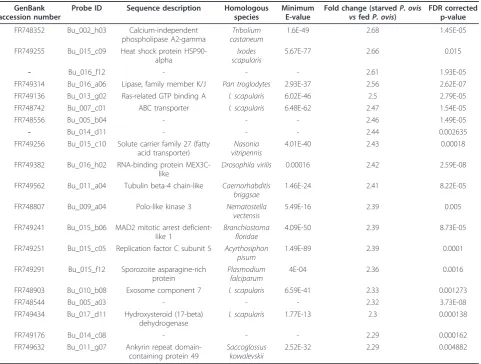
StarvedP. ovis- enriched transcripts
Among transcripts present at higher levels in the starved mites were homologues of those encoding five heat shock proteins, three of which were homologues of putative proteins from the deer tick, I. scapularis. We also observed the 2-fold up-regulation of a homologue of the receptor (chemosensory) transporting protein fromI. scapularisand receptor accessory protein 4 from
Caenorhabditis briggsae in starvedP. ovismites.
regulated autophagy modulator 1 (DRAM1)] also showed 2-fold up-regulation in the starved mites. The top 20 transcripts (highest fold change) up-regulated in
the starved P. ovismite sample can be seen in Table 2
and the full list of 675 probes is available in Additional File 2.
qPCR analysis of selected microarray probes
The differential expression of two selected genes (Pso o
1 and Pso o 2) between fed and starved P. ovis mites
was verified using qPCR, which confirmed the up-regu-lation of both genes in fedP. ovis mites. The microarray data highlighted an approximate 2-fold up-regulation of
both Pso o 1 and Pso o 2 in fed P. ovis mites and the
qPCR results for these genes further supported these findings with the up-regulation of both genes being con-firmed. The magnitude of change in the level of Pso o 2 was very similar between the two techniques, with a 3.1-fold change seen in the qPCR (compared to 2.15-3.1-fold with the microarray), whilst the magnitude of the change in Pso o 1 was higher with the qPCR at 9.6-fold (compared to 2.17-fold with the microarray). Therefore, this analysis demonstrated a good degree of agreement between the qPCR and mite cDNA array data between fedvsstarved P. ovismites.
Discussion
Here we have described the development, construction and utilisation of a cDNA microarray based on the cur-rently available ESTs for the economically important ectoparasite,P. ovis. This currently represents the most extensive transcriptomic resource for the analysis of this
parasite. The P. ovis probes on the microarray were
derived from a mixed population of mites including lar-vae, nymphs, and male and ovigerous female adults. As such these are likely to represent a broad range of expressed genes across all P. ovis life cycle stages, pro-ducing an array that is applicable to a range of different analyses. Sufficient controls were included in the array design to ensure effective normalisation and all of the EST probes were printed in triplicate enabling an accu-rate estimation of gene expression. The content of the array, although limited to the currently availableP. ovis ESTs, includes homologues of HDM allergens and probes for a number of other important mite factors, i.e. proteolytic enzymes, homologues of tick salivary factors, heat shock proteins and factors involved in drug and xenobiotic metabolism [17]. In addition, the array con-tains factors with no significant homology from BLAST searching which may represent novelP. ovis transcripts and thus provides the opportunity for novel discoveries into the underlying biology of the mite.
By using this microarray to analyse the expression of suites of genes relating to a fundamental feature of host: parasite interaction and mite biology (i.e. feeding), we are moving towards the rational selection of molecular targets for parasite intervention - the identification of
[image:6.595.57.292.91.538.2]vaccine candidates by a “rational” approach. This
Figure 1Scatter plots demonstrating the degree of variance between different sample hybridisations. Scatter plots were constructed from the raw non-normalised, transformed (natural log) array data, averaged for each comparison from the four
hybridisations (2 dye-swapped (Cy3/Cy5) replicates each).A. Selfvs
self hybridisation (FedP. oviscontrolvsfedP. oviscontrol).B. Biological replicates (replicated analysis of fedP. oviscontrolvs
starvedP. ovis, compared using two separate dye swapped arrays). C. Activated samplevscontrol sample (starvedP. ovis vsfedP. ovis
Table 1 Transcripts significantly up-regulated in the fedP.ovismite sample
GenBank accession number
Probe ID Sequence
description
Homologous species
Minimum E-value
Fold change (fedP. ovis vs starvedP. ovis)
FDR corrected p-value
FR748349 Bu_002_g12 - - - 1.55 0.0017
FR748466 Bu_004_b02 Beta-1,3-D-glucanase Cryptopygus antarcticus
8.82E-22 2.32 0.00002
FR748550 Bu_005_a09 - - - 2.47 0.002
FR748633 Bu_005_h12 Pso o 1/Der p 1 allergen
P. ovis/D. pteronyssinus
2.36E-46 2.17 0.00001
FR748686 Bu_006_e09 Macrolide
glycosyltransferase
Streptosporangium roseum
1.49E-44 1.95 0.00002
FR748740 Bu_007_b11 Der p 21 allergen D. farinae 2.13E-36 1.82 0.0002
- Bu_007_e02 - - - 1.51 0.0002
FR748952 Bu_010_f10 Myosin light chain Haemaphysalis qinghaiensis
3.26E-57 1.53 0.0029
FR749449 Bu_017_f04 Pso o 2 group 2 allergen
P. ovis 1.49E-53 2.15 0.0025
Probe ID represents the unique identifier for the microarray probe. FDR corrected p-value shows the Benjamini & Hochberg False Discovery Rate (FDR) corrected p-value for each transcript [23]. E-value is the Expect value which describes the number of BLAST hits one can expect to see by chance for a given sequence, the lower the E-value the more significant the match.
Table 2 Top 20 transcripts significantly up-regulated in the starvedP.ovismite sample.
GenBank accession number
Probe ID Sequence description Homologous
species
Minimum E-value
Fold change (starvedP. ovis vsfedP. ovis)
FDR corrected p-value
FR748352 Bu_002_h03 Calcium-independent phospholipase A2-gamma
Tribolium castaneum
1.6E-49 2.68 1.45E-05
FR749255 Bu_015_c09 Heat shock protein HSP90-alpha
Ixodes scapularis
5.67E-77 2.66 0.015
- Bu_016_f12 - - - 2.61 1.93E-05
FR749314 Bu_016_a06 Lipase, family member K/J Pan troglodytes 2.93E-37 2.56 2.62E-07
FR749136 Bu_013_g02 Ras-related GTP binding A I. scapularis 6.02E-46 2.5 2.79E-05
FR748742 Bu_007_c01 ABC transporter I. scapularis 6.48E-62 2.47 1.54E-05
FR748556 Bu_005_b04 - - - 2.46 1.49E-05
- Bu_014_d11 - - - 2.44 0.002635
FR749256 Bu_015_c10 Solute carrier family 27 (fatty acid transporter)
Nasonia vitripennis
4.01E-40 2.43 0.00018
FR749382 Bu_016_h02 RNA-binding protein MEX3C-like
Drosophila virilis 0.00016 2.42 2.59E-08
FR749562 Bu_011_a04 Tubulin beta-4 chain-like Caernorhabditis briggsae
1.46E-24 2.41 8.22E-05
FR748807 Bu_009_a04 Polo-like kinase 3 Nematostella vectensis
5.49E-16 2.39 0.005
FR749241 Bu_015_b06 MAD2 mitotic arrest deficient-like 1
Branchiostoma floridae
4.09E-50 2.39 8.73E-05
FR749251 Bu_015_c05 Replication factor C subunit 5 Acyrthosiphon pisum
1.49E-89 2.39 0.0001
FR749291 Bu_015_f12 Sporozoite asparagine-rich protein
Plasmodium falciparum
4E-04 2.36 0.0016
FR748903 Bu_010_b08 Exosome component 7 I. scapularis 6.59E-41 2.33 0.001273
FR748544 Bu_005_a03 - - - 2.32 3.73E-08
FR749434 Bu_017_d11 Hydroxysteroid (17-beta) dehydrogenase
I. scapularis 1.77E-13 2.3 0.000138
FR749176 Bu_014_c08 - - - 2.29 0.000162
FR749632 Bu_011_g07 Ankyrin repeat domain-containing protein 49
Saccoglossus kowalevskii
2.52E-32 2.29 0.004882
[image:7.595.59.541.341.705.2]approach, based on an understanding of: i) which mole-cules are essential to survival, and ii) the accessibility of these molecules to the host immune system, has been advocated in the field of ectoparasite vaccine develop-ment for several years [25]. Thus far, forP. ovis, candi-date antigens have been identified through either a
“pragmatic” approach of fractionating native protein
extracts of the mites and using these as vaccines [15,16], or by immunoscreening cDNA libraries [18]. The use of aP. ovismicroarray represents an alternative approach, by targeting those molecules which are differentially regulated during, for example, feeding we can start to address the first of the criteria for rational selection.
The genes up-regulated in the fed mites included homologues of the well characterised HDM allergens Der p 1 and Der p 2, namely Pso o 1 and Pso o 2. Both factors are known to be expressed in the mite gut and are hypothesised to play key roles in mite digestive pro-cesses [26,27]. In further support of these findings a pre-vious study using the method of suppressive subtractive hybridisation demonstrated the up-regulation of Pso o 1 in fed vsstarvedP. ovismites [28]. Pso o 2 is a homolo-gue of the HDM allergen Der p 2 which has been shown to act as a functional mimic of the toll-like receptor 4 (TLR4) accessory protein; MD-2 [29]. Der p 2 has also been localised to mite gut and faecal pellets and may also be involved in the triggering of the cuta-neous inflammatory response upon which the mites feed [8,9]. The allergen Der p 21 (Pso o 21 in P. ovis) has also been localised to HDM gut and faecal pellets and may have a role in mite feeding [30] and up-regulation of this transcript in fedP. ovis mites may be indicative of active digestion. These allergens have previously been localised to HDM faecal pellets and their homologues in
P. ovis are therefore likely to come into contact with
host skin [26,27,30]. During infestation,P. ovisdoes not penetrate beyond the stratum corneum and the host cutaneous inflammatory response appears to be trig-gered by the presence of proteolytic enzymes, such as Pso o 1. The observation that these allergens are recog-nised by the host immune response following infestation suggests they may be valid targets for immunisation [26,30].
Amongst the transcripts up-regulated in starved mites were a number representing genes involved in the stress response, including those implicated in the cellular response to heat shock. Heat shock proteins are molecu-lar chaperones with key roles in signal transduction, protein folding and degradation and can also be up-regulated as part of the stress response to starvation [31,32]. Homologues of two tick genes involved in
autophagy were also up-regulated in starved P. ovis
mites, namely ATG3 and DRAM1. The process of autophagy is a critical proteolysis system that is induced
during starvation [33]. Although the P. ovislife cycle takes place in its entirety on the host, the mites are able to survive off-host for up 15-16 days and they, like other arthropods, must therefore possess a degree of tol-erance to starvation [4,10]. In ticks the process of autop-hagy helps to compensate for the lack of host-derived nutrients during periods of time spent off-host [34,35]. The identification of genes potentially involved in autop-hagy indicates that a similar process may also exist inP. ovis, thus protecting mites during periods spent off-host and allowing mites to survive during transfer from one host to the next. Also of note was the 2-fold up-regula-tion of a homologue of the receptor (chemosensory)
transporting protein from I. scapularis and receptor
accessory protein 4 from Caenorhabditis briggsae in
starved P. ovismites. These factors have been implicated in the promotion of the functional cell surface expres-sion of odorant receptors [36] which play key roles in the detection of odour and in the location of the host or a preferred food source [37]. The up-regulation of these factors in starved mites may be indicative of the mite response to a lack of nutrients by increasing efforts to locate a food source. This is further supported by the previous identification of an olfactory receptor up-regu-lated in starved P. ovismites [28]. Also up-regulated in starved mites were two probes representing homologues ofI. scapularissecreted salivary factors (a secreted sali-vary gland peptide (2-fold) and a secreted salisali-vary pro-tein (1.6-fold)). Although salivary gland structures have not been conclusively identified in P. ovisthey are pre-sent in other Astigmatid mites e.g.Acarus siro [38]. In addition four homologues of potential
salivary/oesopha-geal gland factors have been identified in P. ovis,
although in this study these factors were up-regulated in fed mites [28]. The up-regulation of salivary factors in starved mites as described here may be indicative of increased preparation to feed and the observed contra-diction in regulation between this and the previous study [28], is likely to be due to the identification of dif-ferent factors in each study.
Conclusions
relatively low cost, i.e. the nominal cost of a printed slide and reagents. The P. ovis array provides an excel-lent resource for the transcriptomic analysis of P. ovis and related mites and opens up the possibility of future studies to dissect as yet unexplored aspects of mite viru-lence [39], the increasing problem of drug resistance [40,41] and the transcriptional analysis of different life cycles stages, i.e. egg, larva, nymphal stages and adults.
The P. ovis cDNA array is available from the authors
upon request.
Additional material
Additional file 1:P. oviscDNA microarray annotation data. This file contains the annotation of the probes used in the construction of theP. oviscDNA microarray, which includes Probe ID, GenBank accession ID and sequence description from BLAST analysis.
Additional file 2: Microarray transcripts up-regulated in starvedP. ovismites. This file contains the full list of 675 probes found to be significantly up-regulated in starvedP. ovismites and contains the Probe ID, GenBank accession ID, sequence description, minimum E-value, fold change and FDR corrected p-value for each probe.
Acknowledgements
This study was funded by the Department for Environment, Food and Rural Affairs (Defra), UK under project OD0553. CAW, FK, JFH and AJN gratefully acknowledge funding from the Scottish Government. We would like to thank Richard Talbot of the ARK Genomics Centre for Comparative and Functional Genomics for his invaluable technical advice; Alex Lainson and Raja Yaga of the Moredun Bioinformatics Division for their bioinformatics support and BLAST analysis and the Moredun Clinical Division for their continued help and expertise in animal care.
Author details
1Moredun Research Institute, Pentlands Science Park, Bush Loan, Edinburgh.
Midlothian. EH26 0PZ. UK.2ARK-Genomics, The Roslin Institute, University of Edinburgh, Roslin. Midlothian. EH25 9PS, UK.3Strathclyde Institute of
Pharmacy and Biomedical Sciences, University of Strathclyde, 161 Cathedral Street, Glasgow. G4 0RE. UK.
Authors’contributions
STGB designed the study, performed and processed mite samples and RNA extractions, participated in the design and annotation of the microarray, analysed the microarray and qPCR data and wrote the manuscript. AD participated in the study design, constructed theP. ovismicroarray, processed the samples and microarray hybridisations and analysed the microarray data. CAW participated in the microarray design, annotation and EBI submission of sequence and microarray data and helped to prepare the manuscript. EJM performed and analysed the qPCR comparisons. AJN participated in the study design and data analysis and helped to prepare the manuscript. FK provided access toP. ovisexpressed sequence tags and assisted with data analysis and manuscript preparation. CM assisted with data analysis and manuscript preparation and supplied sequence data and constructs for Pso o 1 and Pso o 2. JFH conceived and designed the study and helped to prepare the manuscript. All authors have read and approved the manuscript.
Competing interests
The authors declare that they have no competing interests.
Received: 30 November 2011 Accepted: 8 February 2012 Published: 8 February 2012
References
1. Kirkwood AC:History, biology and control of sheep scab.Parasitol Today
1986,2:302-307.
2. Nieuwhof GJ, Bishop SC:Costs of the major endemic diseases of sheep in Great Britain and the potential benefits of reduction in disease impact. Animal Science2005,81:23-29.
3. Nisbet AJ, Huntley JF:Progress and opportunities in the development of vaccines against mites, fleas and myiasis-causing flies of veterinary importance.Parasite Immunol2006,28:165-172.
4. Sweatman GK:Biology ofOtodectes cynotis, the ear canker mite of carnivores.Candian Journal of Zoology1958,36:849-862.
5. O’Brien DJ, Gray JS, O’Reilly PF:Examination of possible transmission of sheep scab mite Psoroptes ovis between host species.Vet Res Commun
1994,18:113-117.
6. DeLoach JR, Wright FC:Ingestion of rabbit erythrocytes containing 51Cr-labeled hemoglobin by Psoroptes spp. (Acari: Psoroptidae) that originated on cattle, mountain sheep, or rabbits.J Med Entomol1981,
18:345-348.
7. Mathieson BR, Lehane MJ:Ultrastructure of the alimentary canal of the sheep scab mite, Psoroptes ovis (Acari: Psoroptidae).Vet Parasitol2002,
104:151-166.
8. Burgess ST, Frew D, Nunn F, Watkins CA, McNeilly TN, Nisbet AJ, Huntley JF:
Transcriptomic analysis of the temporal host response to skin infestation with the ectoparasitic mite Psoroptes ovis.BMC Genomics2010,11:624. 9. van den Broek AH, Huntley JF:Sheep scab: the disease, pathogenesis and
control.J Comp Pathol2003,128:79-91.
10. Hamilton KA, Nisbet AJ, Lehane MJ, Taylor MA, Billingsley PF:A physiological and biochemical model for digestion in the ectoparasitic mite, Psoroptes ovis (Acari: Psoroptidae).Int J Parasitol2003,33:773-785. 11. Sinclair AN, Filan SJ:Confirmation of degenerative effects on psoroptic
mites from scab lesions.Vet Rec1991,129:492.
12. Thomas WR, Smith W:House-dust-mite allergens.Allergy1998,53:821-832. 13. van den Broek AH, Else RW, Huntley JF, Machell J, Taylor MA, Miller HR:
Early innate and longer-term adaptive cutaneous immunoinflammatory responses during primary infestation with the sheep scab mite, Psoroptes ovis.J Comp Pathol2004,131:318-329.
14. Bates P:Differences between primary and secondary infestations with the sheep scab mite, Psoroptes ovis.Vet Rec2000,146:528-529. 15. Smith WD, Bates P, Pettit DM, Van Den Broek A, Taylor MA:Attempts to
immunize sheep against the scab mite, Psoroptes ovis.Parasite Immunol
2002,24:303-310.
16. Smith WD, van den Broek A, Huntley J, Pettit D, Machell J, Miller HR, Bates P, Taylor M:Approaches to vaccines for Psoroptes ovis (sheep scab).Res Vet Sci2001,70:87-91.
17. Burgess STG, Nisbet AJ, Kenyon F, Huntley J:Generation, analysis and functional annotation of expressed sequence tags from the ectoparasitic mite Psoroptes ovis.Parasites & Vectors2011,4:145.
18. Nisbet AJ, Halliday AM, Parker L, Smith WD, Kenyon F, Knox DP, Huntley JF:
Psoroptes ovis: identification of vaccine candidates by immunoscreening.Exp Parasitol2008,120:194-199.
19. Altschul SF, Gish W, Miller W, Myers EW, Lipman DJ:Basic local alignment search tool.J Mol Biol1990,215:403-410.
20. Conesa A, Gotz S:Blast2GO: A comprehensive suite for functional analysis in plant genomics.Int J Plant Genomics2008,2008:619832. 21. Conesa A, Gotz S, Garcia-Gomez JM, Terol J, Talon M, Robles M:Blast2GO: a
universal tool for annotation, visualization and analysis in functional genomics research.Bioinformatics2005,21:3674-3676.
22. Gotz S, Garcia-Gomez JM, Terol J, Williams TD, Nagaraj SH, Nueda MJ, Robles M, Talon M, Dopazo J, Conesa A:High-throughput functional annotation and data mining with the Blast2GO suite.Nucleic Acids Res
2008,36:3420-3435.
23. Benjamini Y, Hochberg Y:Controlling the false discovery rate: a practical and powerful approach to multiple testing.Journal of the Royal Statistical Society Series B1995,57:289-300.
24. The National Center for Biotechnology Information primer designing tool Primer3 and BLAST.[http://www.ebi.ac.uk/Tools/sequence.html]. 25. Willadsen P:Anti-tick vaccines.Parasitology2004,129 Suppl:S367-387. 26. Nisbet AJ, MacKellar A, McLean K, Brennan GP, Huntley JF:Eukaryotic
27. Kenyon F, Knox D:The proteinases of Psoroptes ovis, the sheep scab mite-their diversity and substrate specificity.Vet Parasitol2002,
105:317-325.
28. McNair CM, Billingsley PF, Nisbet AJ, Knox DP:Feeding-associated gene expression in sheep scab mites (Psoroptes ovis).Vet Res2010,41:16. 29. Trompette A, Divanovic S, Visintin A, Blanchard C, Hegde RS, Madan R, Thorne PS, Wills-Karp M, Gioannini TL, Weiss JP, Karp CL:Allergenicity resulting from functional mimicry of a Toll-like receptor complex protein.Nature2009,457:585-588.
30. Weghofer M, Dall’Antonia Y, Grote M, Stocklinger A, Kneidinger M, Balic N, Krauth MT, Fernandez-Caldas E, Thomas WR, van Hage M, Vieths S, Spitzauer S, Horak F, Svergun DI, Konarev PV, Valent P, Thalhamer J, Keller W, Valenta R, Vrtala S:Characterization of Der p 21, a new important allergen derived from the gut of house dust mites.Allergy
2008,63:758-767.
31. Santoro MG:Heat shock factors and the control of the stress response. Biochem Pharmacol2000,59:55-63.
32. Cherkasova V, Ayyadevara S, Egilmez N, Shmookler Reis R:Diverse Caenorhabditis elegans genes that are upregulated in dauer larvae also show elevated transcript levels in long-lived, aged, or starved adults. J Mol Biol2000,300:433-448.
33. Yorimitsu T, Klionsky DJ:Autophagy: molecular machinery for self-eating. Cell Death Differ2005,12(Suppl 2):1542-1552.
34. Umemiya-Shirafuji R, Matsuo T, Fujisaki K:Autophagy in ticks.Methods Enzymol2008,451:621-638.
35. Umemiya R, Matsuo T, Hatta T, Sakakibara S, Boldbaatar D, Fujisaki K:
Autophagy-related genes from a tick, Haemaphysalis longicornis. Autophagy2008,4:79-81.
36. Matsunami H, Mainland JD, Dey S:Trafficking of mammalian
chemosensory receptors by receptor-transporting proteins.Ann N Y Acad Sci2009,1170:153-156.
37. Dahanukar A, Hallem EA, Carlson JR:Insect chemoreception.Curr Opin Neurobiol2005,15:423-430.
38. Hughes TE:The Physiology of the Alimentary Canal of Tyroglyphus farinae.Journal of Microscopical Science1950,s3-91:45-61.
39. Bates PG:Inter- and intra-specific variation within the genus Psoroptes (Acari: Psoroptidae).Vet Parasitol1999,83:201-217.
40. Pap L, Sarkozy P, Farkas R, Bleicher E, Szego A:Efficacy of some pyrethroids against a strain of the rabbit ear mite (Psoroptes cuniculi): an unusual cross-resistance pattern.Parasitol Res1997,83:203-205. 41. Clark AM, Stephen FB, Cawley GD, Bellworthy SJ, Groves BA:Resistance of
the sheep scab mite Psoroptes ovis to propetamphos.Vet Rec1996,
139:451.
doi:10.1186/1756-3305-5-30
Cite this article as:Burgesset al.:Development of a cDNA microarray for the measurement of gene expression in the sheep scab mite
Psoroptes ovis.Parasites & Vectors20125:30.
Submit your next manuscript to BioMed Central and take full advantage of:
• Convenient online submission
• Thorough peer review
• No space constraints or color figure charges
• Immediate publication on acceptance
• Inclusion in PubMed, CAS, Scopus and Google Scholar
• Research which is freely available for redistribution