Rochester Institute of Technology
RIT Scholar Works
Theses Thesis/Dissertation Collections
5-1-2009
Genetic elements of microbes: a comprehensive
and integrated genomic database application
Ashlee Benjamin
Follow this and additional works at:http://scholarworks.rit.edu/theses
This Thesis is brought to you for free and open access by the Thesis/Dissertation Collections at RIT Scholar Works. It has been accepted for inclusion in Theses by an authorized administrator of RIT Scholar Works. For more information, please [email protected].
Recommended Citation
Genetic Elements of Microbes:
A Comprehensive and Integrated Genomic Database Application
Approved: ______________________________________ Director of Bioinformatics
______________________________________ Head, Department of Biological Sciences
Submitted in partial fulfillment of the requirements for the Master of Science degree in Bioinformatics at the Rochester Institute of Technology.
Abstract
The increasing abundance of genomic data has led to the creation of several databases containing the sequence data, metadata about the sequences and information about the organisms. These data are useful in many areas of biological research. Of the many available databases, few contain a significant amount of genome-associated data. In an effort to create a comprehensive microbial genomes database, the Genetic Elements of Microbes (GEM) database application was created. A K-mer analysis tool was also created and added the GEM application to provide an analysis of sequence composition and potential Lateral Gene Transfer (LGT) identification. The GEM application was designed to be convenient to maintain and extend. The K-mer analysis tool’s ability to identify islands and to identify LGT events was tested with comparisons to published works. The GEM database application provides another source of genomic sequence and genome-associated data for the scientific community. The K-mer analysis addition provides an easy-to-customize tool to identify regions of dissimilarity and identify potential LGT events. The GEM application interface is publicly accessible at http://bucatini.bioinformatics.rit.edu/~amb4541/cgi-bin/
Thesis Committee
1. Committee Co-Advisor Justin Johnson
Bioinformatics Manager J. Craig Venter Institute 2. Committee Co-Advisor
Dr. Gary Skuse
Director of Bioinformatics Professor of Biological Sciences Rochester Institute of Technology 3. Committee Member
Dr. David Lawlor
Associate Professor of Biological Sciences Rochester Institute of Technology
4. Committee Member Dr. Shibu Yooseph
Acknowledgements
List of Figures
Figure 1 - GEM Application Design ... 11
Figure 2 - GEM Database Schema ... 12
Figure 3 - K-mer Signature Example ... 18
Figure 4 - K-mer Signature Distance Analysis Example ... 20
Figure 5 - Sample K-mer Signature Distance Plot ... 22
Figure 6 - GEM Database Application Home Page ... 25
Figure 7 - GEM Database Application Browsing Page ... 26
Figure 8 - GEM Database Application Genome Information Page ... 27
Figure 9 - GEM Database Application Genome Selection Page ... 28
Figure 10 - GEM Database Application Download Selection Page ... 29
Figure 11 - GEM Database Application Download Results Page ... 30
Figure 12 - GEM Database Application K-mer Analysis Selection Page ... 31
Figure 13 - GEM Database Application K-mer Analysis Page ... 32
Figure 14 - GEM Database Application K-mer Analysis Results Page ... 33
Figure 15 - GEM Database Application Page Navigation Paths ... 34
List of Tables
Table I - Results from Gamma-Proteobacterial Genomes ... 37
Table II - Results from Neisseria meningitidis ... 40
Table III - Results from Wolinella succinogenes ... 40
Table IV - Results from Pseudomonasputida KT2440 ... 41
Table V - Results from Escherichia coli CFT073 ... 41
Table of Contents
I. Abstract ………...………….………... ii
II. Thesis Committee ……..…..………...………... iii
III. Acknowledgements .…...….………... iv
IV. List of Figures ……….……….. v
V. List of Tables ……… vi
VI. Table of Contents ……… vii
VII. Introduction ……….….. 1
VIII. Materials and Methods ……….... 10
a. GEM Program Design ………... 10
i. Database Design ……….………... 12
ii. Value Objects ... 14
iii. Data Abstraction ………....……….... 14
iv. Data Retrieval and Sources ……….…...……….... 15
v. Data Cleanser ………...……….... 16
vi. Web Interface ……….……….... 17
b. K-mer Analysis ………...……….... 17
i. K-mer Analysis Algorithm ………. 17
ii. Sequence Composition Distance Plots ………... 21
iii. Island Signature Comparisons ……… 22
iv. Web Interface ………... 22
d. LGT Identification with K-mer Analysis ………... 23
IX. Results ………... 25
a. Genomic Data ………... 25
b. GEM Interface ………... 25
c. Standalone K-mer Analysis Interface ………... 35
d. LGT Identification with K-mer Analysis ……….. 36
i. LGT in Thirteen Gamma-Proteobacterial Genomes …. 37 ii. LGT in Neisseria meningitidis ……….. 39
iii. LGT in Wolinella succinogenes ………. 40
iv. LGT in Pseudomonas putida KT2440 ………... 41
v. Genomic Islands in Escherichia coli CFT073 ………... 41
vi. Genomic Islands in Thermotoga maritima MSB8 ….… 42 X. Discussion ………... 45
a. Features ………... 45
b. Potential Uses ………... 48
c. Advantages of Design ………... 48
d. Disadvantages of Design ………...….... 49
e. Limitations ………... 50
f. LGT Identification with K-mer Analysis ……….. 51
g. Potential Improvements to GEM ……….. 53
h. Potential Improvements to the K-mer Analysis ……… 54
Introduction
Over the past decade, the sequencing of organisms’ entire DNA repertoire has exploded with thousands of genomes now available. Sequence data aside, each genome has a significant amount of associated sequence metadata, experimental conditions, organism characteristics, and environmental information. Genomic sequences and this associated data have countless applications in biological research, each application with its own individual data needs. The needs of researchers even vary in terms of sequence data representation; some may need the genome scaffolds while others need the sequences organized by genetic element e.g. chromosomes and plasmids. With so much information and several ways of organizing the sequence data, naturally there are several genomic databases, each with its own advantages and disadvantages.
As one of the most well-known resources in the biological research community, it is no surprise that the NCBI (National Center for Biotechnology Information) has a genomes database [1]. The NCBI Genomes database stores records as genome projects. Each project page provide links to sequence information organized by genetic elements. Sequence length, GC content, number of proteins, and number of RNA’s are also given for each genome. NCBI Genome pages have a link to the GOLD (Genomes Online Database) entry [2]. Each page also allows users to browse other genomes at each level of the taxonomy. Most projects have some text describing the organism, associated diseases, environmental information, etc. This information is important and useful, but displaying it in paragraph form may be
The Genomes Online Database is a source for both completed and in-progress genome projects. GOLD has a significant amount of additional information for each genome, as well as several links to other genomic databases. Like NCBI, GOLD allows users to browse other genomes at each level of the taxonomy. GOLD does not provide sequence data directly, but links to NCBI and other genomic databases. However, some links are to
genomic scaffold pages, others are to genome pages organized by genetic element. This inconsistency may prevent GOLD from being ideal for several research needs.
The Integrated Microbial Genomes (IMG) database is an extremely
comprehensive genomic data source [3]. IMG allows users to browse genomic data by genes, full genomes, and biological function. Each genome page has a vast amount of metadata, links to external sources, chromosome maps and other information. Like several other genomic databases, users may browse other genomes at all taxonomy levels. IMG allows users to obtain sequence data as scaffolds, genes, and intergenic sequences. Metadata information is presented in a systematic and concise way, making IMG a very attractive option for computational data retrieval.
Genome Reviews is an European Bioinformatics Institute (EBI) genomic database that provides access to sequences organized by genetic element [4]. Genome Reviews also provides gene and protein information. No metadata or links to external sources are provided, making Genome Reviews useful only for those who need annotated genomic sequence data and no additional information.
The EBI Genomes Server is another EBI genomic database, but is more
element and the length of each sequence is displayed. Each genome has a link to the Integr8 proteomics database. No additional metadata or links to external data sources are provided.
Integr8 is yet another EBI database and contains the most information by far of the three EBI data sources [6]. Integr8 is a genomics and proteomics database that contains completed genome projects and their associated proteomes. Each genome page has a description of the organism with metadata in paragraph form. Sequence composition and protein statistics are provided for each genetic element and the genome as a whole. Genomic sequence information is organized by genetic element. Integr8 provides DNA and amino acid sequences for genes, while some genome pages also contain orthology, paralogy, and synteny information.
Even all of these well-known genomic databases leave something to be desired in terms of integration of metadata. One feature that seems to be lacking from all of the
aforementioned databases is the ability to browse genomes that share metadata. An epidemiologist looking for all microbes involved with a certain disease, or an
environmentalist interested in extremophiles must rely on literature searching. GOLD and IMG come close by listing this information in a concise way. However, GOLD’s
A K-mer analysis is an analysis of sequence composition and has several applications in genomics research. A K-mer is a K-length segment of DNA. Every DNA sequence has a K-mer frequency signature consisting of a set of frequency values of all possible K-mers in that DNA sequence. K-mer sequence analysis has a wide variety of applications in biological research [7]. K-mer frequency signatures have been shown to be significantly different across species. This can be useful in identifying the source of an unknown DNA sequence, perhaps from metagenomic data. While it is well-known that GC content is helpful in gene identification, K-mer frequency analyses have also proven to be informative. mer analyses have been used to identify lateral gene transfer [8]. Because K-mer frequency signatures are generally different across species, the frequency signatures of segments of a sequence can be compared to the organism’s overall signature. If these are significantly different, there may have been a lateral gene transfer event.
Lateral gene transfer occurs when some or all of a genetic element (chromosome or plasmid) is transferred from one organism to another by means other than sexual
Advantageous transfers such as conference of antibiotic resistance or a novel metabolic process could have propagated in the population and accelerated speciation. LGT is a source of genetic diversity and therefore has played a role in evolution. Identification of LGT events can give us a better understanding of their impact on evolution, which in turn will improve our understanding of evolutionary processes in general
With the vast amount of genomic data now available, the scientific community has a better opportunity to identify LGT events via genomic analysis. Several computational methods have already been employed to identify gene transfer events, all having very unique approaches.
Phylogenetic analysis is one of the most commonly used and most reliable methods for identifying LGT events [10, 11, 12]. Phylogenetic methods rely on our current knowledge of evolutionary relationships between species. One approach has been to systematically simulate insertions and deletions, rearranging phylogenetic trees. Trees are typically built using maximum likelihood or maximum parsimony and aim to identify LGT by finding insertions and deletions to explain abnormal gene trees [13]. Some take a similar, but much more drastic approach to tree reconstruction. Horizstory is a phylogenetic approach that builds trees from scratch using a specified gene set [14]. This approach treats almost all phylogenetic detections as signal and very few as noise. Horizstory creates a vertical transfer “backbone” and builds lateral transfer events over this backbone. Another common
phylogenetic approach for identifying LGT is comparative genome mapping. Comparative genome mapping is the identification of homologous sequences between genomes,
that do not appear to have any homology. Sequence stretches may lack homology because of insertions, deletions, duplications, or LGT. One particular comparative genomics method, MAGIC, makes use of both levels of comparative mapping [15]. MAGIC first identifies all highly homologous sequences and then investigates the remaining sequence for potential LGT events. IslandPick, another comparative genomics method automatically selects the genomes to be compared based on evolutionary distance [16]. The highly homologous regions are then identified and the remaining sequence investigated for genomic islands, or GIs. In general, phylogenetic approaches are based on a gene’s abnormal similarity with otherwise dissimilar species. These analyses are very effective, but also tend to be extremely computationally intensive.
the aforementioned hypothesis and calculates the substitution rate matrix for genes within a set of genomes, flagging genes whose rate matrices differ significantly from the other genes in that genome. Sequence composition methods are efficient and moderately effective for LGT identification.
Machine learning approaches have also been employed to identify gene transfers. One such method, SIGI-HMM, utilizes codon usage and Hidden Markov Models (HMMs) to detect genetic islands (GIs) as well as to infer a potential donor for each transfer [19]. The codon usage of each gene in a particular genome is compared with codon usage tables for a set of donors, as well as a set of highly expressed genes using HMMs. Wn-SVM is another machine learning approach that uses nucleotide composition in conjunction with a Support Vector Machine (SVM) to identify potential LGT events [20]. SVM’s are machine learning algorithms that create a calculation to achieve a desired result based on input parameters. The SVM is trained using a set of known transfers and run on other genomes to detect transfers. Another common machine learning technique is the use of Bayesian classifiers. One study used a Bayesian classifier in conjunction with oligomer frequencies (i.e. K-mer frequencies) to detect transfers [21]. The classes were individual genomes and the Bayesian classifier was trained with a set of genomes to distinguish among them. A probability of finding a particular sequence belonging to a particular genome was calculated for each candidate transfer
sequence. Machine learning approaches have been a recent addition to techniques for identifying LGT, but they have shown success.
multivariate normal theory [22]. DLIGHT calculates pairwise evolutionary distances between genes in different genomes and performs hypothesis testing of LGT vs. no LGT with a
multivariate normal distribution. Another study combined a gene clustering method and genome position information to search for LGT events [23]. This method first utilized a gene clustering algorithm to identify foreign genes and sets of foreign genes that are similar to one another. Physical genomic position was then used to reevaluate the classes of genes and reassign genes if necessary. Yet another combinatorial approach utilized codon frequencies and log-odds scores to seek out significantly different areas that could result from transfer events [24]. The codon frequency of each gene in a particular genome was compared to the mean codon frequency of its own genome and other genomes to test relatedness.
Combinatorial approaches can be very effective, but are often very stringent. Such approaches can be especially useful to confirm a suspected LGT event.
Some criticize all of the above approaches because the results may be explained by more than just LGT events [8]. Duplications, deletions, and genetic drift among other things can account for potential LGT events. Granted, no computational approach to finding LGT is completely definitive, but in silico analyses are faster than wet lab approaches, and they allow us to utilize the massive amounts of sequence data.
disadvantage brings light to an advantage of K-mer analysis in comparison to phylogenetic approaches. Requiring sequence alignments may overlook a significant portion of LGT events due to mutations that interrupt alignments. K-mer analysis may identify more ancient transfers by lifting the strict sequence conservation restraints.
There are several research applications for K-mer frequency analysis, which is why a K-mer frequency analysis tool was created and incorporated into the GEM database application. The analysis tool is linked directly with all genomes in the database and provides great flexibility with regard to algorithm parameters and analysis output. This flexibility provides researchers with an opportunity to run an analysis relevant to their research.
Materials and Methods
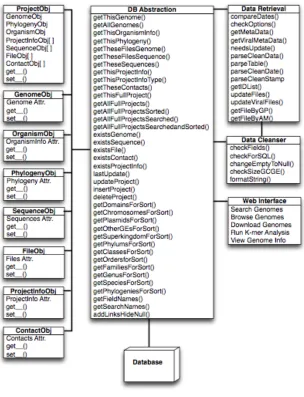
GEM Program Design
The Database Abstraction component provides connections to the database, presents data from the database in a meaningful way (as value objects), and takes care of all database queries and edits. The Data Cleanser maintains Data Integrity and helps ensure the accuracy of the data going into the database. The Data Retriever is the main procedural program on the
Figure 1 - GEM Application Design
server side, and obtains data from outside resources to update the database. Code was checked into Subversion (SVN) for all major revisions in an effort to adhere to standard Software Engineering practices. All components were written in Perl and are described in further detail below.
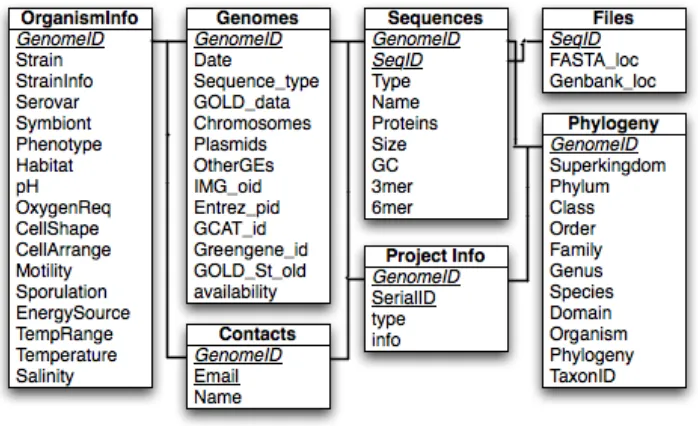
Database Design
The data for GEM is stored in a mySQL database. The database schema is shown in Figure 2.
[image:22.612.136.485.339.552.2]The data is normalized into seven tables. These tables store a wide variety of information as well as file system locations for the sequence and Genbank files. The main primary key in most tables is the Genome ID. This key is either the GOLD Stamp ID from GOLD, or the
Figure 2 - GEM Database Schema
NCBI Genome ID from the Viral Genomes Database. The type of ID is specified in the Genomes table, Sequence_type attribute. The Genomes table also includes general
information about the project and the number of genetic elements. The date in the Genomes table is the date this entry was last updated in GEM. The IMG_oid, Entrez_pid, GCAT_id, Greengene_id, and GOLD_St_old are all identifiers for external genomic databases.
Availability is simply whether the genome project is public or private. The GOLD_data in the Genomes table is a string containing the original IDs from GOLD (not necessarily IDs split by chromosome or plasmid). The OrganismInfo table contains a significant amount of
ProjectInfo entry would be database (or institute, publication, etc). The serial ID is an auto-increment integer to identify a single database entry for that genome. If we had 2 database entries for genome Gc123456, the genome ID, type, and serial IDs (1 and 2) would form a composite primary key for the two entries, where info would contain the name of each database. Each Genome has a single entry each in the Genomes, Phylogeny, and
OrganismInfo tables, and may have many entries in the Sequences, Files, ProjectInfo, and Contacts tables.
Value Objects
Value Object classes were created to represent the data in a meaningful way for the rest of the components. As shown in Figure 1, there are eight value objects: one for each table in the database, and one that combines all other value objects into one single genome project. This Project object has a Genome Object, Organism Info Object, Phylogeny Object, and lists of Contact Objects, Sequence Objects, File Objects, and Project Info Objects. These Value Objects are used by the Data Retriever, Data Cleanser, and Web Interface to interact with the Data Abstraction, and are used by the Data Abstraction to form SQL statements to interact with the database.
Data Abstraction
Interface, and queries to carry out user searches. The Data Retriever obtains genomic information and calls the insert and update methods of the Data Abstraction to update the database. Any data coming in to the Database Abstraction Layer will be passed through the Data Cleanser component to ensure its integrity.
Data Retrieval and Sources
The Data Retrieval component obtains genomic metadata and sequence data in two main steps: gathering a list of genomes and their associated metadata, and then sequence retrieval. For the first step, a different procedure and data source are used for Viruses than for Archaea and Bacteria. When retrieving the genome list and metadata for Archaea and
Object. These metadata types include disease, industrial relevance, database, institution, and country.
Data Cleanser
The Data Cleanser component is a layer that checks (and fixes if necessary) any data going into the Data Abstraction layer for subsequent insertion into the database. Data going in must be checked to ensure that all necessary information is present, does not contain SQL insertions, and is as accurate as possible. The Data Cleanser examines a Project Object to make sure all required fields (such as Genome ID) are present. If a Project passes this check, all allowed undefined values are changed to NULL to allow the Data Abstraction to insert or update this Project. The Data Cleanser also removes all leading and trailing
Web Interface
The web interface for the GEM database application was written using Perl CGI, incorporating some additional html and CSS. Like the other components, the web interface uses Value Objects and Data Abstraction methods. Refer to the Results and Discussion sections for functionality and features of the interface.
K-mer Analysis
The K-mer analysis is an add-on to the GEM database application. A suite of programs all written in Perl carry out a sequence composition analysis, identify K-mer islands, plot differences in sequence composition, and compare island signatures to other genetic elements in the GEM database.
K-mer Analysis Algorithm
Running the K-mer analysis has four main steps: calculating the overall K-mer frequency vector for the sequence, determining thresholds for island identification, scanning the sequence for islands, and refining the island boundaries. The first step when calculating the overall K-mer frequency vector is to identify a list of all possible K-mers. This list is then trimmed of one of each of the reverse complement pairs. Only one of the pairs is counted to avoid strand bias. Then, the K-mers are counted for the entire sequence, overlapping
The example in Figure 3 shows the calculation of the 2-mer frequencies of a short sequence. In the first step, all possible 2-mers are identified, and there are sixteen possibilities. In the second step, all reverse compliments are identified and highlighted in matching colors. These possibilities are then removed from the vector, resulting in ten possibilities in the third step.
Figure 3 - K-mer Signature Example
Next, first 2-mer in the sequence is obtained (AC) and the matching vector position is incremented. This is highlighted by the red box on the sequence and the AC count changed from zero to one. The next step in the figure is similar, identifying the next 2-mer and incrementing the CG count to reflect its presence. In the following step a 2-mer that was deprecated earlier in the process is encountered. In this case, the count of the reverse
If the window size for an analysis is 10kb, the K-mer signature is calculated for the first 10,000 base pairs using the method shown in Figure 3 above. The Euclidean distance between the K-mer signature for the full sequence is calculated. This 10kb window then “slides” down the sequence by the specified slide value. If the slide value was 1,000, the first window would be positions 1-10,000, the second would be positions 1,001-11,000, and so on. When determining thresholds, all of the calculated distance values are stored. The
average and standard deviation of those distances is calculated. Using the specified percentile threshold, the threshold for island identification is set to be the average plus or minus a certain number of standard deviations. The number of standard deviations away from the mean is based on the placement of the threshold percentage on the normal curve. This threshold for islands is calculated for the initial scan as well as the rescan using the
appropriate window size and threshold percentile. Once the thresholds are determined, the sequence is scanned for islands. To identify islands, each sequence is analyzed in the same
Figure 4 - K-mer Signature Distance Analysis Example
manner as the random sequences in the threshold determination step - calculating vectors for segments of the specified window size and calculating the distance from the overall sequence vector. If the distance is above the initial scan threshold, this segment is stored for subsequent refinement. Once the initial scan is complete, the island boundaries are refined. The segments that were above the initial scan threshold are then analyzed a second time with a 10X smaller window size. If the distance of a segment is above the rescan threshold, that segment is (or is part of) an island. Segments above the threshold that are directly adjacent to one another (or overlapping) are automatically joined. However, if an island is within a specified number of base pairs of another island those two islands will be merged. All parameters which include the K value, window size, slide value, threshold percentiles, and the merge threshold are specified by the user.
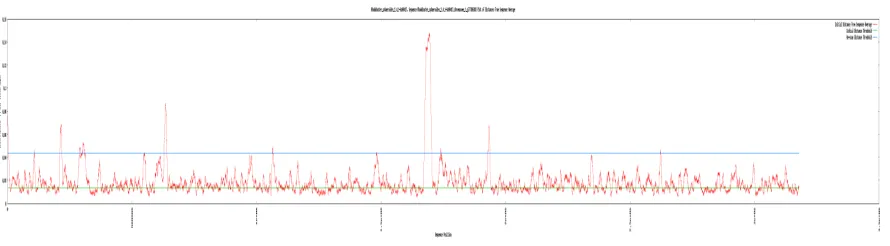
Sequence Composition Distance Plots
Island Signature Comparisons
The K-mer signatures of identified islands can be compared with the full sequence mer signatures of all genetic elements in the GEM database. The distance between the K-mer signature of the island and the K-K-mer signature of each genetic element is calculated. All comparisons may be stored and written to the output file. However, the top three matches are output by default. This is currently only available for 3-mers and 6-mers, as those are the signatures stored in the database.
Web Interface
[image:32.612.91.536.100.223.2]Like the web interface for the GEM database application, the K-mer analysis interface was written using Perl CGI, html and CSS. Refer to the Results and Discussion sections for functionality and features of the interface.
Figure 5 - Sample K-mer Signature Distance Plot
System Information
This application currently runs on an x86_64 Linux server at the Rochester Institute of Technology. Versions 5.8.6, 1.6, and 4.1.20 are used for Perl, BioPerl, and mySQL, respectively.
LGT Identification with K-mer Analysis
To test the validity of using this K-mer analysis to identify LGT events, six different analyses were carried out on genomes and gene sets with previously established LGT or genomic islands. The first comparison was completed with 13 bacterial genomes for four genes known to be products of LGT. The genomes were Buchnera aphidicola APS,
Escherichia coli K12, Haemophilus influenzae rd, Pseudomonas aeruginosa PAO1,
Pasteurella multocida Pm70, Salmonella typhimurium LT, Vibrio cholerae, Wigglesworthia brevipalpis, Xanthomonas axonopodis, Xanthomonas campestris, Xylella fastidiosa, Yersinia pestis, and Yersinia pestis KIM. The genes were ileS, bioB, mviN, and tadA. The genomes were run through the K-mer analysis with a K value of 3, window size of 10,000, slide value of 100, and threshold percentiles of 99.99. A BLASTN search for each gene in each species was performed on the set of island sequences to determine if the genes, or segments of the genes had been identified. The second analysis was run on Neisseria meningitidis to search for sodC, bioC, a conserved hypothetical protein, Type III Restriction enzyme, Type III methyltransferase, and Virulence Associated Protein, all LGT events from Haemophilus influenzae. The analysis was carried out in the same manner as the first. The third analysis was very similar to the previous analyses, except it was carried out with Wolinella
synteny with the pVir plasmid. Very similar to the first three, the fourth analysis searched for genomic islands at Tn4371, glyV, and the clc element in Pseudomonasputida KT2440. The remaining two analyses were a comparison of genomic islands identified by the K-mer analysis method (same parameters as all other analyses) and those published by other researchers. These analyses were for Escherichia coli CFT073 and Thermotoga maritima
Results
Genomic Data
The GEM Database currently contains 3,016 genomes. Fifty three of those genomes are Archaea, 764 are Bacteria, and 2,199 are Viruses.
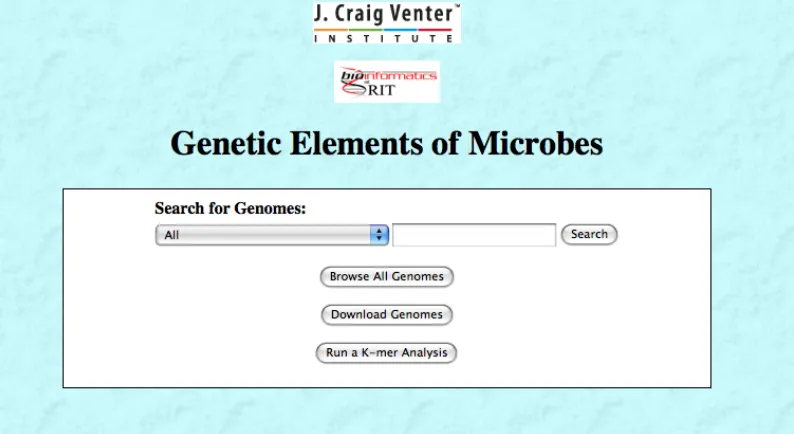
GEM Interface
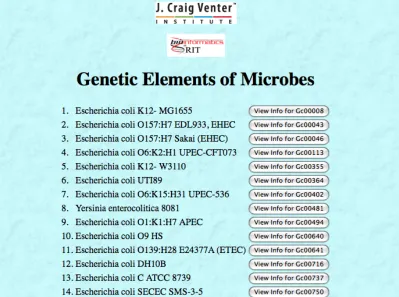
The GEM Interface provides the user with three main functions: browsing genomes (searching or browsing all), downloading genomes, and running a K-mer analysis on a genome. Figure 6 shows the home page for the GEM database application.
[image:35.612.116.513.358.575.2]Both the “Search” button and the “Browse All Genomes” button will bring the user to a page similar to the one shown in Figure 7.
Figure 6 - GEM Database Application Home Page
This is the standard browsing page. The organism name and strain are listed with a button to bring up that genomes information page. If this page is reached via the “Browse All Genomes “ button, all genomes in the database will be displayed. If the user arrives at this page from a search, only genomes matching their search criteria will be present. Clicking on the “View Info” button for a genome, brings up the information page. An example is shown in Figure 8.
Figure 7 - GEM Database Application Browsing Page
The information page displays all data from the database for that genome. Some of the data have “Browse Other Genomes” buttons. These buttons carry out a search for genomes sharing that data point and displays them on the browsing page shown in Figure 7. Clicking
Figure 8 - GEM Database Application Genome Information Page
the “Download Genomes” button on the home page in Figure 6 brings up the genome selection page shown in Figure 9.
[image:38.612.145.486.185.538.2]The genome selection page has genome properties from the database for narrowing and sorting the genomes that appear on the download selection page. Searching for genomes to appear on the download selection page is also allowed. The download selection page is shown in Figure 10.
Figure 9 - GEM Database Application Genome Selection Page
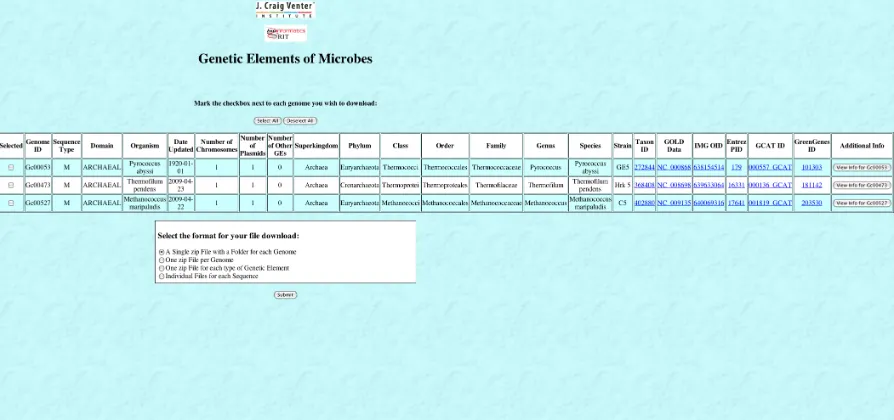
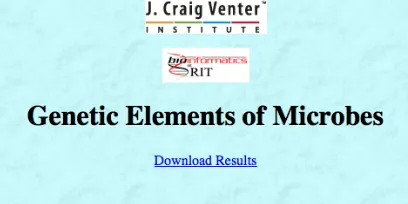
The download selection page displays genomes matching the criteria specified on the genome selection page. Select information from the database is displayed, along with a button leading to the information page (see Figure 8) for each genome. Once the user selects one or more genomes, chooses a download format, and clicks submit, a new page with a link to download the results appears. The download page is shown in Figure 11.
Figure 10 - GEM Database Application Download Selection Page
Running a K-mer analysis on with the GEM Interface is very similar to downloading a set of genomes. The “Run a K-mer Analysis” button on the home page (shown in Figure 6) leads to the same genome selection page shown in Figure 9. When the criteria is specified, the
[image:40.612.214.418.117.219.2]matching genomes are displayed in the K-mer analysis selection page. This page is shown in Figure 12 below.
Figure 11 - GEM Database Application Download Results Page
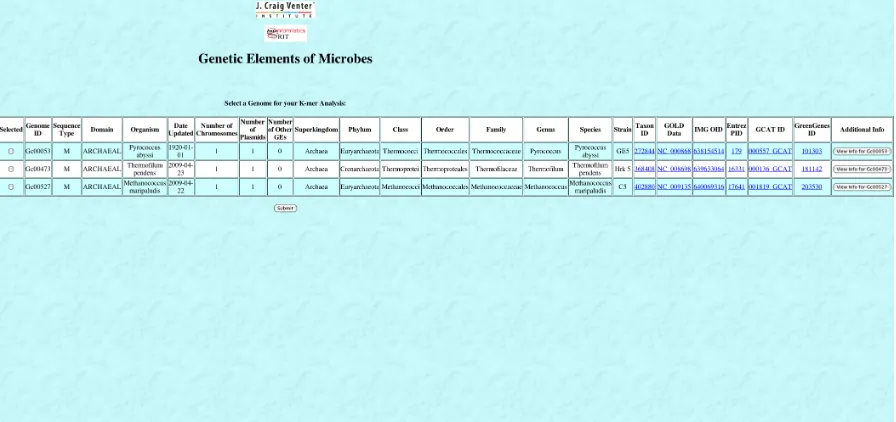
The K-mer analysis selection page is very similar to the download selection page. The same information from the database is displayed, along with a button leading to the information page. Once the user selects a genome for the analysis and clicks submit, the K-mer Analysis page is displayed. This page is shown in Figure 13 below.
Figure 12 - GEM Database Application K-mer Analysis Selection Page
The K-mer analysis page is where the user specifies all parameters and requested output information for their K-mer analysis. See the Discussion section for a more detailed
[image:42.612.113.517.110.408.2]description of parameters that may be specified by the user. Once the parameters are set and the user clicks submit, the K-mer analysis is run and the results are displayed and posted for downloading as shown in Figure 14.
Figure 13 - GEM Database Application K-mer Analysis Page
To summarize the pages, a flow chart with all the page types and three functions is shown in Figure 15.
Figure 14 - GEM Database Application K-mer Analysis Results Page
The main page is shown in the center of Figure 15. Black arrows indicate the browsing navigation through the various pages. Likewise, green indicates the genome downloads and orange indicates the K-mer analysis. Starting with browsing navigation from the home page, the “Search” and “Browse all Genomes” buttons lead to the main browsing page (top and center) with the appropriate genomes displayed. From the browsing page, each “View Info” button leads to the information page (top right) for that particular genome. From the
[image:44.612.145.487.107.455.2]information page, all “Browse Additional Genomes” buttons lead back to the main browsing Figure 15 - GEM Database Application Page Navigation Paths
page with the appropriate genomes displayed. The information pages can also be accessed with the “View Info” buttons on the download and K-mer selection pages (bottom left). If the user is using the genome download navigation, the “Download Genomes” button on the home page leads to the genome selection page (top left). The “Search” or “Submit” button on this page leads to the download selection page (bottom left). Once genomes are selected, the submit button leads to the download page (bottom right). The “Download Genome” button on any information page also leads to the download page for that single genome. The K-mer analysis navigation is very similar to the download genomes navigation. The “Run A K-mer Analysis” button on the home page leads to the same genome selection page. The “Search” or “Submit” button on this page leads to the K-mer selection page (bottom left). Figure 14 does not show the K-mer selection page, but because it is so similar to the download
selection page this is used in its place. Once a genome is selected, the “Submit” button on the K-mer selection page directs the user to the K-mer analysis page. Once the parameters are specified and the “Submit” button is pressed, the analysis is run and the user is brought to the results page. To save space, the actual K-mer analysis results page is not shown in Figure 15. Refer to Figure 14 for a sample K-mer analysis results page. A K-mer analysis can also be run from a genome’s information page by clicking the “Run a K-mer Analysis” button. This will bring the user to the K-mer analysis page to specify their parameters.
Standalone K-mer Analysis Interface
the same as the GEM-linked K-mer analysis except the user uploads a sequence for analysis. The standalone K-mer Analysis Interface is shown in Figure 16.
LGT Identification with K-mer Analysis
[image:46.612.147.485.181.543.2]Six different analyses were carried out on genomes and gene sets with previously established LGT or genomic islands in an attempt to validate the use of the K-mer Analysis for LGT identification.
Figure 16 - Standalone K-mer Analysis Interface
LGT in Thirteen Gamma-Proteobacterial Genomes
The Buchnera aphidicola APS, Escherichia coli K12, Haemophilus influenzae rd,
Pseudomonas aeruginosa PAO1, Pasteurella multocida Pm70, Salmonella typhimurium LT,
Vibrio cholerae, Wigglesworthia brevipalpis, Xanthomonas axonopodis, Xanthomonas campestris, Xylella fastidiosa, Yersinia pestis, and Yersinia pestis KIM genomes were analyzed for LGT of the genes ileS, bioB, mviN, and tadA in comparison to a study by X. Wei et al [25]. The results of the analysis are shown in Table I.
Genome Gene Identified as an Island
Buchnera aphidicola APS ileS Yes
Buchnera aphidicola APS bioB No
Buchnera aphidicola APS mviN No
Buchnera aphidicola APS tadA Not present in genome
Escherichia coli K12 ileS Yes
Escherichia coli K12 bioB Yes
Escherichia coli K12 mviN No
Escherichia coli K12 tadA No
Haemophilus influenzae rd ileS Yes
Haemophilus influenzae rd bioB No
Haemophilus influenzae rd mviN No
Haemophilus influenzae rd tadA Not present in genome
Pseudomonas aeruginosa PAO1 ileS No
Pseudomonas aeruginosa PAO1 bioB Yes
[image:47.612.141.469.343.701.2]Pseudomonas aeruginosa PAO1 mviN No
Genome Gene Identified as an Island
Pseudomonas aeruginosa PAO1 tadA No
Pasteurella multocida Pm70 ileS No
Pasteurella multocida Pm70 bioB No
Pasteurella multocida Pm70 mviN No
Pasteurella multocida Pm70 tadA No
Salmonella typhimurium LT ileS No
Salmonella typhimurium LT bioB No
Salmonella typhimurium LT mviN No
Salmonella typhimurium LT tadA Not present in genome
Vibrio cholerae ileS Yes
Vibrio cholerae bioB Yes
Vibrio cholerae mviN No
Vibrio cholerae tadA Not present in genome
Wigglesworthia brevipalpis ileS No
Wigglesworthia brevipalpis bioB No
Wigglesworthia brevipalpis mviN No
Wigglesworthia brevipalpis tadA Not present in genome
Xanthomonas axonopodis ileS No
Xanthomonas axonopodis bioB Yes
Xanthomonas axonopodis mviN No
Xanthomonas axonopodis tadA Not present in genome
Xanthomonas campestris ileS Yes
Xanthomonas campestris bioB Yes
Xanthomonas campestris mviN No
Xanthomonas campestris tadA Not present in genome
Xylella fastidiosa ileS Yes
Xylella fastidiosa bioB Yes
Genome Gene Identified as an Island
Xylella fastidiosa tadA Not present in genome
Yersinia pestis CO92 ileS No
Yersinia pestis CO92 bioB Yes
Yersinia pestis CO92 mviN Yes
Yersinia pestis CO92 tadA Yes
Yersinia pestis KIM ileS No
Yersinia pestis KIM bioB Yes
Yersinia pestis KIM mviN No
Yersinia pestis KIM tadA Yes
LGT In Neisseria meningitidis
The Neisseria meningitidis genome was analyzed to search for LGT of sodC, bioC, a conserved hypothetical protein, Type III Restriction enzyme, Type III
[image:49.612.152.480.70.294.2]methyltransferase, and Virulence Associated Protein. The results of this analysis are shown in Table II.
Gene Identified as an Island
sodC Yes
bioC Yes
CHP Yes
Type III RE Yes Type III MT Yes
VAP No
LGT in Wolinella succinogenes
Wolinella succinogenes was analyzed for an LGT event at the tRNAMet gene, the nif genes, and an island having synteny with the pVir plasmid. Results are shown in Table III.
Gene/Island Identified as an Island
tRNAMet Yes
nif No
pVir island No
[image:50.612.155.458.127.284.2]Table II - Results from Neisseria meningitidis
Table II shows the results from the analysis of 6 genes in Neisseria meningitidis.
[image:50.612.154.459.497.586.2]Table III - Results from Wolinella succinogenes
LGT in Pseudomonas putida KT2440
The Pseudomonasputida KT2440 genome was analyzed for LGT of Tn4371, glyV, and the clc element. The results are shown in Table IV below.
Gene Identified as an Island
Tn4371 No
glyV Yes
clc element Yes
Genomic Islands in Escherichia coliCFT073
The Escherichia coli CFT073 genome was analyzed for genomic islands to compare to another study. The islands from the previous study, their approximate positions, and whether or not the K-mer Analysis identified the same island are shown in Table V.
Published Island Approximate Positions Identified as an Island
aspV Island 270,000 - 390,000 Yes thrW and betA Island 400,000 - 460,000 Yes cryptic prophage 1 900,000 - 950,000 Yes serX island 1,125,000 - 1,240,000 Yes cryptic prophage 2 and 3 1,325,000 - 1,390,000 Yes cryptic prophage 4 1,400,000 - 1,460,000 Yes
[image:51.612.155.459.230.320.2]Table IV - Results from Pseudomonasputida KT2440
[image:51.612.88.539.562.718.2]Table IV shows the results from the analysis of 3 genes in Pseudomonas putida KT2440.
Published Island Approximate Positions Identified as an Island
serU, asnW, asnT, asnU, cobU,
and galF Island 2,200,000 - 2,400,000 Yes argW Island 2,725,000 - 2,775,000 Yes metV Island 3,225,000 - 3,260,000 Yes pheV Island 3,475,000 - 3,525,000 Yes selC Island 4,250,000 - 4,350,000 Yes pheU Island 4,950,000 - 5,000,000 Yes leuX Island 5,100,000 - 5,150,000 Yes
Genomic Islands in Thermotoga maritimaMSB8
Thermotoga maritimaMSB8 was also analyzed for genomic islands and compared to another study. The results are shown in Table VI.
Approximate Positions Identified as an Island
[image:52.612.90.539.71.260.2]1,000 - 3,000 Yes 16,000 - 20,000 No 22,000 - 33,000 No 68,000 - 78,000 No 95,000 - 97,000 Yes 167,000 - 170,000 No 190,000 - 198,000 Yes 312,000 - 325,000 Yes 362,000 - 364,000 No 386,000 - 390,000 No
[image:52.612.156.458.475.720.2]Table V shows the results from the genetic island analysis in Escherichia coli CFT073.
Approximate Positions Identified as an Island
Approximate Positions Identified as an Island
[image:54.612.165.466.71.248.2]1,510,000 - 1,512,000 No 1,576,000 - 1,578,000 Yes 1,624,000 - 1,630,000 Yes 1,720,000 - 1,734,000 Yes 1,766,000 - 1,768,000 Yes 1,772,000 - 1,776,000 Yes 1,786,000 - 1,790,000 No
Discussion
Features
The GEM database application has several features that would be useful for researchers. As previously discussed, GEM has three main navigation paths: browsing, downloading, and running K-mer analyses. Figure 15 illustrates the workflow between pages. The browsing navigation path has several features for researchers searching for specific genomes and identifying other genomes of interest. The user has the ability to browse all of the genomes or search for genomes they are interested in. When using the search feature, the user may choose to search by 42 different data types, as well as search in all data types. The 42 types include all levels of taxonomy, genome identifiers, environmental information, project information, number of genetic elements, organism morphology, and even project contacts. When a user chooses a genome and views the information page, many more browsing features are available. Each genome information page has links to external data sources including NCBI Nucleotide, IMG, Greengenes, GCAT, and Entrez. There are also buttons on each information page that allow users to browse genomes sharing certain types of data. These browse buttons are present for all levels of taxonomy, disease, relevance,
The download genomes path also has many features worth noting. Selecting genome download from the home page directs the user to the genome selection page. The genome selection page allows a user to narrow the list of genomes for download selection. This is achieved with a search or a “narrow and sort”. The search is just like that of the initial browsing search. The “narrow and sort” option allows the user to narrow the results by Domain, number of genetic elements, and each level of taxonomy. This set can may then be sorted at up to five different levels. Results may be sorted by each of the 42 data types with the search function, and can be in ascending or descending order. Once the user clicks the search or submit button, the genomes matching the criteria will be displayed on the download selection page. The user may select or deselect all using the buttons at the top of the page. A limited amount of information for each genome is displayed in the selection table, as well as links to external data sources and a button leading to the information page for that genome. The user may select one or more genomes to download, and then choose between one of four download types. The available download types include a singe zip file containing a folder for each genome, one zip file per genome, one zip file for each type of genetic element, and individual files for each sequence.
The features of the K-mer analysis navigation path are very similar to those in the download sequences path. Selecting K-mer analysis from the home page leads to the same genome selection page, allowing the user to search or “narrow and sort” the list of genomes they see on the following K-mer selection page. The K-mer selection page displays the same information for each genome, including the external links and button to access the
analysis page. On the K-mer analysis page, the user may completely customize their analysis by specifying the K value, window size, slide value, initial scan threshold percentile, rescan threshold percentile, number of random genomes to generate for threshold determination, island joining threshold for the initial scan, island joining threshold for the rescan, and minimum island size to consider. The user may also specify which analyses he or she would like to run, and which output files to include. The rescan may be included or omitted, and the resulting islands may be compared to the K-mer signatures of all other genetic elements in GEM. If the user chooses to run a comparison, they have the choice between a short
the results page. If plots are displayed on the results page, smaller plots are displayed in the table and when clicked on, open a new window or tab with the full size plot.
To prevent multiple users (or single users running many analyses) from overloading the host server, computationally intensive steps run a check for available resources and wait to continue if the server is very busy. This check is implemented before obtaining genome files for the user, and before running the K-mer analysis. If the cpu or memory usage is above sixty percent on every processor, the application waits for ten seconds and checks again. The application proceeds when resources become available.
Potential Uses
The GEM database application will allow researchers to easily obtain FASTA and Genbank files for their analyses. Sets of genomes can be easily found and retrieved using the download navigation of the application. Scientifically relevant metadata may also be viewed for each genome, providing a fast and easy way to learn more about a particular organism.
There are several potential uses for K-mer analyses. Researchers may use the analysis simply for identification of genomic islands in the sequence(s) of a genome. Genomic island identification has been shown to be useful in gene identification. As
discussed previously, this analysis may also be used for potential LGT identification. There are several other uses for K-mer analysis not mentioned here and this tool will allow researchers to customize their analyses to fit their research needs.
Advantages of Design
beneficial advantage is the convenience of changing components. For example, changing the database would only require changing the value objects and the Data Abstraction layer, at most. Entries in the database are represented by the Value Objects, and the Data Abstraction is the only portion that directly communicates with the database. If the database language were changed to oracle, for example, only the SQL calls in the Data Abstraction would need to be modified. If the database structure were changed completely, the Value Objects and the Data Abstraction would need to be updated, but the Data Cleanser, Data Retriever and the Web Interface could all remain the same. Because the only component communicating with the database is the Data Abstraction and not the Interface, the design makes the application more secure. The separation of the user input and the database helps prevent malicious use. The Data Cleanser also contributes to the security. All calls to modify the database are checked for SQL injections to protect the data integrity. The MVC design also facilitates code re-use, increasing the efficiency for developers. This will make it very easy for future developers aiming to extend or modify the application. Similarly, this design is very extensible. Using the same server-side components, it would be very simple to create a second web interface with a different function. This is also a significant advantage for future developers who may add to this application.
Disadvantages of Design
knowledge about Object Oriented Programming or MVC. Following from the complexity caveat, the large number of files for this project may make it difficult to move or copy to another server. The language choice for this application is also somewhat of a disadvantage. Perl was used for its easy string manipulation, CGI module, and BioPerl modules. However, Perl is not a memory-efficient language. This could slow down the application as well as the host server as the number of available genomes, and thus the size of the database increases.
Limitations
The GEM database currently contains 3,016 genomes. On the current host server, loading all genomes for browsing takes 10 to 15 seconds. At this time, this is merely an inconvenience. However, if the database is extended to include eukaryotic genomes or if the number of microbial genomes available increases (as it most definitely is) this time will increase and could become a more serious concern. When a user downloads many genomes at one time, the archive creation can take several minutes, not including the download time for the user. Again, this is an inconvenience that is worth the time at the moment, but if the user were to attempt to download every single genome or if the database were extended to eukaryotic genomes this would be a serious concern.
Running the K-mer analysis is a computationally intensive and thus time
decreasing the threshold percentiles would all increase the analysis time. The K-mer analysis interface creates an auto-refresh waiting page to prevent a browser time-out.
The resource check also creates a limitation. At any given time, there can only be as many K-mer analyses or genome downloads running as there are processors.
LGT Identification with K-mer Analysis
The K-mer Analysis of thirteen Gamma-Proteobacterial genomes was compared to that in a study by Wei et al. [25]. The results of the K-mer analysis are shown in Table I. Wei et al. implemented a distance-based phylogeny method to rank genes based on their predicted occurrence of LGT. This distance-based method calculated evolutionary distances between orthologs and compared the distances to the overall evolutionary distances between species. One particular validation of this method analyzed the same 13 species previously discussed in the results section. Out of the 13 species for the 4 known LGT genes, they found 4 occurrences of LGT for ileS, 2 for bioB, 2 for mviN, and 1 for tadA. The K-mer analysis identified 6 occurrences for ileS, 8 for bioB, 1 for mviN, and 2 for tadA. Phylogenetic analyses tend to be more stringent than sequence composition techniques. When
investigating closely related species, sequence similarity tends to be more highly conserved than sequence composition. This explains why the K-mer analysis identified more LGT events than the published technique.
for the aforementioned genes using BLASTN (results shown in Table II). All six genes were present in the identified islands, further indicating that the K-mer analysis is able to identify LGT events.
A review by Dobrindt et al. presented identified LGT events in Wolinella succinogenes at the tRNAMet gene, nif genes, and a genomic island having high synteny with the pVir virulence plasmid of C. jejuni [26]. The genome was subjected to K-mer analysis and the islands searched for the above genes, as in the comparison for Neisseria meningitidis. A part of an island matched the tRNAMet gene, but the nif genes and the pVir sequence were not found. The same review presented LGT events in Pseudomonas putida
KT2440 including the Tn4371 transposable element, the clc transposable element, and the glyV gene. The genome was analyzed in the previously noted method. The Tn4371 element was not identified, but sections of the clc element and glyV gene were present in the
identified islands. This lack of identification of some of the LGT events indicates that the K-mer analysis approach does have its limitations. As ancient LGT events, and events under less selective pressure will have likely undergone mutation to better match the K-mer signature of the host genome, K-mer frequency analysis cannot detect all transfer events.
The K-mer analysis was also compared to two studies of genomic island
identification, a study of Escherichia coli CFT073 [27], and a study of Thermotoga maritima
islands. A comparison of all islands over 2kb was completed, results shown in Table VI. Of the 45 islands over 2kb from the study, the K-mer analysis identified 27, or 60%. Running the analysis with parameters optimized for smaller islands may increase the identified islands.
Overall, the K-mer analysis is certainly a useful tool for identifying regions of dissimilarity in a given genome. This is achieved with results comparable to other island identification techniques. This analysis may also be used for identifying potential LGT events, with limited certainty. Validation with published LGT events showed that most transfers were detected by the K-mer analysis, but were not the only islands identified. This is the result of a high false positive rate. However, it is likely that we as a scientific
community do not know every LGT event that has occurred, artificially inflating the appearance of false positives in the analysis. Also, not all genomic islands are necessarily LGT events. Genomic islands can arise from evolutionary phenomena such as genetic drift and highly conserved DNA sequence due to strong positive selection. The nature of a sequence composition analysis is optimal for the identification of genomic islands which include LGT, but are not solely the results of transfers. Due to the relatively high occurrence of false positives in this analysis, it is recommended that the results be used with another LGT identification method. This could be easily achieved by using the sequence file of identified islands.
Potential Improvements to GEM
pleasing interface would be one of the first priorities for future work. Allowing users to dynamically sort their results on the browsing and selection pages would improve their experience with GEM. In addition, the dynamically generated information pages for each genome could be implemented as “pop-outs” instead of in the same page as the CGI. The Data Retrieval component could also be extended to obtain more information from NCBI and other external sources. For example, storing NCBI’s description for each genome would provide users with even more information about the organism. Finally, a more sophisticated estimation of required resources for each download or K-mer analysis would be beneficial.
Potential Improvements to the K-mer Analysis
The K-mer Analysis could be improved in many ways. First, the analysis program could be examined for further optimization to reduce the analysis time. Providing users with the option to turn off reverse compliment masking would increase their ability to customize their analysis. Also, adding knowledge of reading frame to the analysis would provide greater flexibility for researchers in their application of the results. Finally, allowing the user to input an email address to be notified when their analysis finishes would make the K-mer analysis more convenient.
Conclusion
References
[1] NCBI Entrez Genomes. National Center for Biotechnology Information. 20 Apr. 2009 <http://www.ncbi.nlm.nih.gov/sites/entrez?db=genome>.
[2] Liolios K, Mavrommatis K, Tavernarakis N, Kyrpides, NC. The Genomes On Line Database (GOLD) in 2007: status of genomic and metagenomic projects and their associated metadata. NAR 36, D475-D479.
[3] Integrated Microbial Genomes. 20 Apr. 2009 <http://img.jgi.doe.gov/cgi-bin/pub/ main.cgi?page=home>.
[4] Genome Reviews. European Bioinformatics Institute. 20 Apr. 2009 <http:// www.ebi.ac.uk/GenomeReviews/>.
[5] "Genomes Pages - At the EBI." EBI Genomes. European Bioinformatics Institute. 20 Apr. 2009 <http://www.ebi.ac.uk/genomes/>.
[6] Integr8. European Bioinformatics Institute. 20 Apr. 2009 <http://www.ebi.ac.uk/integr8/ EBI-Integr8-HomePage.do>.
[7] Kurtz, Stefan, Apurva Narechania, Joshua C. Stein, and Doreen Ware. "A new method to compute K-mer frequencies and its application to annotate large repetitive plant genomes." BMC Genomics 9 (2008). <http://www.biomedcentral.com/1471-2164/9/517>.
[8] Gogarten, J. Peter, and Jeffrey P. Townsend. "Horizontal Gene Transfer, Genome Innovation and Evolution." Nature Reviews, Microbiology 3 (2005): 679-87.
[9] Kechris, Katherina J., Lin, Jason C., Bickel, Peter J., Glazer, Alexander N. “Quantitative
exploration of the occurrence of lateral gene transfer by using nitrogen fixation genes as a
[10] Podell, Sheila., Terry Gaasterland. "DarkHorse: a method for genome-wide prediction of horizontal gene transfer." Genome Biology 8 (2007).
[11] Poptsova, Maria S., Gogarten, Peter J. “The power of phylogenetic approaches to detect
horizontally transferred genes.” BMC Evol. Biol. (2007).
[12] Tamames, Javier., Moya, Andres. “Estimating the extent of horizontal gene transfer in metagenomic sequences.” BMC Genomics.(2008).
[13] Hao, Weilong, and G. Brian Golding. "Uncovering rate variation of lateral gene transfer during bacterial genome evolution." BMC Genomics 9 (2008).
[14] MacLeod, Dave, Robert Charlebois, Ford Doolittle, and Eric Bapteste. "Deduction of probable events of lateral gene transfer through comparison of phylogenetic trees by recursive consolidation and rearrangement." BMC Evol. Biol. 5 (2005). <http:// www.pubmedcentral.nih.gov/articlerender.fcgi?artid=1087482&tool=pmcentrez>. [15] Swidan, Firas, Eduardo P. C Rocha, Michael Shmoish, and Ron Y. Pinter1. "An Integrative Method for Accurate Comparative Genome Mapping." PLoS Comput. Biol. 2 (2006). PubMed Central. <http://www.pubmedcentral.nih.gov/articlerender.fcgi?
artid=1526463&tool=pmcentrez>.
[16] Langille, Morgan GI, William WL Hsiao, and Fiona SL Brinkman. "Evaluation of genomic island predictors using a comparative genomics approach." BMC Bioinformatics 9 (2008). PubMed Central. <http://www.pubmedcentral.nih.gov/articlerender.fcgi?
artid=2518932&tool=pmcentrez>.
[18] Hamady, Micah., Betterton, M. D., Knight, Rob. “Using the nucleotide substitution rate matrix to detect horizontal gene transfer.” BMC Bioinformatics. (2006).
[19] Waack, Stephan.,Keller, Oliver., Asper, Roman ., Brodag, Thomas., Damm, Carsten., Fricke, Florian., Surovcik, Katharina., Meinicke, Peter., Merkl, Rainer. “Score-based prediction of genomic islands in prokaryotic genomes using hidden Markov models.” BMC Bioinformatics. 142(7). (2006).
[20] Tsirigos, Aristotelis., Rigoustos, Isidore. “A sensitive, support-vector-machine method for the detection of horizontal gene transfers in viral, archaeal and bacterial genomes.” Nucleic Acids Res. 33(12). (2005).
[21] Sandberg, Rickard, Gösta Winberg, Carl-Ivar Bränden, Alexander Kaske, Ingemar Ernberg, and Joakim Cöster. "Capturing Whole-Genome Characteristics in Short Sequences Using a Naïve Bayesian Classifier." Genome Research 11 (2001). PubMed Central. <http:// www.pubmedcentral.nih.gov/articlerender.fcgi?tool=pubmed&pubmedid=11483581>. [22] Dessimoz, Christophe, Daniel Margadant, and Gaston H. Gonnet. "DLIGHT – Lateral Gene Transfer Detection Using Pairwise Evolutionary Distances in a Statistical Framework." <http://www.springerlink.com/content/5664h257423w3k20/>.
[25] Wei, Xintao, Lenore Cowen, Carla Brodley, Arthur Brady, D. Sculley, and Donna K. Slonim. "A Distance-Based Method for Detecting Horizontal Gene Transfer in Whole Genomes." <http://www.cbcb.umd.edu/~abrady/pdf/isbra08.pdf>.
[26] Dobrindt, Ulrich, Bianca Hochhut, Ute Hentschel, and Jörg Hacker. "Genomic Islands in pathogenic and environmental microorganisms." Nature Reviews, Microbiology 2 (2004). [27] Welch, R. A., et al. "Extensive mosaic structure revealed by the complete genome sequence of uropathogenic Escherichia coli." PNAS 99 (2002).