R E S E A R C H
Open Access
Variability in CRP, regulatory T cells and effector T
cells over time in gynaecological cancer patients:
a study of potential oscillatory behaviour and
correlations
Mutsa T Madondo
1, Sandra Tuyaerts
2, Brit B Turnbull
3, Anke Vanderstraeten
2, Holbrook Kohrt
4,
Balasubramanian Narasimhan
3, Frederic Amant
2, Michael Quinn
5and Magdalena Plebanski
1,6*Abstract
Background:The inflammatory marker, C reactive protein has been proposed to also be a biomarker for adaptive immune responses in cancer patients with a possible application in time based chemotherapy. Fluxes in serum CRP levels were suggested to be indicative of a cyclical process in which, immune activation is followed by auto-regulating immune suppression. The applicability of CRP as a biomarker for regulatory or effector T cells was therefore investigated in a cohort of patients with gynaecological malignancies.
Methods:Peripheral blood samples were obtained from a cohort of patients at 7 time points over a period of 12 days. Serum and mononuclear cells were isolated and CRP levels in serum were detected using ELISA while regulatory and effector T cell frequencies were assessed using flow cytometry. To test periodicity, periodogram analysis of data was employed while Pearson correlation and the Wilcoxon signed rank test were used to determine correlations.
Results:The statistical analysis used showed no evidence of periodic oscillation in either serum CRP concentrations or Teffand Tregfrequencies. Furthermore, there was no apparent correlation between serum CRP concentrations
and the corresponding frequencies of Tregsor Teffs. Relative to healthy individuals, the disease state in the patients
neither significantly affected the mean frequency of Tregsnor the mean coefficient of variation within the Treg
population over time. However, both Teffmean frequency and mean coefficient of variation were significantly
reduced in patients.
Conclusion:Using our methods we were unable to detect CRP oscillations that could be used as a consistent serial biomarker for time based chemotherapy.
Keywords:Inflammation, CRP, Gynaecological malignancies, Treg, Teff
* Correspondence:[email protected]
1Department of Immunology, Vaccine and Infectious Diseases Laboratory,
Monash University, Melbourne, Australia
6Department of Immunology, Vaccine and Infectious Diseases Laboratory,
School of Medicine and Health Science, Monash University Alfred Hospital Campus, 99 Commercial Road, Prahran, VIC 3181, Australia
Full list of author information is available at the end of the article
Background
The link between inflammation and tumour develop-ment has been widely reported and recently, in an up-date to their seminal paper on the hallmarks of cancer, Hanahan and Weinberg refer to inflammation as an“ en-abling characteristic” for tumour development [1]. This link is well illustrated in gynaecological malignancies. The processes of ovulation and menstruation are asso-ciated with inflammation of the ovarian surface and en-dometrial epithelia [2,3]. During ovulation there is an increase in the macrophage population in the peri-follicular stroma of pre-ovulatory follicles [4,5]. These macrophages produce pro-inflammatory cytokines Inter-leukin (IL)-6, IL-1βand Tumour Necrosis Factor (TNF), [2]. Oestrogen in the endometrium also induces the up-regulation of these pro-inflammatory cytokines [6]. Over time, the cyclical process of epithelial damage and repair, involving inflammation, predisposes to neoplastic growth. Not only does inflammation play a role in tumourigenesis, it also facilitates disease progression. The tumour micro-environment is rich in inflammatory mediators produced by tumour cells and infiltrating leukocytes [7-9]. Specific-ally, IL-6 triggers tumour cells to produce matrix metal-loproteinase (MMP)-9 that promotes tumour growth by initiating angiogenesis [10].
C reactive protein (CRP), an acute phase protein produced by hepatocytes is the most widely used in-dicator of inflammation. The transcription of CRP is induced by IL-6 alone while the presence of either
IL-1β or TNF augments its production [11,12].
Gy-naecological cancer patients exhibit elevated levels of CRP, however these levels are not static. In a prelim-inary study of melanoma and ovarian cancer patients, serum CRP levels oscillated about a mean with a period-icity (λ) of 7 days [13]. The dynamic state of inflammation could indicate an underlying persistent but regulated anti-tumour immune response in the cancer patients, which is characterised by a cyclical repeating process of endogen-ous auto-vaccination, preceding suppression by regulatory cells.
In the past few decades the role of the adaptive im-mune system in driving anti-tumour immunity has been highlighted. Studies have shown a positive correlation be-tween the number of tumour infiltrating effector T cells and patient survival, as well as a negative correlation with Foxp3+CD25HiCD4+regulatory T cells [14,15]. Inflamma-tory cytokines and chemokines such as TNF and CCL22 facilitate the infiltration of T cells into the tumour micro-environment. When activated, effector T cells up-regulate CD25 and transiently express FoxP3 [16]. This enables them to expand and secrete pro-inflammatory cyto-kines. FoxP3+CD25HiCD4+ regulatory T cells, which ex-press high levels of the CCL22 receptor CCR4, also infiltrate tumour sites where they expand in response
to TNF and IL-2 produced by effector T cells, and subse-quently inhibit the immune response [17-19].
A lag between the expansion phase of effector T cell and regulatory T cell populations could account for the oscillations in CRP levels observed in cancer patients. If this is the case, oscillations in serum CRP levels could be used to target regulatory T cells for depletion during their expansion phase, by using chemotherapy. Pre-treatment results are reported herein on a prospective phase II trial of cyclophosphamide treatment for gynaecological malig-nancy, where repeated sampling was taken prior to trial initiation. This allowed the opportunity to assess the hy-pothesis that CRP levels oscillate, and may be indicative of effector and regulatory T cell proportions and that the lat-ter may also display predictable oscillations in patients with advanced gynaecological malignancies.
Methods
Trial design and patient details
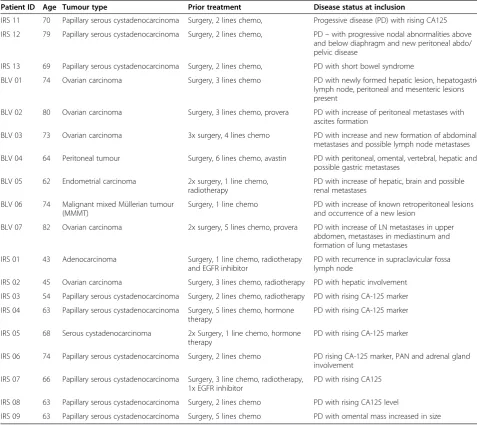
In total, 19 patients with gynaecological tumours were included in this bicentric phase II trial. The patients had end stage treatment-refractory gynaecological tumours, i.e. ovarian cancer (n = 5), papillary serous cystadeno-carcinoma (n = 9), adenocystadeno-carcinoma (n = 1), serous cysta-denocarcinoma (n = 1), endometrial carcinoma (n = 1), peritoneal tumour, (n = 1) or malignant mixed müllerian tumours (n = 1) and were recruited from the Royal Women’s Hospital, Melbourne, Australia (n = 12) and the University Hospital Leuven, Belgium (n = 7). Patient age ranged from 43–82 years (Table 1). The relative in-stitution’s research and ethics committees approved the study. From the time of recruitment, written consent was obtained from patients and 7 blood collections were performed over 12 days with daily and second daily bleeds, to assess the presence of a CRP cycle. Blood was collected in the morning on days 1, 3, 5, 6, 8, 10 and 12 with one exception who had blood collected on days 1, 2, 4, 5, 6, 8, 12. Following collection, the blood samples were immediately transported to the laboratory for pro-cessing with a maximum of 12 hours between blood col-lection and freezing of plasma. Based on predicted CRP cycling patterns [13], patients went on to received treat-ment with low-dose cyclophosphamide, 50 mg adminis-tered p.o. twice daily for 3 consecutive days. Blood was also collected from 7 healthy volunteers at the Alfred Hospital, Melbourne, Australia. Ethics was obtained from the institution’s research board and written consent was also obtained from the volunteers. The blood collection protocol for the healthy volunteers was similar to that of the cancer patients.
hsCRP plasma level measurements
separation tubes (Australian patients) by centrifugation. After removing cellular and protein debris, plasma was ali-quoted and stored at −80°C for later use. Hs CRP levels were determined by ELISA (Human High Sensitivity C-Reactive Protein ELISA kit; Cusabio Biotech Co., LTD, China) according to manufacturer’s instructions. For each treatment cycle, batch analysis was performed on all the necessary samples. To increase experimental precision, all samples were analysed in duplicate.
Peripheral blood mononuclear cells isolation
Mononuclear cells were obtained from peripheral whole blood collected in EDTA-coated tubes via Ficoll (Amersham Pharmacia Biotech, Sweden) density gradient centrifugation. The isolated PBMCs were cryopreserved using a freeze mixture containing 10% DMSO
(Sigma-Aldrich, Australia) and either 90% Foetal Calf Serum (Australian samples, JRH Bioscience) or human AB serum (Belgian samples, Sera Laboratories International) and stored in freezing containers (Nalgene) and finally in liquid nitrogen until use. For use, cells were thawed in a 37°C water-bath and quickly re-suspended using AIM-V media (Invitrogen) with 5% human serum (Sigma). PBMC samples were available at all time points from 10 patients in total.
Flow cytometric analysis
[image:3.595.56.534.100.525.2]To determine the frequency and phenotype of T cell populations in PBMCs of patients with gynaecological malignancies and age matched female, healthy volun-teers, multicolour flow cytometric analysis was performed using the following surface antibodies: anti-CD3 Q655 Table 1 Patient summary
Patient ID Age Tumour type Prior treatment Disease status at inclusion
IRS 11 70 Papillary serous cystadenocarcinoma Surgery, 2 lines chemo, Progessive disease (PD) with rising CA125
IRS 12 79 Papillary serous cystadenocarcinoma Surgery, 2 lines chemo, PD–with progressive nodal abnormalities above and below diaphragm and new peritoneal abdo/ pelvic disease
IRS 13 69 Papillary serous cystadenocarcinoma Surgery, 2 lines chemo, PD with short bowel syndrome
BLV 01 74 Ovarian carcinoma Surgery, 3 lines chemo PD with newly formed hepatic lesion, hepatogastric, lymph node, peritoneal and mesenteric lesions present
BLV 02 80 Ovarian carcinoma Surgery, 3 lines chemo, provera PD with increase of peritoneal metastases with ascites formation
BLV 03 73 Ovarian carcinoma 3x surgery, 4 lines chemo PD with increase and new formation of abdominal metastases and possible lymph node metastases
BLV 04 64 Peritoneal tumour Surgery, 6 lines chemo, avastin PD with peritoneal, omental, vertebral, hepatic and possible gastric metastases
BLV 05 62 Endometrial carcinoma 2x surgery, 1 line chemo, radiotherapy
PD with increase of hepatic, brain and possible renal metastases
BLV 06 74 Malignant mixed Müllerian tumour (MMMT)
Surgery, 1 line chemo PD with increase of known retroperitoneal lesions and occurrence of a new lesion
BLV 07 82 Ovarian carcinoma 2x surgery, 5 lines chemo, provera PD with increase of LN metastases in upper abdomen, metastases in mediastinum and formation of lung metastases
IRS 01 43 Adenocarcinoma Surgery, 1 line chemo, radiotherapy
and EGFR inhibitor
PD with recurrence in supraclavicular fossa lymph node
IRS 02 45 Ovarian carcinoma Surgery, 3 lines chemo, radiotherapy PD with hepatic involvement
IRS 03 54 Papillary serous cystadenocarcinoma Surgery, 2 lines chemo, radiotherapy PD with rising CA-125 marker
IRS 04 63 Papillary serous cystadenocarcinoma Surgery, 5 lines chemo, hormone therapy
PD with rising CA-125 marker
IRS 05 68 Serous cystadenocarcinoma 2x Surgery, 1 line chemo, hormone therapy
PD with rising CA-125 marker
IRS 06 74 Papillary serous cystadenocarcinoma Surgery, 2 lines chemo PD rising CA-125 marker, PAN and adrenal gland involvement
IRS 07 66 Papillary serous cystadenocarcinoma Surgery, 3 line chemo, radiotherapy, 1x EGFR inhibitor
PD with rising CA125
IRS 08 63 Papillary serous cystadenocarcinoma Surgery, 2 lines chemo PD with rising CA125 level
(Invitrogen), CD4 AF700 (BD Pharmingen), anti-CD25 PE (BD Pharmingen), and anti-CD127 Biotin (BD Pharmingen). Following primary staining, a fixable dead cell dye (Invitrogen) was also used to distinguish between dead and live cells. Intracellular levels of FoxP3 were de-termined following fixation and permeabilization using a fixation/permeabilization buffer kit (eBioscience) then staining with anti-FoxP3 PercpCy5.5 (eBioscience). Flow cytometry data was acquired on a Becton Dickinson LSR II using FACSDiva software, collecting a mini-mum of 100,000 events per sample. Fluorescence minus one (FMO) and isotype matched antibodies were used as controls with all samples. Data were analysed using Flowjo software (TreeStar).
Serum cytokine analysis
To assess serum IL-6 concentration, frozen sera from all patients were thawed over night at 4°C. BD™Cytometric bead array was used for IL-6 (BD) detection in 50 μl of undiluted serum following the instructions pre-scribed by the manufacturer. Samples were then ac-quired by Flow cytometry on a Becton Dickinson LSR II using FACSDiva software, collecting a maximum of 5,000 events per sample. Data were analysed using Flowjo software (TreeStar).
Statistics
To determine the respective periodicity of serum CRP concentration, and Teff and Treg frequencies periodo-gram analysis was used. The null hypothesis was that there was no consistent period to the measurements, which implies no peaks in the mean periodogram be-yond noise. Individual subjects’ periodograms were cal-culated and standardized to have sum of squares equal to 1, then averaged pointwise. Under the null hypothesis, the population pointwise mean periodogram is a hori-zontal line at 1. The pointwise, lower one-sided 95% confidence bound for the mean periodogram was calcu-lated by the bias-corrected bootstrap method. This lower confidence bound was then compared to the null mark at 1. Exceeding 1 at a peak would be necessary to sug-gest a significant peak.
The Pearson correlation coefficient between Teff first differences and CRP first differences was estimated for each subject, and the Wilcoxon signed rank test was used to test whether the mean correlation coefficient was non-zero. The same procedure was performed to test for a relationship between Treg and CRP, Tregs and Teffs, and CRP and IL-6. The first difference is defined as the change in value from one time point to the next.
Coefficients of variation in the frequencies of Tregsand Teffsamong 7 time points over a period of 12 days were determined by initially calculating the standard devi-ation, which was then expressed as percentages of the
mean frequency of the respective population over the 7 time points. Statistical significances between mean values of Treg and Teff frequencies as well as coeffi-cients of variation for both populations were calculated using non-parametric (Wilcoxon Mann Whitney) tests. P values < 0.05 were considered significant. All mean values were presented ± the standard error from the mean (SEM).
Results
CRP levels, and Tregand Tefffrequencies did not appear
to be oscillatory
The oscillation in serum CRP concentration with a period of 7 days has previously been reported in 15 late-stage advanced melanoma and 4 late-late-stage advanced ovarian cancer patients [13]. In a cohort of 19 patients with gynaecological malignancies, we investigated the periodicity of serum CRP concentration oscillations over time (raw data provided in Additional file 1: Table S1). In the individual patients, serum CRP concentrations ap-peared to fluctuate over time (Figure 1A), however when a mean standard periodogram analysis was carried out for the pooled patient cohort at every time point, while small peaks were apparent in the periodograms at 3.6 days and 4.6 days, neither was significant (Figure 1A). In a smaller cohort of 10 patients from whom PBMCs were collected, the periodicity of peripheral blood Treg and Tefffrequencies was also investigated. Tregswere defined as expressing high levels of CD25 and FoxP3, which we confirmed expressed low levels of CD127, while Teffs were defined as expressing intermediate levels of CD25 (Additional file 2: Figure S1) as per previous studies [20,21]. Similar to serum CRP concentration, both fre-quencies appeared to fluctuate over time, in some indi-vidual patients (Figure 1B and C). In the pooled cohort, mean standard periodogram analysis revealed small peaks for Tregfrequencies at 4.8 days and for Tefffrequencies at 3.6 and 4.6 days, but none was significant (Figure 1B and C) statistically at the p = 0.05 level.
Serum CRP concentrations were not correlated with Treg
or Tefffrequencies
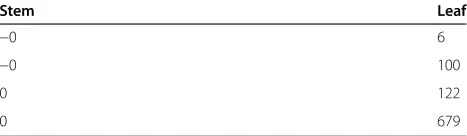
concentrations (p = 0.03; Table 2). However, there ap-peared to be no apparent relationship between serum CRP concentration, and Tregor Tefffrequencies (Table 3 and Table 4). Tregs and Teffs frequencies on the other hand, correlated significantly with each other (p = 0.01; Table 5).
0 1 2 3 4 5 6 7 8 9 10 11 12 13
0 1 2 3
% Tregs of CD4
+ T cells
Days
0 1 2 3 4 5 6 7 8 9 10 11 12 13
0 5 10 15
0 10 20 30 40
% Teffs of CD4
+ T cells
Days
C
Left Y axis Right Y axis
5 10 15
0.94
1.00
1.06
5 10 15
0.96
0.98
1.00 1.02
Mean standard periodogram
Mean standard periodogram
Period (Days)
Period (Days) Tregs
Teffs
Mean
Pointwise one-sided 95% CI Null
Mean
Pointwise one-sided 95% CI Null
B
0 1 2 3 4 5 6 7 8 9 10 11 12 13
0 2 4 6 8
0 20 40 60 80 100
CRP concentration ng/ml
A
Days
Left Y axis Right Y axis
10 15
Period (Days) CRP
Mean
Pointwise one-sided 95% CI Null
5
0.96
0.98
1.00 1.02
1.04
[image:5.595.61.538.87.528.2]Mean standard periodogram
[image:5.595.305.540.658.716.2]Figure 1The periodicity of serum CRP concentration, and Tregand Tefffrequency.Patients with gynaecological malignancies had blood collected 7 times over a period of 12 days. Serum was collected from 19 patients. While in 10 of the patients, PBMCs were also isolated. CRP levels in sera were determined along with the frequencies of Tregs and Teff within CD4+T cells from PBMCs. The values forA, serum CRP concentration (n = 19, solid lines use the left Y axis while dashed lines use the right Y axis) (mg/L),BTreg andC, Teff frequencies (%, n = 10, solid lines use the left Y axis while dashed lines use the right Y axis) over time (days) were plotted in spaghetti plots. The periodicity forA, CRP concentration,B, Treg andC, Teff frequencies were assessed using the null hypothesis, that the population pointwise mean periodogram was a horizontal line at 1 (dotted line). The pointwise lower one-sided 95% confidence bound (dashed line) needed to exceed the null mark (dotted line) to suggest a significant peak.
Table 2 Correlation coefficients of CRP vs IL-6
Stem Leaf
−0 32210
0 11113344
0 5579
Disease state in the cancer patients did not increase the
variation of Tregor Tefffrequencies within CD4
+
T cells over time
There did not appear to be a correlative linear rela-tionship between inflammation as shown by serum CRP concentration and peripheral blood Tregs and Teffs fre-quencies. We investigated whether the disease state in patients may still influence the magnitude of variation in the frequencies of Tregsand Teffsover time. We initially compared the mean frequencies of Tregsand Teffswithin CD4+ T cells between 10 cancer patients and 7, age and sex matched, healthy donors. Although the mean fre-quency of Teffsonly, was significantly lower in cancer pa-tients (8% ± 2%) than healthy donors (11% ± 0.6%, p = 0.005; Figure 2A), the mean ratio of Teffs to Tregs was not significantly different. We then assessed whether can-cer patients, who have raised inflammation, evident by higher CRP levels relative to healthy individuals [13], ex-hibited greater variation in the frequencies of either Tregs or Teffsover time. The variation in Tregand Teff frequen-cies from 7 blood collections over a 12-day period was compared between the 7 healthy volunteers and 10 cancer patients. Both cancer patients and healthy volunteers had a similar mean coefficient of variation in Treg frequency (26% ± 5% and 29% ± 3% respectively, Figure 2B). The mean coefficient of variation in Teffsfrequency was signifi-cantly lower in cancer patients (13% ± 1%, p = 0.002) com-pared to healthy volunteers (22% ± 2%, Figure 2B). While the mean coefficient of variation in the ratio of Teffs to Tregs was lower in cancer patients compared to healthy volunteers (21.7% ± 3.3% and 27.8% ± 2.2%, Figure 2B), this was not significant.
Discussion
The dynamic nature of the adaptive immune responses has been described in two ways. Firstly, there are diurnal
fluctuations, regulated by the circadian clock exemplified in CD4 T cells by the rhythmic expression of genes that control cytokine secretion and cell function [22]. Sec-ondly, antigen dependent fluctuations occur during acute infections and the kinetics of the immune response are controlled by a system of positive and negative feedback mechanisms designed to limit the immune response when pathogenic insults are resolved. In chronic diseases such as cancer, antigenic clearance does not occur and the per-sistent antigen exposure results in a constant state of im-mune activation. The tumour however, limits imim-mune activation by secreting immune inhibitory cytokines such as IL-10, and tumour growth factor (TGF)-β as well as inducing regulatory cell populations including myeloid derived suppressor cells (MDSCs) and regulatory T cells [18,23-25]. Although intratumoural immune cells are skewed towards immune inhibition, there may still exist a homeostatic balance that needs to be maintained in the periphery of cancer patients in which an oscillating se-quence of immune activation is followed by negative feed-back immune suppression [13]. The study herein however, showed that CRP concentrations in all the patients did not appear to oscillate periodically nor did the concentra-tion of CRP correlate significantly with Treg or Teff fre-quencies. Therefore, CRP may not be a practical useful surrogate marker for either cell population. In a study of 12 patients with melanoma, less than 50% showed possible time dependent CRP concentration profiles [26]. The two data sets available therefore suggest that inflammation in cancer patients may not consistently follow an oscillatory, sinusoidal (or other mathematical) pattern with a constant period or amplitude. This may be because any such model oversimplifies the inflammatory process, and correlations are easily disrupted by a number of potential additional
in vivoco-parameters or process variations. Multiple fac-tors influence the levels of cytokines that regulate inflam-mation. One such factor is the tumour growth. In patients with papillary thyroid cancer CD4+T cell frequencies cor-relate with tumour size while Treg frequencies correl-ate with lymph node metastasis [27]. Such variables may hence significantly influence the magnitude of T cell ef-fector and suppressor frequency and function.
[image:6.595.302.541.98.169.2]In our study, neither the coefficient of variation of both Tregsand Teffsnor that of the ratio of Teff to Tregs, Table 4 Correlation coefficients of CRP vs Teffs
Stem Leaf
−0 6
−0 100
0 122
0 679
null hypothesis: correlation coefficient mean = 0. V = 42 p = 0.16 (Wilcoxon signed rank test).
Table 5 Correlation coefficients of Tregs vs Teffs
Stem Leaf
−0 32
0 44
0 56889
1 0
[image:6.595.58.291.101.154.2]null hypothesis: correlation coefficient mean = 0. V = 52 p = 0.01 (Wilcoxon signed rank test).
Table 3 Correlation coefficients of CRP vs Tregs
Stem Leaf
−0 320
0 124
0 5788
[image:6.595.57.291.648.716.2]in cancer patients was greater than that of healthy do-nors suggesting that in the periphery the fluctuation of Treg within the CD4 population was not affected by the presence of the tumour. The coefficient of variation of Teffs was lower in cancer patients compared to healthy donors, which may have been due to immune suppres-sion. Consistent with this suggestion, the frequency of Teffs was significantly lower in the patients than in healthy donors. Although Tregfrequencies in the periph-ery were not significantly increased, other cell subsets such as MDSCs may also facilitate immune suppression. Pro-inflammatory mediators have also been suggested to promote accumulation of MDSC in cancer patients’ per-ipheral blood [28]. Within the tumour microenviron-ment, the fluxes between Treg and Teff populations may be more evident.
Although changes in the frequencies of conventional Treg and Teff did not correlate with inflammation, it is still possible that minor subsets within each pheno-type (Treg or Teff) or their specific function over time, may correlate. Indeed, effector and regulatory T cells
[image:7.595.59.539.91.398.2]are heterogeneous populations of cells. Further break-ing down these populations based on phenotype and function may also show greater variation between pa-tients and healthy donors. For example, Treg popula-tions with enhanced suppressive function due to elevated expression of inhibitory receptors such as glucocorticoid induced tumour necrosis factor receptor (GITR) and cyto-toxic T-lymphocyte antigen (CTLA)-4 as well as increased production of suppressive factors such as adenosine and cytokines TGF-βand IL-10, have been reported to be ele-vated in cancer patients [29-31]. Similarly, effector T cells can be broken down into different functional phenotypes such as IL-17 secreting and type-1 interferon secreting Teffs. Type-1 interferon secreting Teffs promote prolifera-tion of cytotoxic CD8 T cells, which contribute towards an anti-tumour effect [32-35]. It cannot therefore be ex-cluded that the frequencies of some of these functional subsets, as well as CD8 T cells, may be subject to regula-tion by inflammatory factors, even when the results pre-sented herein show that total Tregand Teffpopulations are not correlated to inflammatory status as reflected by CRP Figure 2Variation in Tregand Tefffrequencies. A, The mean frequency from 7 readings of Tregsand Teffsover a period of 12 days was
levels in blood. Mathematical models that aim to predict the balance that exists between immune activation and regulation within accessible blood samples, will therefore benefit from additionally taking into account the following variables: i) the effect of diurnal variation ii) the tumour growth rate iii) the heterogeneity present within both regulatory and effector T cell populations.
In conclusion, in our sample of patients with gynaeco-logical malignancies, CRP concentrations do not oscillate in a consistent predictable manner, and do not correlate either positively or negatively with conventional Treg or Teff subsets. Therefore, there is no evidence to suggest that CRP can reliably be used across cancer patients as a surrogate, time-sensitive and most importantly, predict-ive marker, to reflect circulating effector or regulatory T cell frequencies, as previously suggested [13]. Time based therapy founded on modelling a consistent cyclical pattern of inflammation using serum CRP concentration as a pre-dictive marker of regulatory T cell expansion may not be possible. However, we cannot exclude that further in-vestigating the kinetics of inflammation in cancer patients, perhaps by taking more frequent blood samples or else by taking into consideration multiple inflammatory and immune-regulatory parameters, the progressive nature of immune suppression, as well as the heterogeneity of ef-fector and regulatory T cell populations could all help in modelling more complex, and potentially predictive, equations.
Additional files
Additional file 1: Table S1a.CRP raw data. Table S1b.Treg and Teff frequency raw data.
Additional file 2: Figure S1.Gating strategy for Tregsand Teffs. Peripheral blood mononuclear cells were stained for the following markers CD3, CD4, CD25 and FoxP3. A, Teffs(dashed line) were defined as CD3+CD4+CD25intermediatewhile Tregs(dotted line) were CD3+CD25HiFoxP3+. B, FoxP3 and CD127 expression on Tregs (solid line) and Teffs (dashed line).
Abbreviations
Tregs:Regulatory T cells; Teffs: Effector T cells; CRP: C reactive protein.
Competing interests
The authors declare that they have no competing interests.
Authors’contributions
FA, MQ and MP contributed to the design of the study and FA and MQ organised patient recruitment. MM, ST and AV conducted experiments, while MM, MP and ST analysed data and drafted the manuscript. HK, BT and BN carried out statistical analysis of data. All authors proofread, edited and approved the manuscript.
Acknowledgements
The authors would like to acknowledge the nurses who collected blood samples and kept patient records for the study as well as the patients and healthy volunteers who participated in this study. We would like to thank Brad Efron for statistical advice along with Alison Hamlett and Karen Scalzo Inguanti for assisting with experimental setup. We would also like to thank Anticancer Fund for scientific and financial support.
Author details 1
Department of Immunology, Vaccine and Infectious Diseases Laboratory, Monash University, Melbourne, Australia.2Division of Gynaecologic Oncology, Department of Oncology, KU Leuven, Leuven, Belgium. 3Department of Statistics and Department of Health Research and Policy,
Stanford University, Stanford, CA, USA.4Division of Haematology and Oncology, Centre for Clinical Sciences Research, Stanford University, Stanford, CA, USA.5Womens Cancer Research Centre, Royal Women’s Hospital, Melbourne, Australia.6Department of Immunology, Vaccine and Infectious Diseases Laboratory, School of Medicine and Health Science, Monash University Alfred Hospital Campus, 99 Commercial Road, Prahran, VIC 3181, Australia.
Received: 29 July 2013 Accepted: 16 June 2014 Published: 23 June 2014
References
1. Hanahan D, Weinberg RA:Hallmarks of cancer: the next generation. Cell2011,144:646–674.
2. Maccio A, Madeddu C:Inflammation and ovarian cancer.Cytokine2012, 58:133–147.
3. Wallace AE, Gibson DA, Saunders PT, Jabbour HN:Inflammatory events in endometrial adenocarcinoma.J Endocrinol2010,206:141–157. 4. Brannstrom M, Pascoe V, Norman RJ, McClure N:Localization of leukocyte
subsets in the follicle wall and in the corpus luteum throughout the human menstrual cycle.Fertil Steril1994,61:488–495.
5. Dahm-Kahler P, Ghahremani M, Lind AK, Sundfeldt K, Brannstrom M: Monocyte chemotactic protein-1 (MCP-1), its receptor, and macrophages in the perifollicular stroma during the human ovulatory process.Fertil Steril2009,91:231–239.
6. He YY, Cai B, Yang YX, Liu XL, Wan XP:Estrogenic G protein-coupled receptor 30 signaling is involved in regulation of endometrial carcinoma by promoting proliferation, invasion potential, and interleukin-6 secretion via the MEK/ERK mitogen-activated protein kinase pathway. Cancer Sci2009,100:1051–1061.
7. Charles KA, Kulbe H, Soper R, Escorcio-Correia M, Lawrence T, Schultheis A, Chakravarty P, Thompson RG, Kollias G, Smyth JF, Balkwill FR, Hagemann T: The tumor-promoting actions of TNF-alpha involve TNFR1 and IL-17 in ovarian cancer in mice and humans.J Clin Invest2009,119:3011–3023. 8. Kulbe H, Chakravarty P, Leinster DA, Charles KA, Kwong J, Thompson RG, Coward JI, Schioppa T, Robinson SC, Gallagher WM, Galletta L, Australian Ovarian Cancer Study Group, Salako MA, Smyth JF, Hagemann T, Brennan DJ, Bowtell DD, Balkwill FR:A dynamic inflammatory cytokine network in the human ovarian cancer microenvironment.Cancer Res2012,72:66–75. 9. Burke F, Relf M, Negus R, Balkwill F:A cytokine profile of normal and
malignant ovary.Cytokine1996,8:578–585.
10. Rabinovich A, Medina L, Piura B, Segal S, Huleihel M:Regulation of ovarian carcinoma SKOV-3 cell proliferation and secretion of MMPs by autocrine IL-6.Anticancer Res2007,27:267–272.
11. Young DP, Kushner I, Samols D:Binding of C/EBPbeta to the C-reactive protein (CRP) promoter in Hep3B cells is associated with transcription of CRP mRNA.J Immunol2008,181:2420–2427.
12. Yoshizaki K:Pathogenic role of IL-6 combined with TNF-alpha or IL-1 in the induction of acute phase proteins SAA and CRP in chronic inflammatory diseases.Adv Exp Med Biol2011,691:141–150.
13. Coventry BJ, Ashdown ML, Quinn MA, Markovic SN, Yatomi-Clarke SL, Robinson AP:CRP identifies homeostatic immune oscillations in cancer patients: a potential treatment targeting tool?J Transl Med2009,7:102.
14. Li J, Mo HY, Xiong G, Zhang L, He J, Huang ZF, Liu ZW, Chen QY, Du ZM, Zheng LM, Qian CN, Zeng YX:Tumor microenvironment MIF directs the accumulation of IL-17-producing tumor-infiltrating lymphocytes and predicts favorable survival in nasopharyngeal carcinoma patients.J Biol Chem2012,287:35484–35495.
15. Katz SC, Bamboat ZM, Maker AV, Shia J, Pillarisetty VG, Yopp AC, Hedvat CV, Gonen M, Jarnagin WR, Fong Y, D’Angelica MI, DeMatteo RP:Regulatory T Cell infiltration predicts outcome following resection of colorectal cancer liver metastases.Ann Surg Oncol2013,20:946–955.
17. Miller AM, Lundberg K, Ozenci V, Banham AH, Hellstrom M, Egevad L, Pisa P: CD4 + CD25high T cells are enriched in the tumor and peripheral blood of prostate cancer patients.J Immunol2006,177:7398–7405.
18. Curiel TJ, Coukos G, Zou L, Alvarez X, Cheng P, Mottram P, Evdemon-Hogan M, Conejo-Garcia JR, Zhang L, Burow M, Zhu Y, Wei S, Kryczek I, Daniel B, Gordon A, Myers L, Lackner A, Disis ML, Knutson KL, Chen L, Zou W: Specific recruitment of regulatory T cells in ovarian carcinoma fosters immune privilege and predicts reduced survival.Nat Med 2004,10:942–949.
19. Hamano R, Huang J, Yoshimura T, Oppenheim JJ, Chen X:TNF optimally activatives regulatory T cells by inducing TNF receptor superfamily members TNFR2, 4-1BB and OX40.Eur J Immunol2011, 41:2010–2020.
20. Seddiki N, Santner-Nanan B, Martinson J, Zaunders J, Sasson S, Landay A, Solomon M, Selby W, Alexander SI, Nanan R, Kelleher A, Fazekas de St Groth B, Kelleher A, Fazekas-de-St-Groth B:Expression of interleukin (IL)-2 and IL-7 receptors discriminates between human regulatory and activated T cells.J Exp Med2006,203:1693–1700.
21. Triplett TA, Curti BD, Bonafede PR, Miller WL, Walker EB, Weinberg AD: Defining a functionally distinct subset of human memory CD4+ T cells that are CD25POS and FOXP3NEG.Eur J Immunol2012, 42:1893–1905.
22. Bollinger T, Leutz A, Leliavski A, Skrum L, Kovac J, Bonacina L, Benedict C, Lange T, Westermann J, Oster H, Solbach W:Circadian clocks in mouse and human CD4+ T cells.PLoS One2011,6:e29801.
23. Mustea A, Konsgen D, Braicu EI, Pirvulescu C, Sun P, Sofroni D, Lichtenegger W, Sehouli J:Expression of IL-10 in patients with ovarian carcinoma. Anticancer Res2006,26:1715–1718.
24. Hirashima Y, Kobayashi H, Suzuki M, Tanaka Y, Kanayama N, Terao T: Transforming growth factor-beta1 produced by ovarian cancer cell line HRA stimulates attachment and invasion through an up-regulation of plasminogen activator inhibitor type-1 in human peritoneal mesothelial cells.J Biol Chem2003,278:26793–26802.
25. Lechner MG, Megiel C, Russell SM, Bingham B, Arger N, Woo T, Epstein AL: Functional characterization of human Cd33+ and Cd11b + myeloid-derived suppressor cell subsets induced from peripheral blood mononuclear cells co-cultured with a diverse set of human tumor cell lines.J Transl Med2011,9:90.
26. Leontovich AA, Dronca RS, Suman VJ, Ashdown ML, Nevala WK, Thompson MA, Robinson A, Kottschade LA, Kaur JS, McWilliams RR, Ivanov LV, Croghan GA, Markovic SN:Fluctuation of systemic immunity in melanoma and implications for timing of therapy.Front Biosci (Elite Ed) 2012,4:958–975.
27. French JD, Weber ZJ, Fretwell DL, Said S, Klopper JP, Haugen BR: Tumor-associated lymphocytes and increased FoxP3+ regulatory T cell frequency correlate with more aggressive papillary thyroid cancer.J Clin Endocrinol Metab2010,95:2325–2333.
28. Ostrand-Rosenberg S, Sinha P:Myeloid-derived suppressor cells: linking inflammation and cancer.J Immunol2009,182:4499–4506.
29. Park HJ, Kusnadi A, Lee EJ, Kim WW, Cho BC, Lee IJ, Seong J, Ha SJ: Tumor-infiltrating regulatory T cells delineated by upregulation of PD-1 and inhibitory receptors.Cell Immunol2012,278:76–83.
30. Schuler PJ, Schilling B, Harasymczuk M, Hoffmann TK, Johnson J, Lang S, Whiteside TL:Phenotypic and functional characteristics of CD4+ CD39+ FOXP3+ and CD4+ CD39+ FOXP3neg T-cell subsets in cancer patients. Eur J Immunol2012,42:1876–1885.
31. Chen ZF, Xu Q, Ding JB, Zhang Y, Du R, Ding Y:CD4 + CD25 + Foxp3+ Treg and TGF-beta play important roles in pathogenesis of Uygur cervical carcinoma.Eur J Gynaecol Oncol2012,33:502–507.
32. Chiba S, Baghdadi M, Akiba H, Yoshiyama H, Kinoshita I, Dosaka-Akita H, Fujioka Y, Ohba Y, Gorman JV, Colgan JD, Hirashima M, Uede T, Takaoka A, Yagita H, Jinushi M:Tumor-infiltrating DCs suppress nucleic acid-mediated innate immune responses through interactions between the receptor TIM-3 and the alarmin HMGB1.Nat Immunol2012, 13:832–842.
33. Nunez S, Saez JJ, Fernandez D, Flores-Santibanez F, Alvarez K, Tejon G, Ruiz P, Maldonado P, Hidalgo Y, Manriquez V, Bono MR, Rosemblatt M, Sauma D: Th17 cells contribute to anti-tumor immunity and promote the recruitment of th1 cells to the tumor.Immunology2013,139:61–71.
34. Gao Y, Whitaker-Dowling P, Griffin JA, Bergman I:Treatment with targeted vesicular stomatitis virus generates therapeutic multifunctional anti-tumor memory CD4 T cells.Cancer Gene Ther2012,19:282–291.
35. Quezada SA, Simpson TR, Peggs KS, Merghoub T, Vider J, Fan X, Blasberg R, Yagita H, Muranski P, Antony PA, Restifo NP, Allison JP:Tumor-reactive CD4(+) T cells develop cytotoxic activity and eradicate large established melanoma after transfer into lymphopenic hosts.J Exp Med2010,207:637–650.
doi:10.1186/1479-5876-12-179
Cite this article as:Madondoet al.:Variability in CRP, regulatory T cells and effector T cells over time in gynaecological cancer patients: a study of potential oscillatory behaviour and correlations.Journal of
Translational Medicine201412:179.
Submit your next manuscript to BioMed Central and take full advantage of:
• Convenient online submission
• Thorough peer review
• No space constraints or color figure charges
• Immediate publication on acceptance
• Inclusion in PubMed, CAS, Scopus and Google Scholar
• Research which is freely available for redistribution