Rochester Institute of Technology
RIT Scholar Works
Theses
Thesis/Dissertation Collections
5-1-1998
Imagesetter output resolution in newspaper color
image reproduction
Sabine Süsstrunk
Follow this and additional works at:
http://scholarworks.rit.edu/theses
This Thesis is brought to you for free and open access by the Thesis/Dissertation Collections at RIT Scholar Works. It has been accepted for inclusion
in Theses by an authorized administrator of RIT Scholar Works. For more information, please contact
ritscholarworks@rit.edu.
Recommended Citation
Imagesetter Output Resolution in Newspaper
Color Image Reproduction
by
Sabine
Siisstrunk
A thesis
submittedin
partialfulfillment of
the
requirements
for
the
degree of
Master
of
Science in
the
School
of
Printing
Management
andSciences
in
the
College
of
Imaging
Arts
andSciences of
the
Rochester Institute
of
Technology
March 1993
School of Printing Management and Sciences
Rochester Institute of Technology
Rochester, New York
Certificate of
Approval
Master's Thesis
This is to certify that the Master's Thesis of
Sabine Siisstrunk
With a major in Electronic Publishing
has been approved by the Thesis Committee as satisfactory
for the thesis requirement for the Master of Science degree
at the convocation of
Thesis Committee:
Frank Cost
Thesis Advisor
Marie Freckleton
Graduate
Program
Coordinator
Permission
to
Reproduce
Title
ofthe
Thesis:
Imagesetter Output Resolution in Newspaper Color Image
Reproduction.
I,
Sabine
Siisstrunk,
hereby
grant permissionto the
Wallace
Memorial
Library
ofRIT
to
reproducemy
thesis
in
whole orin
part.Any
reproduction will not
be for
commercial use or profit.Acknowledgments
The
author wouldlike
to
acknowledgethe
following
individuals for
their
assistance.
Each
contributionwasinvaluable
for
the
productionand completion ofthis thesis.
Mr. J. A.
Stephen
Viggiano
ofRIT
Research
Corporation for
providing
usablefile
formats
andfor
helping
withthe
evaluation ofthe
resolutiontargets.Mr.
Jim Hamilton
ofLinotype-Hell
Company
for
the
output ofthe
separations.
Professor
Frank
Cost
ofthe
School
ofPrinting
Management
andSciences
atRIT
for
providing
the
resolutiontarget
file.
Also,
his
encouragementalong
the
way
wasvery
much appreciated.Mr. Alex
Letko for
stripping
andprinting
the test
matrix.Mr.
Mike
Stokes
ofApple
Computers for
helping
to
setup
the
pairedcomparison experiment and
for explaining
the
intricacies
of statistical analysis.Professor Kenneth Hoffmann
ofthe
Printing
Department
ofThe National
Institute
ofthe
Deaf
atRIT
for
proof reading.On
a more personalnote,
many
thanks
to
Dr.
Marianne Schonenberger
Tomamichel
andProfessor
Franz Tomamichel. Without their
encouragement andhelp,
the
authorwould neverhave been
in
a positionto
writethis
thesis.
Table
ofContents
List
ofTables
viiList
ofFigures
xAbstract
xiiChapter
1.
Introduction
1
1.1
The
Problem
1
1.2
Its Background
andPresent
Significance
2
1.3
The
Reason
for Interest in
the
Study
3
Endnotes for Chapter
1
5
2.
Theoretical Background
6
2.1
Electronic Halftone
Reproduction
6
2.1.1
Input
6
2.1.2
The
Histogram
8
2.1.3
Output
12
2.2
Statistically
Valid
Methods
for
Visual Evaluation
ofQuality
....16
Endnotes
for
Chapter 2
20
3.
Hypotheses
22
4.
Methodology
23
4.1
The
Choice
ofImagesetter Resolutions
for
the
Study
23
4.2
The
Choice
ofImages for
the
Study
24
4.3
The
Design
ofthe
Test
Matrix
26
4.4
The
Preparation
ofthe
Images for Output
27
4.5
The
Output
ofthe
Separations
30
4.6
Proofing,
Page
Assembly,
andPlate
Making
32
4.7
Printing
33
4.8
Evaluation
ofResolution Targets
andDot Shapes
34
4.9
Visual Evaluation
35
Endnotes
for Chapter
4
39
5.
Results
41
5.1
Physical Evaluation
ofthe
Test
Matrix
41
5.1.1
Fresnel Zone Plates
41
5.1.2
Dot
Shapes
43
5.2
Visual
Evaluation
ofthe Test Matrix
45
5.2.1
Analysis
of
the
Observers'Results
45
5.2.2
Evaluation
of
the
Observer
Survey
51
5.2.3
Results of
the
Statistical Analysis
55
5.2.3.1
Woman
55
5.2.3.2
Street Cafe
56
5.2.3.3
Fruit Basket
56
5.2.3.4
Bicycle
56
5.2.3.5
All
Images
Combined
57
Endnotes
for
Chapter 5
58
6.
Summary
andConclusion
59
Appendices
Appendix
A
-Test Matrix
Design
64
Appendix
B
-Linotype-Hell
Recommendations for Screen Frequencies
and
Screen Angles
66
Appendix C
-Printed
Test Matrix
68
Appendix
D
-Observer
Matrix
69
Appendix
E
-Observer Results
Matrix
71
Appendix
F
-Observer
Survey
73
Appendix G
-Dot
Shapes
on
Proofs
andPress Sheet
75
Appendix
H
-Observer Results
77
Appendix
I
-Frequency
Matrices
82
Appendix
J
-Proportion Matrices
88
Appendix
K
-z-Score
Matrices
and z-ScoreScales
94
Appendix L
- z-Scales105
List
of
Tables
Table
Page
1
-Number
of
grey levels
for
each separationdepending
onthe
output resolution14
2
-Image
characteristicsofthe
four images
usedin
the
study
25
3
-Aim
dot
percentages and
corresponding
brightness
valuesfor
negativeseparations29
4
-Equipment
used
to
outputthe
separationsfor
the test
matrix31
5
-Plate
exposure
32
6
-Equipment
used
for printing
the
test
matrix33
7
-Frequency
response matrix ofthe
image Woman
(total
of32
observers)
46
8
-Frequency
response matrix of allresponses(all
image
types
combined)
for
the total
group
ofobservers46
9
-Proportion
matrixof allfour images
combined(total group
ofobservers)
47
10
-z-Score matrix of all
four
images
combined(total group
ofobservers)
49
11
-Linotype-Hell
recommendations
for
screenfrequencies
and screenangles(HQS)
for
Linotronic 530/500
withPostScript
RIP
30
andPostScript
software52.3 N3
67
12
-Observer
matrix70
13
-Observer
results
Woman
78
14
-Observer
results
Street Cafe
79
15
-Observer
results
Fruit
basket
80
16
-Observer
results
Bicycle
81
17
-Frequency
matrixWoman
83
18
-Frequency
matrixStreet Cafe
84
19
-Frequency
matrixFruit
basket
85
20
-Frequency
matrixBicycle
86
21
-Frequency
matrix of allfour
images
87
22
-Proportion
matrixWoman
89
23
-Proportion
matrix
Street
Cafe
90
24
-Proportion
matrix
Fruit
basket
91
25
-Proportion
matrix
Bicycle
92
26
-Proportion
matrixof all
four images
93
27
- z-ScorematrixWoman
95
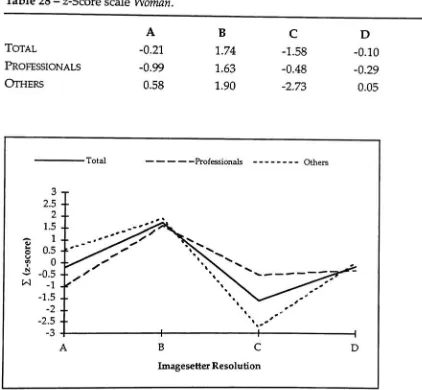
28
-z-Score scale
Woman
96
29
- z-Score matrixStreet Cafe
97
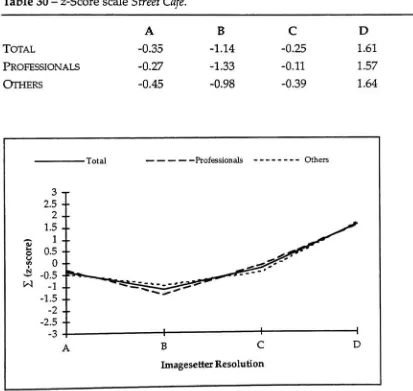
30
- z-Score scaleStreet
Cafe
98
31
- z-Score matrixFruit
basket
99
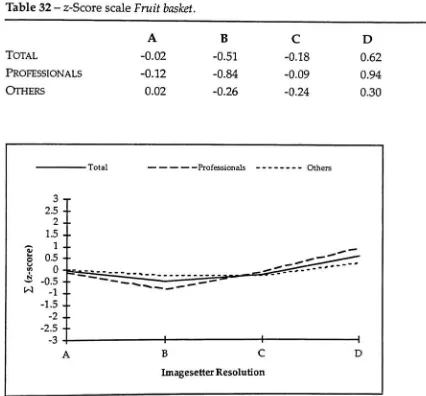
32
- z-Score scaleFruit
basket
100
33
-z-Scorematrix
Bicycle
101
34
-z-Score scale
Bicycle
102
35
- z-Score matrix of allfour
images
103
36
- z-Score scale ofallfour
images
104
37
-z-Scale with
95
percent confidenceindicators Woman
106
38
- z-Scale with95
percentconfidence
indicators
Street Cafe
110
39
- z-Scalewith
95
percent confidenceindicators Fruit
basket
114
40
-z-Scalewith
95
percent confidenceindicators Bicycle
118
41
- z-Scale with95
percent confidenceindicators
of allfour
images
122
List
of
Figures
Figure
Page
1
-Visual
effectofcorrectand
incorrect sampling
ratios8
2
-Brightness
changeof
the
image Woman
whensubtracting
30
from
each pixel value9
3
-Histogram
of
the
image Fruit
basket
10
4
-A
2x2
spot matrix per
halftone dot
resultsin
atotal
of5
grey
levels
14
5
-Approximation
of a
50
percentrounddot
in
a4x4
spotgridvs. a
50
percent rounddot in
a16x16
spot grid15
6
-User
interface
of"level"
command
in
Photoshop
2.0
(Image
Bicycle,
magenta
channel)
28
7
-Fresnel
zone plates35
8
-Smallest Fresnel
zone plates ofthe
test target
ateach resolutionon
the
proofs(magnification factor:
34)
42
9
-Smallest
Fresnel
zoneplatestest target
at846
spiand1690
spioutputresolutionon
the
press sheet(magnification factor:
34)
44
10
-Properties
ofthe
normaldistribution
48
11
- z-Scales ofthe
different
observergroupsfor
allfour images
combined
49
12
-z-Scale
including
intervals
of+/-2
zfor
allfour images
combined
(total
group
ofobservers)51
14
-Dot
shapesateach outputresolution on
the
proofs andthe
press sheet76
15
-z-Score scale
Woman
96
16
-z-Score scale
Street Cafe
98
17
-z-Scorescale
Fruit
basket
100
18
-z-Scorescale
Bicycle
102
19
-z-Scorescale of all
four images
104
20
-z-Scalewith
95
percent confidenceindicators
Woman
(professionals)
107
21
- z-Scalewith
95
percentconfidenceindicators Woman
(others)
108
22
- z-Scale with95
percent confidenceindicators Woman
(total)
109
23
- z-Scale with95
percentconfidenceindicators
Street
Cafe
(professionals)
Ill
24
-z-Scale with
95
percentconfidenceindicators
Street
Cafe
(others)
112
25
-z-Scale with
95
percentconfidenceindicators Street Cafe
(total)
113
26
-z-Scale with
95
percentconfidenceindicators Fruit
basket
(professionals)
115
27
-z-Scale with
95
percentconfidenceindicators Fruit
basket
(others)
....116
28
- z-Scale with95
percentconfidenceindicators Fruit
basket
(total)
117
29
-z-Scale with
95
percent confidenceindicators Bicycle
(professionals)
119
30
-z-Scale with
95
percent confidenceindicators
Bicycle
(others)
120
31
-z-Scale with
95
percent confidenceindicators Bicycle
(total)
121
32
- z-Scale with95
percent confidenceindicators
for
allfour images
(professionals)
123
33
-z-Scale with
95
percent confidenceindicators
for
allfour
images
(others)
124
34
- z-Scale with95
percent confidenceindicators for
allfour images
(total)
125
Abstract
The
use of colorin
newspaperprinting
has significantly
increased
overthe
last
few
years.To
compete with other newsmedia,
advertising
as wellaseditorialdesign had
to
become
morevisually
attractive,
using
more color graphics andimages.
The
concurrentdevelopment
ofintegrated
desktop
pre-press systemsfacilitated
the
integration
ofcolor,
having
less
cost associatedwithnewtechnology
purchasesthan the traditional
high
end systems.The
purposeofthe thesis
is
to
comparedifferent
outputresolutions of animagesetter
andto
find
the
minimal output resolutionnecessary
for
acceptablequality
in
newspapercolorimage
reproduction.The
speed of animagesetter,
whichis dependant
onthe
chosen outputresolution,
is
animportant factor
in
newspaper
turn-around time.
In
this study,
a matrix wasdesigned containing
varioustest targets
andfour
different
images
withdifferent
image
characteristics atfour different
outputresolutions.
Most
imagesetters
onthe
markettoday
support outputresolutionsthat
approximatethe
four
selectedfor
the
study
(846,
1016, 1270,
and1693
spotsper
inch).
The
screenfrequency
ofthe
images
was85
lines
perinch,
a commonscreen
ruling
in
newspaper reproduction.The
separationswere output on aLinotronic
530
imagesetter.
The
outputtime
variedfrom
18
minutesatthelowest
resolution of
846
SPI
to
abouthalf
anhour
atthe
highest
resolution of1693
spi.The
test
matrix wasprintedonConsolidated
Newsprint
on anoffsetnewspaperGoss
Community
press.The
print application's spatialresolving
power was evaluatedby
exarnining
Fresnel
zone plate resolutiontargets
under magnification.Due
to
ink
spreading,
no visible
difference
couldbe detected
onthe
printedtest
matrixbetween
the
different
output resolutions.The
test
matrix was alsosubmittedto
an audiencefor
visual evaluation.The
psychometric method applied was
the
paired comparisonmethod,
whichis
based
onthe
principlethat the
percentageof observerspreferring
astimulusover
the
othergives adirect
indication
ofhow
the
two
stimulidiffer. In
this
study,
the
stimuli werethe
images
withdifferent
output resolutions.Each
reproduction was paired with anotherimage
from
the
sametype,
but
withanother output resolution.
The
observershad
to
indicate if
they
preferredthe
left
or right
image
of a pair.The
criterionfor
evaluation was"better."The
statisticalanalysis ofthe
paired comparisonmethodindicates
that
for
allfour images
combined, there
is
a95
percent confidencelevel
that
novisualdifference in
quality
between
the
four
resolutionscouldbe detected
by
the
observers.
Experimental
noise,
specifically
registration,
skewed some ofthe
individual
image
results.As
aresult, the
first
hypothesis-the
visualquality
ofimages
reproducedin
newspapers
is
notdependent
onthe
imagesetter
outputresolutionabovea certainlimit for
a given set of print parameters-wasprovento
be
correct.However,
the
secondhypothesis-for
offset newspaperprinting
onconsolidatednewsprint at a screen
frequency
of85
lpi,
the
resolutionlimit lies between
1,000
and
1,200
SPi-hasto
be
rejected.This
study
concludesthat
for
the
given printparameters, the
resolutionlimit is 846
spi.Further
studies might evenindicate
alower limit.
To
summarize,
one ofthe
majordisadvantages
of electronichalftone
reproductions
today, namely
outputspeed,
canbe
optimizedindependently
from
technical
considerationssuch ashardware
and software systems.A
ininimaloutput resolution can
be found
for
a given print applicationby
exarnining
its
characteristics,
suchasresolving
power and print contrast.Any
image
outputata resolution
higher
than the
mirtirnumdoes
notimprove
the
quality
ofthe
reproduction,
andonly
slowsdown
the
productionturn-around time.
Chapter
I
Introduction
1.1
The Problem
The
purpose ofthe
study
is
to
comparedifferent
output resolutions of animagesetter
andto
find
the
minimal output resolutionnecessary
for
acceptablequality
in
newspaper colorimage
reproduction.Considering
the
amount ofdata
a color
image
file
contains,
the
speed with which animagesetter
can "write" afile
is
animportant factor
that
influences
the turn-around
time
in
newspaperproduction.
The higher
the resolution, the
longer
the
actualimaging
ofan outputtakes.
As
anexample, the
imaging
of afile
at1600
spotsperinch
(spi)
takes
approximately
twice
aslong
than
at800
SPI.The four
chosen output resolutions(846
spi, 1016 spi, 1270 spi,
and1693
spi)
aresupported
by
mostimagesetters
onthe
markettoday.
To
controlthe
variables,
allimages
were written withthe
sameimagesetter
(Linotronic
530)
asnegative
film
separations withidentical
screenfrequency
and screen angles.The
test
matrixwas printed onConsolidated Newsprint
on an offset newspaperGoss
Community
press.The
printed matrix was submittedto
atest
audiencefor
visualevaluation,
judged
visually.A
statistically
valid methodhad
to
be developed before
the
final
questioning
ofthe
test
audience.A
test
target,
a number of concentric circlesin
different
sizes,
wasincluded
to
measurephysically
the
limitations
ofthe
different
output resolutions.1.2
Its Background
andPresent Significance
The
use of colorin
newspaperprinting
has
significantly
increased
overthe
last
few
years.To
competewith othernewsmedia,
newspaperdesign
has become
more
visually
attractive,
integrating
morecolorimages,
text
and graphics.Before
1984,
colorin
newspaperprinting
wasusually limited
to
specialinserts,
such asseparateadvertisementor
the
weekend magazine.In
1984,
the
newly
founded
USA
Today
introduced
a new newspaperdesign
concept,
using
coloraggressively
throughout the
paperto
highlight
certaineditorialdepartments
andto
distinguish itself
from
other newspapers onthe
racks.In
the
following
years,
most newspaper publishers
followed
suit.By
1990,
86
percent of allnewspapersprinted editorial colorat
least
four times
aweek.1At
the
sametime,
the
development
of electronicpublishing
technology
facilitated
the
integration
of color.Page
layout
anddesign
softwaredevelopments
enabledthe
assembly
of newspaperpagesonscreen,
allowing
for
visual
(soft)
proofing before
the
pageis
physically
assembled.Imagesetters,
the
newestgenerationof output
devices,
enabledthe
concurrentoutputoftext,
graphics and
images,
making stripping
a minimalstep
in
page production.As
withthe development
of mosttechnologies,
speedhas been
amajorand output
time
a newspaperpage required madethe
use ofimagesetters
unrealistic
for
daily
production,
evenconsidering
allthe
advantages of anelectronic
publishing
system.But
asthe
processing
capabilities of rasterimage
processors(RIP)
andthe
speed ofPostScript
imagesetters
increase, they
become
a realalternative
to
newspaperpublishers.Image
files
whichhave
taken
hours
to
separate
just
afew
years ago canbe
processedtoday
in just
afew
minutes.2Limiting
the
outputresolutioncanspeedup
the
output evenfurther.
1.3
The
Reason
for
Interest in
the
Study
All
the
factors
mentioned abovehave
led
to
heavy
investment in
electronicpublishing
by
newspaper production management.Considering
the
tight
schedule and
the
number of pagesinvolved in
daily
newspaperproduction,
the
speed of
the
processfrom
editorialto
distribution is
crucial.The
speed ofthe
imagesetter
is
an essentialfactor in
productionturn-around time.
Although
trade
publications such asThe
Seybold Report
onPublishing
Systems
and
Color
Publishing
have
publishedspeedtests
ofhigh-resolution
PostScript
imagesetters,
most studies giveonly
vaguereasoning for
the output resolutionchosen
for
a giventest.
In
aSeybold
Report,
the
resolutionfor
newspapertests
wasbetween 1,000
and2,000
spi,
withthe
justification
that
"...not
many
peoplewould print newspaper pages at
anything
higher
than
that."3The
reasonfor
interest in this
study
is
to
find
away
to
speedup
the
imagesetter
outputtime
evenfurther,
independently
from
technical
constraintssuchas
processing capability
ofthe
rasterimage
processor,
laser
arrangementobtain areproduction
that
is
visually
notdistinguishable
from
higher
resolutionoutput,
the
imaging
ofseparationscanbe
optimizedto the
shortesttime
Endnotes
for
Chapter 1
1"New
Color
Ink Book
Due
in
1993."American Newspaper
Publishers
Association,
Special
Supplement
to
Tech News (December
1990): 1
2"PostScript
Speed
Tests:
Hyphen, Harlequin, RIP30, Emerald,
etc.",
The
Seybold Report
onPublishing
Systems
20
no.10/11(February
25,
1991):
5
Chapter
II
Theoretical Background
2.1
Electronic Halftone Reproduction
Electronic
halftone
reproduction consists ofthree
major steps:scanning
(input),
editing
and/or
manipulation,
andoutput,
normally
by
means of animagesetter.
The
primary
difference
of electronichalftone
reproduction comparedto
conventional
halftone
reproductionis
the
processwhereby analog
image
information
(density)
is
convertedinto digital information
(brightness
levels),
manipulated,
andthen
convertedback
to
analog
information
by
exposing films
on animagesetter.
Conventional
halftone
reproductionis
apurely analog
process.2.1.1
Input
To
accurately
reproduce animage,
there
shouldbe
noinformation lost
in
the
conversion
from
analog
(continuous)
to
digital
(discrete) form,
neitherin
number oftones
norin
spatialdetail.
Digitizing
animage is
aprocesswhereby
samplesof aphotographare
taken
atspecificlocations
withinit. Each
sampleis
givena numeric valuebased
onits
brightness,
ranging from
black
to
white.1is
oftenreferredto
as a pictureelement,
orpixel,
because
ofits
representationof adiscrete
elementofthe
digital
image."2For
halftone
reproductionpurposes, the
conversion of
the
continuoustones
into
256
discrete grey
levels
per separationis
usually
sufficientto
representthe
brightness
of animage
accurately.3The
number ofsamplesperimage
areadetermines
the
spatial resolution of animage. Resolution is
aterm
usedfor
describing
the
limitation
ofthe
digitizing
process.
The higher
the
resolution orsampling
rate, the
closer adigital image
will represent the original.
According
to the
Nyquist
Criterion,
alsoknown
asthe
Sampling
Theorem,
".
..tofully
representthe
rate ofbrightness
change,
ordetail,
in
anoriginalimage
wemustsampleit
at a rate atleast
twice
ashigh
asthe
highest
spatialfrequency
ofthe
detail."4The
"detail"in
ahalftone
reproductionis
the
individual
halftone
dot,
andthe
spatialfrequency
ofthe
halftone dot is
given
by
the
screen ruling.As
anexample,
if
the
chosen screenfrequency
is 85
lines
perinch,
there
are85 halftone
dots
perinch
recorded ontofilm
or paper.In
order
to
comply
withthe
Nyquist
Criterion,
the
scanning
resolutionfor
animage
has
to
be
chosenin
such a mannerthat
the
resulting
image file
has
twice
asmany
pixels per
linear inch
than
halftone
dots
after output.If
the
pixelcountis
too
low,
aliasing may
occur,
whichwouldbe
seenasamoirepatternin
the
digitized
image
or,
if
the
pixelcountis
muchtoo
low,
as"staircasing"(see
Figure
l).5There have been
someindications
that
the
2
to
1
sampling
ratio mightbe
excessive and a ratio
between 1.7
and1.4
to
1
mightbe
sufficientfor
mostreproduction purposes.
A lower
sampling
ratio woulddecrease
the
image file
size,
thereby
further
accelerating
the
editing
andprocessing time for
a givensystem.
As
there
have
notbeen
any
conclusive studies publishedby
the
time
this
8
according
to the
Nyquist Criterion
to
eliminateany
decrease
in image
quality
due
to
incorrect
sampling.ump
IflHlUlf
100
ppi20
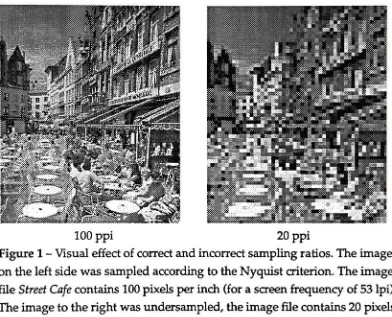
ppiFigure
1
-Visual
effect of correct and
incorrect
sampling
ratios.The
image
on
the
left
side was sampledaccording
to the
Nyquist
criterion.The image
file
Street Cafe
contains100
pixelsperinch
(for
a screenfrequency
of53 lpi).
The image
to
the
right
wasundersampled,
the
image
file
contains20
pixelsper
inch.
2.1.2
The Histogram
Although
image
manipulationandediting
capabilitiesofelectronichalftone
reproduction systems werenot part of
this study,
there
are some conceptswhichhave
to
be
introduced
asthey
werepartofthe
image
file
preparationfor
output.Digital
image
editing
and manipulationarebased
onthe
fact
that
variousimage
characteristicsaredescribed
numerically.As
mentionedabove,
each pixel [image:24.530.70.462.117.434.2]its
brightness
value.In
caseof acolorimage,
each pixelhas
morethan
onegrey
valueassociated with
it,
depending
onthe
amount of channelsthe
image
contains
(three
channelsfor
red,
green andblue;
orfour
channelsfor
cyan,
magenta,
yellow andblack).
By
convention,
if
a particular pixelhas
anumericalvalue of
0,
the
visualappearanceofthat
pixelis
black;
if
the
valueis
255,
the
appearance
is
white.Simple image
editing
functions like
overallbrightness
or contrast changes areexecuted
by
simple mathematicalfunctions. As
anexample,
if
animage
shouldappearoverall
darker,
a specific valueis
subtractedfrom
each pixel value(see
Figure
2).
In
case of a contrastchange,
each valueis
multipliedby
afactor.
If
the
factor is
smallerthan
1,
the
contrastis
decreased;
if
the
factor is
greaterthan
1,
the
contrastis
increased.
These
mostfundamental image
processing
operationsarecalled point
operations,
as all pixelsaremodifiedindividually.6normal
[image:25.530.70.461.380.627.2]-30
Figure 2
-Brightness
change ofthe
image Woman
whensubtracting
30
from
10
A
tool
oftenusedto
assessthe
brightness
and contrastattributes of animage
is
the
image
histogram.
In general,
ahistogram is defined
asafrequency
distribution
graphof aset of numbers.An
image histogram
is
a graph whichcontains
brightness
valuesonthe
horizontal
axis(0
to
255),
and"number
ofpixels"
on
the
verticalaxis(see Figure
3).
A
histogram
is
aneasy-to-read representationofthe
concentrationofpixels versusbrightness
in
animage. It
providesanimmediate
analysis whetherthe
image is
basically
dark
orlight
andhigh
orlow
contrast.7pixel values
Figure
3
-Histogram
[image:26.530.106.404.262.603.2]11
Adobe
Photoshop,
animage
manipulationandediting
softwarefor
the
Apple Macintosh
platform,
usesthe
histogram
representationto
allowthe
operator
to
manipulatehighlight,
midtone andshadow placement.Another
important
conceptin
desktop
publishing is
the
conversionfrom
additive
to
subtractive color space.There
is
adifference
in
color gamutbetween
the two
systems.Additive
systems,
such asCCD-scanners
andmonitors,
recordor
display
colors as a combination ofred,
green andblue. On
the
otherhand,
reproductions are printedwith
cyan, yellow, magenta,
andblack inks. To
be
ableto
previewon a monitorhow
animage
will reproduce-so-called"soft"proofing-the
monitorhas
to
be
calibratedto the
reproduction system.A
simplemathematical conversion of
brightness
values,
based
onthe
conceptthat
red,
green and
blue
arecomplimentary
colorsto cyan,
magentaandyellow,
does
nottake
into
considerationthe
spectralcontaminationsof realinks
andthe
black
printer,
andis
therefore
not applicable.Consequently,
conversion algorithmshave
to
be
establishedthat
calculatebrightness
valuesfor
the
black
separation,
depending
onthe
"strength"ofthe
black
printer andthe
overallbrightness
valueof
the
pixel.These
algorithmsusually
differ from
onesoftwaremanufacturerto
another.
The
"original"images
usedin
this
study
weredigitized
CMYK
files,
whichwere converted
to
RGB
andthen
back
to
CMYK. As
true
color rendition was notpart of
this study,
no special considerations were givento
the
conversionprocess.
The Adobe
Photoshop
separationfunction
wasusedto
convertthe
RGB
files
into CMYK. Each
separation wasthen
treated
individually
to
adjustfor
press specifications.
Additionally,
there
was nocalibratedmonitor availablefor
12
2.1.2
Output
The
device
usedto
expose electronichalftone
separationsonto photographicfilm
or paper
is
calledimagesetter.
A
newer generationofformer typesetters,
animagesetter
canbe described
asasophisticatedlaser
printer,
whereby
photographic
film
orpaperis
exposedwithlaser
beams in
agrid structure.These
exposure"marks" are often referredto
asspots,
dots
ormachinepixels,
but
for
the
purposeofthis
document,
the term
spot willbe
usedexclusively8The
number of spotsexposedover a certain
image
areadefine
the
resolution of adevice,
hence
the term
spotsperinch
(spi)
for
describing
imagesetter
outputresolution.
The
outputresolution animagesetter
can achieveis
device
dependent,
primarily
onthe
diameter
ofthe
laser beams
andtheir
array.Most
imagesetters
on
the
markettoday
have
the
option ofselecting
different
outputresolutions,
usually
between
approximately
400
(600)
up
to
2400
(3600)
spi.The
spot sizehas
to
be
adjustedaccording
to the
resolutionsetting
chosen.One
methodis
to
adjust
the
diameter
ofthe
laser
beam
by
moving it
closerto
orfurther
away
from
the
film,
orby inserting
different lenses
between
the
laser
andthe
film.
Another
technique
is
to
vary
the
intensity
ofthe
beam,
but
this
method cancauseproblems
maintaining
consistentdot
quality.9A
low
intensity
beam
may
notexpose
the
photographic materialsufficiently
to
createanadequatedensity
necessary for
correct plate exposure.As
the
laser
beam's
intensity
peaksin
the
middle anddecreases
to
the edges,
the imagesetter
spotshave
to
overlap slightly
to
expose asoliddensity
halftone
13
halftone dot
would containunexposedareas,
which would resultin
adecrease
ofdot
quality,
notto
mentionuncontrollable
variationsof areacoverages(dot
percentages).
Considering
agivenfile
andagivensystem, the
speedwith which animagesetter
canexposefilm
or paperis
directly
relatedto
the
outputresolution.The imagesetter
usedfor
this study, the
Linotronic
530,
offers eightdifferent
addressableresolutionsettings,
ranging
from 423
spito
2540
spi.The
speedfor
output of aspecificfile
at423
spiis
givenas47.4
inches
perminute, the
speedat2540
spias5.3
inches
perminute.10Note
that the
output speed at a given
resolution will
vary,
depending
onthe
complexity
ofthe
outputfile.
In
electronichalftone
reproduction,
a cluster ofimagesetter
spots creates ahalftone
dot.
Depending
onthe
imagesetter
outputresolutionandthe
screenfrequency,
the
number of spots usedto
create onehalftone dot
varies.More
spots allowfor
finer increments
in dot
sizes.If,
for
example,
four
spotsareavailableto
image
onehalftone
dot,
five different dot
percentage values arepossible: no spotexposed
leaves
the
area unexposed(0%
dot),
onespot exposed resultsin
a coverage ofonequarter ofthe
area(25%
dot),
etc.(see
Figure
4).
As
aconsequence,
screenfrequency
and output resolutionhave
adirect influence
onthe
numberofgrey
levels
visibleand canbe
calculatedusing
the
following
equation:
(Resolution
*Screen
Frequency)2+1
=Grey
Levels
1114
5
Bi W
0
spot1
spot2
spots3
spots4
spotsGrey
Level 1
Grey
Level
2
Grey
Level 3
Grey
Level 4
Grey
Level 5
Figure
4
-A 2x2
spotmatrix per
halftone dot
resultsin
atotal
of5
grey
levels.
The
moreimagesetter
spots usedto
create onehalftone
dot,
the moregrey
levels (or
colors)
ahalftone
reproduction will contain.Considering
the
resolutions chosen
for
this experiment,
andthe
given screenfrequency
of85
lines
per
inch,
the
theoretical
number ofgrey levels
each separationcontains canbe
calculated
according
to the
formula
above.Table 1
-Number
of
grey levels
for
each separationdepending
onthe
output resolution.
Resolution
Grey
levelsNumber
ofColors
(CMYK)
846
spi
100
100
million1016
spi144
430
million1270
spi224
3.5
billion
1693
spi(398)
256
(25)4.3
billion
As
canbe deduced from
Table
1,
thefewer
grey levels
a separationcontains,
the
morelimited
the
color rendition ofthe
reproductionbecomes. Note
that the
number of colors are
only
theoretical
figures,
calculatedby
multiplying
all15
separations
(i.e. 100x100x100x100
=100
million) to
obtain all possible combinations.In
reality, the
rangeofcolorsareproductionwillcontainis
severely limited
by
process constraints such ashighlight
andshadow placement which are never at0
or100
percent,
the
black
separationwhichis
not afull
tonal
separation,
andthe tonal
rangeofthe
image
itself. In
addition,
independently
from
the
imagesetter
resolution, the
brightness
resolution ofthe
digitized
image
will
limit
the
maximumnumber ofgrey levels
orcolorsobtainable.The images
usedin
this
study have
abrightness
resolution of8
bits
per pixel.In
this
case,
the
theoretical
number of398
grey levels
for
an output resolution of1693
spiis
notachievable,
asthe
image itself is limited
to
2^or256
grey
values per channel.Another
consideration ofimagesetter
output resolutionis
the
halftone
dot
shape.A
halftone dot has
abetter
defined
shapeif
morespotsare usedto
image
it.
If
fewer
spots areused,
the
circumferenceofthe
dot looks
jagged.
Although
electronically
createdhalftone dots
are so-called "hard"dots
and areless
likely
to
loose
their
shapeduring
plateexposure,
ink
spreading
ordot
gainduring
printing becomes
unpredictableandpoorly defined halftone dot
shapesmay
resultin
considerable color shifts.i
1
IH
!
\
i
16
It
remainsto
be
seenif
the
above mentioned constraintsoflow
outputresolution-number ofcolorsand
dot
shape-areimportant factor
in
newspaperimage
reproduction,
considering
allthe
otherlimiting
factors
suchaspoorregistration,
inferior
paperquality,
coarsescreenfrequency
andlow
ink density.
By
letting
anaudiencevisually
evaluatethe outcome,
the
hypotheses
statedin
Chapter HI
canbe
proven or rejected.2.2
Statistically
Valid Methods
for
Visual
Evaluation
ofQuality
The
idea
that the
human
sensory
system canbe
usedto
measure a physicalquantity
goesback
to the
German
physicistGustav
Theodor Fechner.
He
established
that
it is
possibleto
develop
".
..anexacttheory
ofthe
relation ofbody
andmind."12Fechner's
controversiallaw
predictsthat
equalstimulusratios elicit equal
sensory
differences.13Consequently,
visualpsychophysicsis
concernedwith"...the
study
oflawful
stimulus-response relationships and
theoretical
concepts aboutexplanatory
mechanisms."14
Physical
sciences,
sometimes referredto
asthe
"exact"sciences,
arenot
particularly
controversial.They
depend
on aninstrument
to
measureaphysical quantity.
As
anexample, two
peoplemeasuring
the
length
ofanobjectwill
probably
getthe
sameresult,
asthe
calibrationof a ruleris
universally
the
same.
In
otherwords,
a meter was oncedefined
asthe
length
of astandardmetalbar in
Paris,
andany
instrument
capableofmeasuring length
in
the
metricsystem
incorporates
the
length
ofthis
standard.15On
the
otherhand,
the
measurement orscaling
ofsubjective qualitiesis
17
inherently
private,
a person canonly
evaluateonthe
strength ofhis
orher
ownsensation.
If
one observerinsists
thatacoloris
ten
times
as saturatedthan
another
color,
althoughthey
nearly
matchfor
anotherobserver,
thereis
noground
to
doubt
either judgement.16Although
a color canbe
specified as".
..thematching
of spectral wavelength withadditive amountsofthree primaries"17,
the
appearanceof thatcolor".
..dependsonmany
unspecified parameters suchasluminance,
area,
retinal regionstimulated,
duration
ofpresentation,
state ofadaptation of
the
eye,
andthe
influence
ofsurrounding
colors."18Different
methodshave
been
establishedto
estimatesensory
magnitude.Psychophysical
methods assumethat there
is
adirect relationship
between
stimulus and response.
For example,
if
the
intensity
of alight bulb is
turned
down,
".
..thesensation ofbrightness clearly
decreases
monotonically
withthediminution
ofthe
physicalintensity
ofthe
light.
Consequently,
there shouldbe
no
difficulty
in
establishing
an ordinalscale ofbrightness
as afunction
ofphysicalintensity"19
Psychometric
methods,
as opposedto
psychophysicalones,
areconcernedwith
the
scaling
of stimuli whichdo
nothave any
measurablephysicalquantities.
The
stimuliare ratedaccording
to the
reactionthey
produceonhuman
observers.In
otherwords,
psychometricmethods giveindications
aboutresponsedifferences.20
In
thisstudy, the
stimuliprovidedto
the
observerswereimages
withdifferent
outputresolution.To
test
thehypothesis,
the
observershad
to judge the
quality
ofthe
reproduction,
whichis
asubjectivecriterion,
asit
depends solely
onthe
observersdefinition
ofquality
andis independent from
the physical specifications of
the
reproduction.There
arethree
psychometricmethods establishedthat
providea18
ofpaired
comparison,
andthe
methodofcategories.When
using
the
rank ordermethod, the
observeris
askedto
orderthe
stimuliaccording
to
a specifiedcriterion.
The
resultfor any
particularobserver,
by
definition,
willbe
an ordinalscale.
This
methodis
usefulif
thedifferences
ofthe
stimuliis
relatively
apparentand
the
number of stimuliis
nottoo
large.21The
method chosenfor
this
study
to
measurethe
existence of a visualdifference
between
the
reproductionsis
the
pairedcomparisonmethod.Described
formally
the
first
time
by
Louis
Leon Thurstone
(1927)
in
the
law of
comparativejudgments,
"..
.theobserver'stask
in
the
methodof paired comparisonis
to
discriminate between
two
stimuli..It is
".
..basedon the notionthat the
proportion of
times
stimulusA
willbe judged
greaterthan
stimulusB
is
determined
by
the
degree
to
which sensationA
and sensationB
differ".23In
other
words, the
proportion of observersjudging
onestimulusto
be
greaterthan
the
other gives adirect
indication
ofhow
the
attributesunderstudy
differ. The
stimuli
in
this
study
werethe
images
reproduced withdifferent
outputresolution.
If 95%
ofthe
observers preferred oneoutputresolutionto
another,
one could
safely
assumethat there
is
a realdifference
in
quality
ofthe two
images.
If,
however,
the
images look
the
sameto the
observers,
the proportion ofresponse should
be
around0.50.24The
methodology
of paired comparison asit
applies
to this
experimentis described in
section4.8.
The
paired comparison method worksbest
whenthe
number of stimuliis
low
andthe
stimulusdifferences
arevery
small(in
fact,
whenthe
differences
arenot small
enough,
the
methoddoes
notwork well).By forcing
the
observersto
19
The
methodof
categoriesrequiresobserversto
sort stimuliinto
alimited
numberof
categories,
usually
having
usefullabels. As
anexample, the
labels for
this
experimentcouldhave been
excellent, good,
passable,
andbad. This
methodis
advantageous
if
the
number of stimuliis large. The
numberof categories useddepends
onthe experiment,
sevenis
usually
considered amaximum.26The
choice ofwhich methodto
useis entirely up
to
the
experimenter.It
usually depends
onthe
degree
of precisionneeded,
as well asthe
time
and cost ofthe
experimentation.In
any
case,
a psychophysical experimenthas
to
be
Endnotes for Chapter
2
Gregory
A.
Baxes,
Digital
Image Processing.
(Englewood
Cliffs,
N.J.:
Prentice-Hall,
1984;
reprint,
Denver,
CO:
Cascade
Press,
1984):
22
2(lbid,
22)
3Caren
Eliezer,
"Color
Screening
Technology:
A Tutorial
onthe
Basic
Issues,"
The
Seybold Report
onDesktop
Publishing
6,
no.2
(October
2,
1991):
16
.
4(Baxes 1984, 23-24)
5(lbid,
24)
6(Ibid,
38)
7(lbid,
32-33)
8Jim
Hamilton,
Digital
Halftone
Dots
(Hauppage,
NY:
Linotype-Hell
Company,
1991),
partnumber3060,
Technical Information:
1
9(Eliezer 1991, 17)
10"Linotronic
530,"Linotype
Company
(1990):
2
"(Eliezer
1991,
16)
12E.
G.
Boring,
What
is
Science?
(J.
R.
Newman,
ed.,
New York:
Simon
andSchuster,
1955)
as quotedin James C.
Bartleson,
Franc
Grum,
ed.,
Optical
Radiation Measurements
(Orlando:
Academic
Press, Inc., 1984),
vol.5,
Visual
Measurements:
335-336
13James
C.
Bartleson,
Franc
Grum,
ed.,
Optical Radiation
Measurements
(Orlando: Academic
Press, Inc., 1984),
vol.5,
Visual Measurements: 338
21
14(Ibid,
336)
15(Ibid,
338-340)
16(lbid,
339)
17(Ibid,342)
18(Ibid,
342)
19(lbid,
357-358)
20(lbid,
358)
21(lbid,359)
22George
A.
Gescheider,
Psychophysics
-Method, Theory,
andApplication,
2d
ed.(Hillsdale,
N.J.,
London: Lawrence Erlbaum
Associates,
1985):
147
^(Ibid,
147)
24(lbid,
147)
^(Bartleson,
Grum
1984, 485)
26(Ibid,
359)
Chapter
III
Hypotheses
The
visualquality
ofimages
reproducedin
newspapersis
notdependent
onthe
imagesetter
output resolutionabove a certainlimit
for
agiven set of printparameters.
For
offset newspaperprinting
on consolidated newsprint at a screenfrequency
of85
lpi,
the
resolutionlimit
lies between
1,000
and1,200
spi.Chapter
IV
Methodology
4.1
The
Choice
ofImage Resolutions for
the
Study
As
mentionedin
section2.1.2,
the
screenfrequency
of a reproduction andthe
imagesetter
outputresolutiondetermine
the
number of colors animage
can contain.Lowering
the
outputresolution willresultin
fewer grey levels
perseparation,
andconsequently
fewer
colorsper reproduction.To
make thisstudy
validfor
practicalapplication,
it
was moreobviousto
vary
the
imagesetter
output resolution
than the
screenfrequency.
The
screenfrequency
of reproductionsfor
a given newspaperis
usually
predeterminedby
presscharacteristics such as print
method,
ink
and paper quality.On
the
otherhand,
mostimagesetters
onthe
markettoday
offer arangeof addressableoutput resolutions.It
is left
to the
prepress operatorto
choosethe
resolutionbest
suitedfor
the
printapplication.In
this
study,
the
screenfrequency
waskept
constantat85
lpi
(see
section4.4).
The hypothesis
is based
on theassumptionthat
there
shouldbe
adecrease
in
image
quality
if
the
outputresolutionis
too
low. At
a certainadaptationlevel,
the
human
eyeis
ableto
distinguish
128
to
256
grey levels
simultaneously.Consequently,
anoutput resolutionbetween
1,000
SPI
(139 grey levels
per24
separation)
and1,200
spi(200 grey levels
perseparation)
shouldtheoretically
be
sufficientto
obtainagoodimage
reproductionat85 lpi.
Any
output resolutionhigher
than
that wouldnotgiveadistinguishable increase
in image
quality,
asthe
human
eyeis
incapable
ofresolving
the
differences. On
the
otherhand,
any
output resolution
lower
than
1,000
spi
couldtheoretically
createartifactsin
the
reproduction.
To
test this
theory,
output resolutionswhich were considered"normal"andoutputresolutionswhich were considered
too
high
andtoo
low had
to
be
included
in
the test
matrix.Besides
the
normal1,000
and1,200
spiimagesetter
output
resolutions,
only
one"high"
and
"low"
resolution could
be
considereddue
to
sizeconstraints.The
nexthigher
than1,200
spiresolutionsetting
for
mostimagesetters is approximately
1,600 SPI,
the
nextlower
than
1,000
SPIsetting
is
approximately
800
spi.The
final
outputresolutions,
846 spi, 1016
spi,
1270
spiand1693 spi,
weredetermined
by
the
actualimagesetter
Linotronic 530
usedto
outputthe
films (see
section
4.5).
4.2
The Choice
ofImages for
the
Study
The
numberofimages
that
couldbe
usedin
this
experimentwasphysically
limited
by
the size ofthe test
matrix(22.75"
x
30")
andthe
number ofoutputresolutions
to
be
tested
(846
spi, 1016
SPI, 1270
SPI,
and1693
spi).The images had
to
be carefully
chosento
represent awiderange ofimage
categories.The
four
images
usedin
this
study
comefrom
asetof sixSCID
(Standard
25
continuous
tone
colorimages destined for hard
copies madewithproofing
orprinting
processes.The
images
were scannedon aDainippon
SG-608
high-performance color
scanner,
andstoredonmagnetictape
in
CMYK
format
witha spatialresolutionof2560
pixels(long
side)
times 2048
pixels(short
side).The
brightness
resolutionis 8
bits
perpixel,
or256 levels.
The data
format
is
based
onthe
ANSI
IT8.1-1988
"User Exchange Format for
the
Exchange
ofColor Picture
Data
between Electronic Prepress
Systems
viaMagnetic
Tape"to
ensurecompatibility
ofthe
colorimage
data,
anddata
transfer
between
different
output systems.1Due
to test
matrix sizeconstraints,
not all siximages
couldbe
usedfor
this
study,
and stillbe
reproducedat acceptableimage
size andin
allfour
chosenoutputresolutions.
Two images
wereeliminated,
the characteristicsof otherfour
images
usedfor
the
study
aredescribed in Table
2.
Table
2
-Image
characteristics of
the
four images
usedin
the
study.Image
nameCharacteristics
Woman
Low-frequency
image
(gradual
tonal
increase
from light
to
dark),
allowsfor
evaluation ofthe
reproductionofhuman
skin.Street Cafe
High-frequency
image
withcomplicatedgeometric patterns and
shapes,
allowsfor
evaluation ofthe
reproduction offine
detail.
Fruit
basket
Low-key
image,
allowsfor
evaluation ofthe
26
Table
2
-continued
Image
name
Characteristics
Bicycle
High-key
andhigh-frequency
image,
allowsfor
evaluationof
the
reproductionofhighlight
to
midtonegradation as wellas
image
sharpness.4.3
The Design
ofthe
Test
Matrix
The
test
matrix wasdesigned
on anApple Macintosh
personalcomputer,
using
QuarkXPress
3.0
page
layout
software.The
size ofthe test
matrix wasdetermined
by
pressspecifications,
the
presshaving
atotal
paper width of30
inches
and a repeat(cut-off)
length
of22.75 inches.
The
matrixhad
to
be
designed
in
such away
that
the
spaceis
optimally
utilized,
allowing
for
normalsizeimage
reproduction andeasy assembly
ofseparations with
different
output resolutions.Test
targets
to
measuresolidink
density,
UGRA
wedgesto
measure plateexposure,
andresolutiontargets
consisting
ofFresnel
zoneplates(see
page34) had
to
be included
in
the
matrix.The
resulting
layout
(see
Appendix
A)
contained16
images. Each
columnconsisted of
the
four different
types
ofimages
reproducedwiththe
same outputresolution.
The dimension
ofthe
images
came outto
be
4.4"x
5.5",
leaving
roomat
the
bottom
andthe
sidesfor
test targets
andtitle information.
The four
files
sentfor
output werebasically
identical,
exceptfor
aletter
atthe
bottom
ofthe
images
indicating
the
output resolution(A:
846 spi, B: 1016 spi,
27
"white
space"around
the
sidesto
facilitate
stripping.The
first file (846
spi)
additionally
containedthe
title information.
The Fresnel
zone plates(see
section4.8)
resolutiontest target
was aPostScript
program written
by
Professor Frank
Cost
andimported
into
PageMaker 4.0
pagelayout
softwareon anIBM DOS
personal computer.The
EPS
file format
was notcompatible with
QuarkXPress,
thereforethe targets
could notbe imported into
the
layout. The
target
wassent asa separatePageMaker
file
(for
Macintosh),
to
be
imaged
withthe
sameoutput resolutionsthan
the
image files.
The image
files,
discussed in
section4.2,
andthe
pagelayout
files
were stored on aSyQuest
44MB
removabledisk.
4.4
The
Preparation
ofthe Images
for Output
As described
in
section4.2,
the
originalimage
file
data
was stored on magnetictape
in CMYK
format.
To be
ableto
import
the
files
asrawdata
(binary
data)
into
Adobe
Photoshop
2.0,
the
image
editing
software usedfor
this study,
theimages
had
to
be
convertedto RGB. The
conversionwasexecutedusing
separationalgorithms
developed
by
Mr. J. A. Stephen
Vlggiano from
the
RIT Research
Center.
After
importing
the
RGB
files into
Photoshop,
the
images
were resampledaccording
to the
Nyquist
criterion.Considering
the
chosen screenfrequency
of85 lines
perinch
andthe
physical size ofthe
images
of 4.4"x
5.5",
the
image
files
were sized
down
to
748
x935
pixels.The
choice of85
lines
perinch
as screenfrequency
wasfor
the
following
28
offsetnewspaperprinting.
Because
the
study
couldonly
evaluatethe
effect ofoutput resolution onone
frequency,
85
lpi
was alogical
choice.Second,
pressspecifications which
had
to
be included
in
the
preparation of theimages
wereonly
availablefor
85
lpi
screenfrequency.
After
resampling,
theimages had
to
be
convertedto
CMYK
again sothat
highlight
and shadow placement aswell asdot
gain specifications couldbe
included for
eachseparation.Photoshop
2.0's
separationalgorithms aretransparent to the
operator,
exceptfor
the
choice ofthree
black
printers.As
true
color
rendition,
i.e.
matching
the
reproduction withthe
original,
wasnot part ofthis study,
nofurther
consideration was givento the
separationprocess,
andthe
medium
black
printersetting
was chosen.Each
separationhad
to
be
adjustedfor
highlight
andshadowdot
placementas well as
dot
gain.The
most convenientway
in
Photoshop
2.0
to
adjust outputvalues
is
underthe
"level"command,
which allowshistogram
compression andextensions
for
each channel(or
separation).Input Leuels:
0
1.00
255
Output
Leuels:
0
255
[HHnwiiiiiMiniBiiiiinfiiiiHJJU!iHiiJ!i^^ *".?.'. &*
[Z2|]
j^ i*'V;g - ^^$yfSxx:::::::::I:ir.:l
OCM
OVOK
O
Master
Figure
6
-User
interface
of"level"
command
in
Photoshop
2.0
(Image
Bicycle,
29
A Kodak
Customized
Color
Analysis
2executedfor
the
Goss
Community
Newspaper
Printing
Press
which was usedto
printthe test
matrix gave valuableinformat