A Comparative Study of Serum Ascitic Fluid Albumin Gradient with Ascitic Fluid Total Protein in Hepatic and Non-Hepatic Causes of Ascites in Government Vellore Medical College Hospital, Vellore
113
0
0
Full text
(2) CERTIFICATE This. is. to. certify. that the dissertation titled “A COMPARATIVE. STUDY OF SERUM ASCITIC FLUID ALBUMIN GRADIENT WITH ASCITIC FLUID TOTAL PROTEIN IN HEPATIC AND NON-HEPATIC CAUSES. OF. ASCITES. IN. GOVERNMENT. VELLORE. COLLEGEHOSPITAL, VELLORE” is a genuine work done. MEDICAL. by DR.ABDUL. WADHOOD.S, Post Graduate student (2016 – 2019) inthe Department of General Medicine, Government Vellore Medical College, Vellore under the guidance of Prof. Dr.M.RANGASWAMI, MD, DMRD.,. Prof. Dr.M.RANGASWAMI M.D.,DMRD.,. Prof.Dr.S.P.KUMARESAN,MD.,DCH.,. Guide & Chief. Head of the Department,. Medical Unit - III. Department of General Medicine,. Department of General Medicine,. Government Vellore Medical College Hospital. Government Vellore Medical College Hospital. Prof.Dr.R.Shanthimalar,MD,DA The Dean, Government Vellore Medical College Vellore -632011..
(3)
(4) CERTIFICATE – II This is to certify that this dissertation work titled ‘A COMPARATIVE STUDY OF SERUM ASCITIC FLUID ALBUMIN GRADIENT WITH ASCITIC FLUID TOTAL PROTEIN IN HEPATIC AND NON-HEPATIC CAUSES OF ASCITES IN GOVERNMENT VELLORE MEDICAL COLLEGE HOSPITAL, VELLORE of the candidate DR.ABDUL WADHOOD.S with registration Number 201611651 for the award of M.D. DEGREE in the branch of GENERAL MEDICINE. I personally verified the urkund.com website for the purpose of plagiarism Check. I found that the uploaded thesis file contains from introduction to conclusion pages and result shows 3% percentage of plagiarism in the dissertation.. Guide & Supervisor sign with Seal.
(5)
(6)
(7) DECLARATION. I, DR.ABDUL WADHOOD.S solemnly declare that this dissertation titled ‘A COMPARATIVE STUDY OF SERUM ASCITIC FLUID ALBUMIN GRADIENT WITH ASCITIC FLUID TOTAL PROTEIN IN HEPATIC AND NON-HEPATIC CAUSES OF ASCITES IN GOVERNMENT VELLORE MEDICAL COLLEGE HOSPITAL, VELLORE’ is a bonafide work done by me in Department of General Medicine, Government Vellore Medical College And Hospital,. Vellore. under. the. guidance. and. supervision. of. Prof.. Dr.M.RANGASWAMI, MD, DMRD.,. This dissertation is submitted to the Tamilnadu Dr. M.G.R. Medical University, Chennai in partial fulfilment of the university regulation for the award of M.D., Degree in General Medicine (Branch – 1).. Place : Vellore Date :. DR. ABDUL WADHOOD.S.
(8) ACKNOWLEDGEMENT It gives immense. pleasure for me to thank everyone who has helped. me during the course of my study and in. preparing. dissertation.. My sincere thanks to Dr. Shanthi Malar M.D, D.A , the Dean, Govt. Vellore Medical College for permitting me to conduct the study and use the resources of the College. I am very thankful to the Chairman of the Ethical Committee and members of the Ethical Committee , Government Vellore Medical College And Hospital for their guidance. and help in getting. the ethical clearance for this. work. I. consider it a privilege to have done this study under the supervision. of my beloved teacher, guide and. unit chief Prof. Dr.M.RANGASWAMI,. MD, DMRD., who has been a source of constant inspiration and encouragement to accomplish this work. I express. my deepest sense of thankfulness to my Assistant Professors. Dr.G.ELUMALAI MD., Dr. M.ANITHA MD., Dr.MATHINI, MD., and Dr. IMRAN NIAZI MD for their valuable inputs and constant encouragement without which this dissertation could not have been completed. I. express my sincere gratitude to Prof. Dr. S.P. KUMARESAN M.D.,. DCH., Professor & Head of the Department of General Medicine. I also thankProf. Dr. R.THILAKAVATHI, M.D.,DCH., Professor of General Medicine and Prof. Dr.D.ANBARASU M.D., Former Professor & Head of the Department of General.
(9) Medicine, Prof Dr.PHILOMENA M.D.,Former Professor & Head of the Department of General Medicine for their valuable inputs and supports. I am. particularly. Sathish Kumar .V,. thankful. to my fellow postgraduate colleagues Dr.. Dr, Nandhini Devi.D, And Dr.AravindaKumar.S for their. valuable support in the time of need throughout the study. I thank my senior Post Graduate Dr.Nethaji for his valuable support and guidance in this study. I thank my junior Post Graduates. Dr.Prashanth and. Dr. Pradeep who supported me in completing the dissertation. I extend my sincere thanks to junior postgraduates. Dr.Parthasarathi, Dr. Udhayanandhini, Dr.. Sreelakshmi& CRRIs for helping me in the preparation of this dissertation. I would like to thank the entire faculty of Department of General Medicine and Cardiology & Radiology for their guidance and support all along. I would like to thank all the patients who volunteered to be a part of my study, without them this study would not have been possible. I want to thank Dr. Damodharan MD., for guiding me in data compilation and statistical analysis. I want to acknowledge all my fellow postgraduates from the department of General medicine, who helped me compile this study. I would like to thank my parents ,my wife and my son who have been pillars of strength and support during my post graduate studies. Lastly, I bow my head before the Almighty for bestowing upon his blessings and his unconditional favours at all times and under all circumstances..
(10) TABLE OF CONTENTS CERTIFICATE .............................................................................................................. ACKNOWLEDGEMENTS........................................................................................... TABLE OF CONTENTS............................................................................................... TABLE OF FIGURES................................................................................................... ABBREVATIONS AND ACRONYMS ....................................................................... ABSTRACT................................................................................................................... 1. INTRODUCTION............................................................................................... 1. 2. AIMS AND OBJECTIVES................................................................................. 4. 3. REVIEW OF LITERATURE.............................................................................. 5. 4. MATERIALS AND METHODS ...................................................................... 27. 5. RESULTS AND ANALYSIS ........................................................................... 36. 6. DISCUSSION ................................................................................................... 62. 7. CONCLUSION ................................................................................................. 78. 8. REFERENCES.................................................................................................. 79. 9. DATA COLLECTION PROFORMA .............................................................. 89. 10. MASTER SHEET............................................................................................. 93. 11. INFORMED CONSENT .................................................................................. 98.
(11) TABLE OF FIGURES Figure 1: Gender wise distribution of Ascites ........................................................... 36 Figure 2: Age wise distribution of ascites.................................................................. 37 Figure 3: Etiology wise distribution of ascites .......................................................... 38 Figure 4: Etiology of cirrhosis causing ascites .......................................................... 39 Figure 5: Gender wise distribution of ascities along with etiology ........................... 40 Figure 6: Etiology of ascites among males ................................................................ 41 Figure 7: Etiology of ascites in females..................................................................... 42 Figure 8: Serum albumin levels of patients studied................................................... 43 Figure 9: Ascitic fluid albmin of patient studied ....................................................... 44 Figure 10: Comparison of results between SAAG and AFTP ................................... 45 Figure 11:Comparison of diagnostic accuracy of AFTP and SAAG for individual aetiology of ascites......................................................................................................................... 46 Figure 12:Scatter Plot of SAAG and AFTP level in the study population………... 47.
(12) LIST OF TABLES Table 1: AFTP of patients studied ............................................................................. 48 Table 2: SAAG of patients studied ............................................................................ 49 Table 3: SAAG Level With etiology ......................................................................... 50 Table 4: AFTP levels along with aetiology .............................................................. 51 Table 5: Classification of ascites based on pathophysiology) ................................... 52 Table 6: Classification of ascites as exudates and transudate.................................... 53 Table 7: Comparison of SAAG and portal HTN ....................................................... 54 Table 8: Comparison of AFTP and Pathophysiology ................................................ 56 Table 9: Comparison of diagnostic accuracy of AFTP and SAAG for individualaetiology of ascites......................................................................................................................... 58 Table 10: Comparison of SAAG for hepatic and non-hepatic etiology of ascites….59 Table 11: Comparison of AFTP for hepatic and non-hepatic etiology of ascites…..60 Table 12: Mean, Standard Deviation And Standard Error Of Mean Of Comparison Between AFTP and SAAG ....................................................................................................... 61.
(13) ABBREVIATIONS AND ACRONYMS AFTP. -. Ascitic fluid total protein. SAAG. -. Serum Ascitic Fluid Albumin Gradient. g/dl. -. gram/decilitre. HVPG. -. Hepatic Venous Pressure Gradient. WHVP. -. Wedged Hepatic Venous pressure. FHVP. -. Free Hepatic Venous Pressure. CCF. -. Congestive Cardiac Failure. TB. -. Tuberculosis.
(14) 1. INTRODUCTION. HISTORICAL ASPECT OF ASCITES In Ayurveda literature, a mention of ascites is found as 'Jalodhar' ("water in abdomen").6 1500 B.C: Egyptians were aware of abnormal collection of abdominal fluid associated with disease of liver. 20 BC:. Celsus. Advocated removal of fluid to give relief to patients with ascites.. 700 A.D :. Paul of aegina treated ascites by drainage through a copper tube.. 1398 AD:. The term 'Ascites' was coined by Trevesia.. 1780 AD:. James Douglas described peritoneum.. 1804 AD:. Peritonitis was described by Laennec. 1896 AD:. James Rutherford Morrison introduced 'omentopexy' to relieve ascites due to cirrhosis of liver.. 1898 AD:. Sape Talma Independently described this procedure. Henceforth known as 'Morrison-Talma operation'. Pegot described 'Caput Medusae' pattern of veins over abdomen with a murmur heard in vicinity of umbilicus in an alcoholic soldier.. 1934 AD:. Joe Vincent Meigs described Meig's syndrome. 1950 AD:. Keith and Pleffer noted raised amylase levels in peritoneal fluid in case of Pancreatitis. 1954 AD:. Giegs B and Kunkel measured osmotic pressures of serum and. ascitic fluid in patients with hepatic cirrhosis. 1.
(15) 1970 AD:. Ultrasonography was used to detect as little as 100ml of ascitic fluid.. 1971 AD:. Witte C.L. et al explained the importance of colloid pressure in hepatic cirrhosis with ascites.. 1978 AD:. Hoef's JC. Proposed the idea of estimation of portal pressure by ascitic fluid analysis.. 1982 AD:. Pierre Pare, Jean Talbot and John C. Hoefs proved physiological basis of serum ascites albumin gradient.. Ascites is one of the most common problem which a physician confronts in his daily practice,which can be effectively diagnosed by ascitic fluid analysis.1 The ascites is classified traditionally based on estimating theAFTP (ascitic fluid total protein)as ‘exudative’ and ‘transudative’ ascites.1 The ascitic fluid total protein is, more than or equal to 2.5 g/dl in exudative ascites and less than 2.5 g/dl in transudative ascites. This when used in routine clinical practice, has many pitfalls especially in cases of cardiac ascites2 , cirrhotic patients on prolonged diuretic therapy3and in about 1/3rd patients of malignant ascites4 , sometimes even in usual cirrhotic patients’ ascitic fluid5 and in SBP (spontaneous bacterial peritonitis)6 where it cannot identify the pathophysiology of ascitic fluid formation accurately.To overcome this issue, anewer way of classification of ascites based on SAAG was introduced. The difference between the serum and ascitic albumin concentration was used to classify the ascitic fluid under two categories : A gradient ≥ 1.1 g/dl in cases with portal hypertension and < 1.1 g/dl in ascites due to other causes.1 Even the SAAG has drawbacks like difficulty in identifying ascites due to non-alcoholic cirrhosis7, due to mixed etiological conditions8, and it could not differentiate between 2.
(16) ascites due to malignancy and tuberculosis.9 As both the methods AFTP and SAAG had their own sets of drawbacks there is a need for a study to compare the diagnostic accuracy of SAAG and AFTP in identifying the pathophysiology causing ascites thereby helping in evaluating the etiological cause of ascites in various Hepatic and Non Hepatic conditions.. 3.
(17) 2. AIMS AND OBJECTIVES. 1. To differentiate ascites based on serum ascitic fluid albumin gradient as high SAAG ascites more than or equal to 1.1g/dl and as Low SAAG ascites of <1.1g/dl 2. To determine sensitivity and specificity of SAAG(serum ascitic fluid albumin gradient) and that of AFTP (ascitic fluid total protein) in identifying the pathophysiology of ascites. 3. To compare the diagnostic accuracy of SAAG (Serum ascitic fluid albumin gradient) with traditional marker AFTP (ascitic fluid total protein).. 4.
(18) 3. REVIEW OF LITERATURE. 3.1 HISTORICAL PERSPECTIVE The pathological accumulation of fluid within the peritoneal cavity is called as ascites.10 The most common cause of ascites is hepatic cell failure and is considered as the cardinal sign of portal hypertension.10 Though the liver cell failure is envisioned to be the major cause of ascites, others include tuberculosis, malignancy, renal failure , heart failure , pancreatic causes and others.11 The word ‘ascites’evolved from “askos” in Greek, which imply“a sac or a wine bag”.12. 3.2 ANATOMY OF PERITONEAL CAVITY The largest serous membrane in our body is the peritoneum.13 In case of females it is opened at the lateral ends of the either fallopian tubes while in males it forms a closed sac.14 It is made up of a layer of flattened mesothelial cells which rests on a layer of loose connective tissue.14 The peritoneum consists of two layers namely. 1. Visceral peritoneum - the inner layer and it wraps around the organs which are situated inside the intra-peritoneal cavity 2. Parietal peritoneum - the outer layer and is attached to the abdominal wall.14 The space formed in between these two layers of the peritoneum is called as the peritoneal cavity.14. 5.
(19) 6.
(20) 3.3 PATHOPHYSIOLOGY OF ASCITES 3.3.1 STARLING FORCES:15 As early as 1826 E. H. Starling et al15 ,The British Physiologist, demonstrated the principle of movement of fluids from the capillaries to tissue and from tissue to the capillaries . This still plays an important role in understanding the pathophysiology of ascites. In honor of him, the primary forces that define the fluid movement across a membrane are called as the Starling’s forces. They are. 1. The capillary hydrostatic pressure- it moves fluid outward from the capillaries through the capillary membrane to the tissue spaces. 2. The interstitial fluid hydrostatic pressure-it moves fluid inward from the tissue space through the capillary membrane in to the capillaries. 3. The capillary plasma colloid osmotic pressure - it causes osmosis of fluid inward through the capillary membrane in to the capillaries. 4. The interstitial fluid colloid osmotic pressure-it causes osmosis of fluid outward through the capillary membrane into the tissue spaces.. A dynamic balance between these forces plays a major role in the pathogenesis of occurrence of ascites.. The amount of peritoneal fluid, under any normal. circumstance is influenced by the balance between the intravascular forces namely, hydrostatic pressure which tends to push the fluid away from the intravascular compartment in to the peritoneal cavity and the colloid osmotic pressure which is dependent predominantly on plasma protein(albumin) concentration which tends to retain fluid within the vascular compartment. Ascites occurs when thebalance between 7.
(21) these above mentioned forces is lost in the form of increase in the. hydrostatic. pressure as seen in Portal hypertension, Constrictive pericarditis, and Decompensated Cardiac Failure or decrease in serum albumin level as seen in conditions of cirrhosis, nephrotic syndrome ,kwashiorkor.. 3.3.2 CIRRHOTIC ASCITES: The theories explaining the pathophysiology of ascites formation in cirrhosis are16 1. Underfilling theory 2. Overflow theory 3. Peripheral arterial vasodilation theory. 8.
(22) 9.
(23) 3.3.2.1 UNDERFILLING THEORY: The classical Underfilling theory suggests that the formation of ascites leads to circulatory hypovolemia leading to reabsorption of sodium and thereby causing secondary water retention.17Lieberman et al have observed that few of the cirrhotic patients have increased circulatory volume which were not reduced by the usage of diuretics.18,19 During the course of diuresis, there was no actual change in the hepatic wedge pressure which is considered to be the index of portal hypertension.17 In experimental cirrhosis it has been shown already that the sodium and water retention through the kidneys and expansion of the volume precedes the ascites formation which is contradictory to the concept of underfilling theory20.. 10.
(24) 3.3.2.2. OVERFLOW THEORY:. This led to the newer concept of overflow theory which suggests that the reabsorption of sodium and water retention is the initial primary phenomenon leading on to the secondary ascites17 this theory was supported by the experiments done by Levy and associates21,22 which showed in dogs with nitrosamine induced cirrhosis, that the ascites formation was preceded by the renal retention of sodium which was assessed by repeated abdominal peritoneal paracenteses. Though the above experiments supported the overflow theory, the reason behind the primary sodium reabsorption and water retention remained obscure. Further this theory could not explain the reason behind stimulation of sympathetic nervous system, Activation of RAAS (Renin -angiotensin- aldosterone system) and release of Vasopressin20.. 11.
(25) 12.
(26) 3.3.2.3 PERIPHERAL ARTERIAL VASODILATION THEORY: The latest peripheral arterial vasodilation theory has been proposed as both the underfilling and overflow theories could not explain the exactcause behind the sodium and water reabsorption.17 cirrhotic patients are known to have peripheral arterial vasodilation with decreased arterial blood pressure with normal to high cardiac output23. In cirrhosis Arterio-venous fistula occurs in splanchnic, dermal and in pulmonary circulation.23 In humans, peripheral vasodilation accompanying an arteriovenous fistula causes renal sodium retention and secondary water reabsorption.24 so cirrhotic patients having peripheral arterial vasodilation and arterio-venous fistula have sodium retention and secondary water absorption. The absolute increase in plasma volume secondary to the sodium and water retention is not sufficient to compensate the enlarged arterial vascular compartment and this can be explained as the reason for stimulation of AVP , renin and aldosterone release25. nitric oxide is considered to be one of the important mediator for the peripheral vasodilation and sodium retention in the pathophysiology of cirrhosis.26 According to modern concept27 all the above mentioned three theories are necessary to explain pathophysiology of development of ascites in same patient with cirrhosis depending on the disease evolution time as mentioned below: • Vasodilation theory -. In pre ascites phase. • Overflow theory. -. In initial month of developing ascites in. -. ascites of longer duration.. cirrhosis • Underfill theory. 13.
(27) PATHOGENESIS OF ASCITES FORMATION IN CIRRHOSIS. 14.
(28) 3.3.3 NON CIRRHOTIC ASCITES: This includes all the non-hepatic causes of Ascites too, together with the other liver conditions excepting Cirrhosis.. 3.3.3.1 Malignant ascites. The main pathophysiology behind the accumulation of ascitis fluid in malignant conditions is increase in the permeability of blood vessels and impaired lymphatic drainage.28 The efficacy of the lymphatic system to drain the intraperitoneal fluid is overwhelmed by the increase in fluid within the peritoneal cavity by increased vascular permeability and particularly more intense when the lymphatic drainage is obstructed by increasing tumour load.28 The increased vascular permeability in addition to increase in capillary membrane surface causes increase in accumulation of fluid within peritoneal cavity and subsequent increase in intraperitoneal protein concentration leads to increased intraperitoneal oncotic pressure. This sequence is due to the biologically active peptides released by tumour cells like Vascular endothelial growth factor(VEGF) & basic fibroblast growth factor FGF29. 15.
(29) 16.
(30) 3.3.3.2 Cardiac ascites The pathophysiology of development of ascites in cardiac failure is similar to that of ascites in cirrhosis. In heart failure arterial underfilling occurs secondary to decrease in cardiac output, whereas in cirrhosis, arterial underfilling occurs secondary to peripheral arterial vasodilation & decrease in systemic vascular resistance(as explained above) and consequently stimulation of neurohumoral axis occurs which results in water and sodium retention leading to ascites.32. 3.3.3.3 Tuberculous ascites The tubercle bacilli entry into the peritoneal cavity is most commonly by hematogenous spread, usually from a pulmonary focus .Other less common mechanisms include transmural spread from diseased bowel, infected abdominal lymph nodes through lymphatic channels or from tuberculous salpingitis.30 In addition to ascites which is the wet form of peritoneal tuberculosis, fibrotic form and encysted form or a combination of all the three types can also occur in tuberculosis of peritoneum.31. 17.
(31) 3.3.3.4 Pancreatic ascites: In patients with pancreatic ascites, fluid accumulation in the peritoneal cavity is by leakage of pancreatic juice into the peritoneal cavity, and is contemplated to be the one of the major manifestation of pancreatic disruption.33 This occurs due to the action of the digestive enzymes in the pancreatic juice which digest in the tissues which comes in to their way and when it digests its own pancreatic wall it results in ascites . when the body, walls off that pancreatic juice leak it results in pseudocyst.33 The pancreatic ascites mainly occurs in conditions of chronic pancreatitis in as much as 95 percent of the cases. Concomitantly,50 percent of patients with pancreatic ascites have a leaking pseudocyst.33. 18.
(32) 3.4 DIAGNOSIS OF ASCITES The evaluation of a patient with ascites includes a thorough clinical history, thorough complete physical examination, a diagnostic abdominal paracentesis of the ascitic fluid followed by analysis and imaging studies of the abdomen to find the causative factorfor development of ascites.34 Paracentesis should be performed in all adult patients who are. with new onset ascites of unknown cause. Diagnostic. abdominal paracentesis is the most prompt and costeffective method to determine the cause of new onset ascites.35 The various other tests done in ascitic fluid are tabulated below as routine , optional, unusual and unhelpful tests. 36. ROUTINE. OPTIONAL. UNUSUAL. UNHELPFUL. Cell count. Culture. TB smear & culture. pH. Albumin. Glucose. Cytology. Lactate. Total protein. Gram stain. Bilirubin. Glycosamino glycan. Amylase. Triglycerides. Fibronectin. LDH. Alpha 1 antitrypsin Cholesterol. Of the tests mentioned above,the two tests highlighted in the study are ascitic fluid total protein AFTP and ascitic fluid albumin to find SAAG-Serum ascitic fluid albumin gradient.. 19.
(33) 3.5 EXUDATE/TRANSUDATE The traditional way of classification of ascites is, with those with vascular outflow obstruction as transudative ascites and those without vascular outflow obstruction but with peritoneal membrane involvement as exudative ascites.37 By large studies it was confirmed that the exudative and transudative ascites had characteristic ascitic fluid protein concentration.37 Depending on the protein concentration in ascitic fluid, it can be classified as37 1) Transudative ascites which has AFTP ascitic fluid total protein concentration less than 2.5 g/dl 2) Exudative ascites which has AFTP ascitic fluid total protein concentration ≥ 2.5 g/dl.. The various etiological causes of ascites can be classified as exudative andtransudative as follows37 TRANSUDATIVE. EXUDATIVE. Heart failure. Peritoneal carcinomatosis. Hepatic vein occlusion. Pancreatic ascites. Inferior vena cava occlusion. Tuberculous peritonitis. Chronic liver disease. Chylous ascites. Nephrotic syndrome. Myxedema. Metastatic cancer in liver. Eosinophilic gastroenteritis. Veno-occlusive disease of liver. Coccidioidal peritonitis. 20.
(34) 3.5.1 LIMITATION. OF. TRANSUDATIVE. AND. EXUDATIVE. CLASSIFICATION OF ASCITES: 1. The ascitic fluid total protein concentration does not rise much during the course of spontaneous bacterial peritonitis. It remains stable before, during and after infection. Infact, patients with the lower levels of ascitic fluid protein concentrations are the most susceptible to spontaneous bacterial peritonitis6. 2. In cases of patient with cirrhosis who have a significantly high serum protein concentration will have a relatively high AFTP ascitic fluid protein concentration. Almost 20% of samples in cirrhotic patients will have relatively high levels of ascitic fluid protein concentration > 2.5 g/dl.5 3. In almost a third of patients with malignant ascites, the ascitic fluid accumulation is caused by hepatocellular carcinoma or massive liver metastasis and there is a low protein concentration in ascitic fluid in these patients4. 4. During diuresis, the AFTP ascitic fluid total protein concentration raises in patients with conditions of chronic liver disease and have a total protein concentration greater than 2.5 g/dl by the end of diuretic therapy3 . 5.. In cardiac ascites, the AFTP ascitic fluid protein concentration is > 2.5 g/dl eventhough it is classified under transudative ascites.2. 21.
(35) 3.6 SERUM ASCITES ALBUMIN GRADIENT Due to the above-mentioned limitations, it leads to the newer classification of ascites on the basis of estimating serum ascitic fluid albumin gradient(SAAG) into high SAAG and low SAAG. In contrast to the ascitic fluid total protein, SAAG categorise fluid by the presence or absence of portal hypertension. The Starling hypothesis is the underlying physiology behind the estimation of SAAG.38 The SAAG is based on the principle of oncotic – hydrostatic pressure balance. The abnormallyelevated hydrostatic pressure gradient between the portal bed and the ascitic fluid results in the development of portal hypertension.38Similarly, ahuge difference must be present between the intravascular and ascitic fluid the oncotic forces.38It is Albumin which exerts a greater oncotic pressure than that exerted by other proteins. Thus, the pressure within the porta system correlates directly with the difference between the serum and the ascitic fluid albumin concentration38.. The ascites can be categorised based on serum ascitic fluid albumin gradient SAAG as • high SAAG ascites with values greater than or equal to 1.1 g/dl( i.e. ascites with portal hypertension) • Low SAAG ascites with values less than 1.1g/dl ( i.e. ascites without portal hypertension). 22.
(36) The various causes of ascites can be classified as high SAAG ascites and low SAAG ascites as follows39,40.. HIGH SAAG(VALUE ≥1.1 gm/dl). LOW SAAG (VALUE<1.1 gm/dl). Cirrhosis. T.B peritonitis. Cardiac failure. Peritoneal carcinomatosis. Massive liver metastasis. Post-operative lymphatic leak. Alcoholic hepatitis. Bowel obstruction/ infarction. Fulminant hepatic failure. Pancreatic ascites. Fatty liver of pregnancy. Nephrotic syndrome. Portal vein thrombosis. Biliary ascites. Sinusoidal obstruction syndrome. Serositis in connective tissue disorder. Budd chiari syndrome. Myxoedema. 23.
(37) 3.6.1 PORTAL HYPERTENSION: Portal Hypertension is characterized by obstruction to the portal vein flow resulting in elevation of portal vein pressure.41 The primary factor which determines the portal hypertension is the resistance to the portal venous flow and is determined by the decreased synthesis of Nitric oxide in the intrahepatic circulaton.41 The other factor which determines portal hypertension is the splanchnic arterial vasodilation causing increased portal venous blood flow.41 The elevated portal vein pressure results in a syndrome that manifests as variceal haemorrhage, ascites and portosystemic encephalopathy.42 The portal hypertension classified as prehepatic, hepatic and post hepatic depending on the level of obstruction to the portal blood flow.43 The cirrhosis is the most common cause of intrahepatic cause of portal hypertension of which is caused by alcoholic cirrhosis, non-alcoholic fatty liver disease induced cirrhosis and Hepatitis B virus induced cirrhosis.44 The cavernoma of the portal vein is the most common cause of post hepatic portal hypertension and is due to acute portal vein thrombosis and it manifests as portosystemic shunts, splenomegaly and reversal of flow in the unaffected intrahepatic portal veins.45 The example for portal hypertension due to post hepatic cause is Budd chiari syndrome.46 Portal hypertension is diagnosed when HVPG is more than 5 mm of hg which is calculated by the difference between WHVP which is a measure of sinusoidal hepatic pressure and the FHVP which reflects the systemic pressure.46. The pressure gradient between the portal vein and the intra abdominal portion of Inferior venae cava is represented by HVPG.47 The FHVP and the WHVP is calculated by catheterization of one of the free hepatic vein and measuring the 24.
(38) pressure in free position and the pressure in the wedged position using a balloon catheter.48 The difference between the above pressures are used to calculate the HVPG and the diagnosis of portal hypertension is made.48 According to the findings of Dittrich et al49 ,The SAAG can be used to predict the portal hypertension as there was significant correlation between HVPG and SAAG.. 3.6.2 LIMITATIONS OF SAAG:. 1. In a study conducted by jiang et al50 the sensitivity and specificity of SAAG increased when the cut off value of SAAG was raised from 1.1 to 1.25 g/dl. 2. In a study conducted by kajani et al.7 showed that eventhough SAAG value >1.1 was correlated with patients with portal hypertension due to alcoholic cirrhosis, but it did not correlate with the patients with portal hypertension due to nonalcoholic cirrhosis. 3. According to Goyal et al.8 SAAG could not play a role in identifying the etiology of ascites in cases caused due to mixed etiology. 4. SAAG could not differentiate between ascites due to malignancy and ascites due to tuberculosis as suggested by Alba et al.9 5. In a study conducted by khandwalla et al.51 on patients with low SAAG with previously established cirrhosis showed that its utility is less helpful than with patients without cirrhosis and advised for further studies for low SAAG cut off values.. 25.
(39) As both the methods used in assessing the ascitic fluid analysis like ascitic fluid total protein and serum ascitic fluid albumin gradient has disadvantages, there is a need for a study to compare the diagnostic accuracy of both the parameters in evaluating the etiology of ascites.. 26.
(40) 4. PATIENTS AND METHODOLOGY. 4.1 CHARACTERISTICS OF THE STUDY. The study of A COMPARATIVE STUDY OF SERUM ASCITIC FLUID ALBUMIN GRADIENT WITH ASCITIC FLUID TOTAL PROTEIN IN HEPATIC AND NON-HEPATIC CAUSES OF ASCITES IN GVMCH was carried out among 100 patients who were admitted in the medical ward under Department of General Medicine in Government Vellore Medical College Hospital in Vellore.. Study Place. :. General Medicine wards. Study Design. :. single centre observational hospital based study. Number Of Subjects Included. :. 100. Study Duration. :. October 2017 to September 2018. Ethical Committee Approval. : Approved. 27.
(41) 4.2 CHARACTERISTICS OF THE PATIENTS INCLUSION CRITERIA: • All patients with ascites due to any cause previously not established. • Patients with a normal coagulation profile. EXCLUSION CRITERIA: • patients with severe coagulopathy or with disseminated intravascular coagulation(DIC) • Ascitic patients with blunt injury to abdomen • Ascitic patients with Hepatic encephalopathy or acute gastro intestinal bleeding. • Ascitic patients on diuretic therapy before ascitic fluid analysis.. 28.
(42) 4.3 BRIEF EXPLANATION OF THE PROCEDURE A total of hundred patients who were admitted in General Medicine wards of Government Vellore Medical College Hospital within a period of one year with ascites, whose etiological diagnosis has not been established previously, were studied. Written Informed consent was obtained from the patient in the language which patients could understand and the study was commenced after getting clearance from the ethical committee of Government Vellore Medical College.. On entry to the study, complete history and a thorough clinical examination was done for all the patients. Hundred patients who matched the set criteria were included in this study. Ascitic fluid and blood sample were collected simultaneously and examined for ascitic fluid albumin, ascitic fluid total protein and serum albumin. The Bromo cresol green method52 was used to calculate ascitic fluid albumin and serum albumin and Biuret method53 was used to measure ascitic fluid total protein on automated chemistry analyser, Selectra-2.. SAAG was calculated by using the following formula9: SAAG = Serum Albumin - Ascitic fluid albumin All the 100 patients underwent various other diagnostic investigations like ultra sound imaging and CT scan as of required and aetiology of the ascites were established. Then, the diagnostic accuracies of AFTP and SAAG were calculated and compared based on the already established diagnosis.. 29.
(43) 4.4 BRIEF EXPLANATION OF TECHNIQUE 4.4.1 ABDOMINAL PARACENTESIS:54 The most rapid and cost-effective method of diagnosing the cause of ascites is abdominal paracentesis followed by effective clinical examination. Even though cirrhotic patients have abnormal coagulation parameters they don’t bleed by abdominal paracentesis unless the needle is entered in to a vessel site, the commonest complication of abdominal paracentesis is abdominal wall haematoma formation which is about 20-25 percent.. 4.4.2 PATIENT POSITION:54 The factors which determine the patient position during paracentesis are the thickness of abdominal wall and the volume of ascitic fluid. • Large volume ascites- supine position • Moderate volume ascites-lateral decubitus position and tapped in midline or in lower left or right quadrant of abdomen • Minimal Ascites- face down position or under the guidance of Ultrasound. 4.4.3 SITE OF NEEDLE ENTRY: The left lower quadrant of abdomen is preferred than right lower quadrant as the latter has distended caecum secondary to lactulose therapy and more likely to have surgical scar secondary to appendicectomy.55. In case of therapeutic paracentesis, placing the needle in the lower quadrant when compared to midline, yields more amount of fluid as these quadrants are in the 30.
(44) dependent position. The site of needle entry should always be away from a surgical scar as the bowel loops may be adhered to thescar and thereby to prevent needle entry into the adhered bowel.36 The safest site is two fingerbreadths anterior and two finger breadths medial to the anterior superior iliac spine in left lower quadrant.55. 4.4.4 CHOICE OF NEEDLE:54 Ideally 1.5 inch 22G needle is preferred. In obese patients a needle of size 2.5 inches, longer than the usual, may be used as the abdominal wall thickness is more. steel needles, more than the plastic sheathed cannulas, are preferred as the latter might obstruct the flow of fluid by kinking once the cannula is removed.. 31.
(45) 4.4.5 TECHNIQUE OF PARACENTESIS:54. Sterile gloves should be utilised while doing abdominal paracentesis procedure. The site of needle entry and surrounding area all over in the quadrant should be draped with pivot iodine solution. Local anaesthetic should be infiltrated in the site of entry from skin to subcutaneous tissue. The Z tract technique is used to avoid the leak of fluid from the site of needle entry after the withdrawal of needle. According to this technique,the skin has to be stretched 2 cm down and then the needle with syringe has to be advanced, with the plunger of the syringe being retracted simultaneously. The stretched skin should be released only when the ascitic fluid flows in to the syringe and the needle has entered the peritoneum. The needle should be advanced slowly through the anterior abdominal wall at an increment of 5mm. Slow insertion of the needle prevents injury to the bowel loops as it allows the bowel to move away from the needle. Intermittent suctioning of the syringe should be done rather than continuous suctioning as the latter can cause obstruction to the flow by causing adherence of the bowel loop to the tip of the needle once it enters the peritoneum due to negative pressure. About 30 ml of ascitic fluid is aspirated and sent for various diagnostic investigations mentioned above.. 32.
(46) 33.
(47) 4.5 STUDY PARAMETERS •. Age. •. Sex. •. Serum Albumin. •. Ascitic Fluid Total Protein. •. Ascitic Fluid Albumin. •. SAAG(Serum- Ascitic Fluid Albumin Gradient). 4.6 DATA COLLECTION AND STATISTICAL ANALYSIS: 4.6.1 Statistical Methods: Descriptive analysis and Inferential Statistical analysis has been carried out in this study. Results of continuous measurements are presented on Mean ± SD (Min-Max) and results of categorical measurements are presented in Numbers (%). Significance is assessed at 5 % level of significance. The following assumptions on data is made, 1. Dependent variables should be normally distributed, 2. Samples drawn from the population studied should be random, Cases of the samples studied should be independent. Analysis of variance (ANOVA) has been used to find the significance of study parameters between three or more groups of patients in the study, Chi-square/ Fisher Exact test has been used to find the significance of study parameters on categorical scale between two or more groups in the study.. 34.
(48) 4.6.2 SIGNIFICANT FIGURES + Suggestive significance (P value: 0.05<P<0.10) * Moderately significant (P value:0.01<P ≤ 0.05) ** Strongly significant (P value: P≤0.01). 4.6.3 STATISTICAL SOFTWARE The Statistical software namely SAS 9.2, SPSS 15.0, Stata 10.1, MedCalc 9.0.1, Systat 12.0 and R environment ver.2.11.1 were used for the analysis of the data and Microsoft word and Excel have been used to generate graphs, tables etc.. 35.
(49) 5. RESULTS AND OBSERVAT ION. Gender wise distribution of Ascites. [VALUE]. [VALUE]. F. M. Figure 1: Gender wise distribution of Ascites. The figure shows the distribution of ascites among the males and females in the study and it shows males are in increased proportion when compared to females, with males occupying 70% of the total patients studied and females occupy the remaining 30%. The sex ratio between males and females with ascites in this study is 2.33.. 36.
(50) Number of Patients in Percentage 35 30. 29. percentage. 25. 27. 20 15. 15. 14. 10. 10. 5 0. 3. 1 11 - <21. 21 - <31. 31 - <41. 41 - <51. 51 - <61. 61 - <71. 71 - <81. 1 81 - <91. Age of patient in years. Figure 2: Age wise distribution of ascites Mean ± SD: 49.51±13.73. The figure shows the distribution of ascites among various age groups. The ascites predominantly occurs in the age group 41-50years occupying about 29 percent of the total patients studied.. 37.
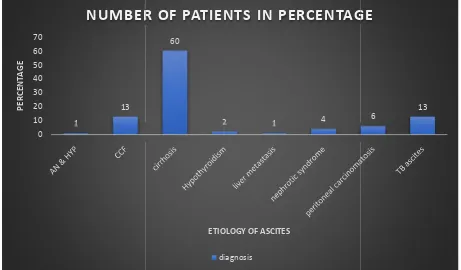
(51) NUMBER OF PATIENTS IN PERCENTAGE 70. 60. PERCENTAGE. 60 50 40 30 20 10 0. 13 1. 2. 1. 4. 6. 13. ETIOLOGY OF ASCITES diagnosis. Figure 3: Etiology wise distribution of ascites. The figure depicts the distribution of various etiology of ascites in the patients studied. The cirrhosis occupies the maximum with 60%, liver metastasis ,Antenatal with Hypertension occupies the least with 1% each.. 38.
(52) Etiology of cirrhosis 50 45. 45. 40 35 30 25 20 15. 11. 10 4. 5 0 cirrhosis(alcoholic). cirrhosis(cryptogenic). cirrhosis(HBV). Figure 4: Etiology of cirrhosis causing ascites. This figure shows the etiology of cirrhosis causing ascites and shows alcoholic liver disease as the major etiology.. 39.
(53) Distribution of ascites with etiology and gender 50 45 44. 40 35 30 25 20 15. 16. 10 5 0. 10 1. 0. 3. 1. 1. F. 0. 1. 1. 3. 3. 3. 5. 8. M. Figure 5: Gender wise distribution of ascites along with etiology. The figure shows distribution of ascites with aetiology and gender wise. Among ascites with cirrhosis about 44 were males and while remaining 16 were females.. 40.
(54) Number of Males in percentage 70. 60. PERCENTAGE. 50. 40. 30. 20. 10. 0 cirrhosis. CCF. TB ascites. nephrotic syndrome. peritoneal Hypothyroidism liver metastasis carcinomatosis. ETIOLOGY OF ASCITES. Figure 6: Etiology of ascites among males. The figure indicates the distribution of ascites among the male patients studied. cirrhosis is the major cause of ascites in males with 62.9 percentage followed by CCF and TB ascites.. 41.
(55) number of females in percentage 60. 50. PERCENTAGE. 40. 30. 20. 10. 0 cirrhosis. TB ascites. CCF. peritoneal carcinomatosis. AN & HYP. Hypothyroidism. nephrotic syndrome. ETIOLOGY OF ASCITES. Figure 7: Etiology of ascites in females. The figure shows distribution of ascites among females. Cirrhosis is the major cause of ascites in females with 53.3% followed by TB ascites, CCF and peritoneal carcinomatosis.. 42.
(56) Serum albumin level and number of patients 50 45 40. percentage. 35 30 25 20 15 10 5 0 <2. 2.1-3. 3.1-4. >4. serum albumin levels Serum albumin level in percentage. Figure 8: Serum albumin levels of patients studied Mean ± SD: 2.91±0.596. The figure shows the distribution of serum albumin among the patients studied and about 90% of the patients had serum albumin from 2-4.. 43.
(57) Ascitic Fluid albumin and number of patients in percentage 60 53. PERCENTAGE. 50. 40. 30 24 21 20. 10 2 0 <1. 1.1-2. 2.1-3. 3.1-4. ASCITIC FLUID ALBUMIN LEVEL. Figure 9: Ascitic fluid albumin of patient studied Mean ± SD: 1.496±0.671. The figure shows the distribution of ascitic fluid albumin among the patients studied and 53 percent of the patients had ascitic fluid albumin from 1-2.. 44.
(58) comparison of results between SAAG and AFTP 120. 100. PERCENTAGE. 80. 60. SAAG AFTP. 40. 20. 0 SPECIFICITY. SENSITIVITY. PPV. NPV. DIAGNOSTIC ACCURACY. Figure 10: Comparison of results between SAAG and AFTP The figure shows the comparative results between AFTP and SAAG in evalvuating etiology of ascites.. 45.
(59) Diagnostic accuracy for various aetiologies of ascites by AFTP & SAAG 120. 100. 80. 60. 40. 20. 0 Cirrhosis. CCF. TB ascites. SAAG. Nephrotic syndrome. Peritoneal Carcinomatosis. Miscellaneous. AFTP. Figure 11: Comparison of diagnostic accuracy of AFTP and SAAG for individual aetiology of ascites The figure shows the comparison of diagnostic accuracies of various etiology of ascites by AFTP and SAAG.. 46.
(60) Figure 12:Scatter Plot of SAAG and AFTP level in the study population P value High SAAG. Low SAAG. High AFTP. 24 (53.3%). 21 (46.7%). 45. Low AFTP. 46 (83.6%). 9 (16.4%). 55. 70. 30. 100. 0.002*. 47.
(61) Table 1: AFTP of patients studied The table shows the distribution of ascitic fluid total protein among the patients studied, with 55% having AFTP value less than 2.5.. AFTP. No. of patients. %. <2.5. 55. 55.0. ≥2.5. 45. 45.0. Total. 100. 100.0. Mean ± SD: 2.571±0.847. 48.
(62) Table 2: SAAG of patients studied The table shows the distribution of SAAG among the patients studied and it shows that 70 % of the patients had a SAAG value greater than 1.1.. SAAG. No. of patients. %. <1.1. 30. 30.0. ≥1.1. 70. 70.0. Total. 100. 100.0. Mean ± SD: 1.418±0.494. 49.
(63) Table 3: SAAG Level With etiology This table shows the classification of ascites based on SAAG levels in to low and high SAAG based on etiology. ETIOLOGY. SAAG<1.1. SAAG≥1.1. P value. Cirrhosis. 8 (26.7%). 52 (74.3%). <0.001***. CCF. 1. 12 (17.1%). <0.001***. TB ascites. 12 (40.0%). 1. 0.337. Nephrotic syndrome. 3. 1. -. Peritoneal carcinomatosis. 5. 1. 0.363. Hypothyroidism. 2. -. Liver metastasis. 1. -. AN & HTN. 1. -. 50.
(64) Table 4: AFTP levels along with aetiology The table shows the classification of ascites based on the AFTP levels. ETIOLOGY. AFTP<2.5. AFTP≥2.5. p value. Cirrhosis. 39 (70.9%). 21 (46.7%). <0.001***. CCF. 5 (9.1%). 8 (17.8%). 0.001**. TB ascites. 4 (7.3%). 9 (20.0%). <0.001***. Nephrotic syndrome. 2. 2. 0.182. Peritoneal carcinomatosis. 1. 5. 0.004**. Hypothyroidism. 2. Liver metastasis. 1. AN & HTN. 1. 51.
(65) Table 5 : Classification of ascites based on pathophysiology The table shows the classification of aetiology of ascites based on their pathophysiology as with portal hypertension and without portal hypertension.. Portal Hypertension. No.. Without portal hypertension. No.. Cirrhosis. 60. Peritoneal carcinomatosis. 6. CCF. 13. TB ascites. 13. Liver metastasis. 1. Nephrotic syndrome. 4. Hypothyroidism. 3. AN & HTN. 52.
(66) Table 6 : Classification of ascites as exudates and transudate The table shows the classification of various aetiologies of ascites as transudate and exudative ascites based on their pathophysiology.. Exudate. No.. Transudate. No.. Peritoneal carcinomatosis. 6. Cirrhosis. 60. TB ascites. 13. CCF. 13. Liver metastasis. 1. Nephrotic syndrome. 4. Hypothyroidism. 2. AN & HTN. 1. 53.
(67) Table 7: Comparison of SAAG and portal HTN The table shows the comparison of serum ascites albumin gradient in patients with and without portal hypertension. Specificity,sensitivity, positive predictive value, negative predictive value and diagnostic accuracy of SAAG is calculated from the table.. PATHOPHYSIOLOGY HIGH SAAG(≥1.1). LOW SAAG(<1.1). Portal HTN. 67(True Positive). 10(False Negative). Without Portal HTN. 3(False positive). 20(True Negative) 23. 70. 30. 54. 77. 100.
(68) True positive Sensitivity =. = 67/77 = 87.01% (True positive + False negative). True negative Specificity =. = 20/23 = 86.96% (False positive + True negative). True positive Positive predictive value =. = 67/70 = 95.71% (True positive+ False positive). True Negative Negative predictive value = = 20/30 = 66.67% (True Negative + False Negative) (100) (True Positive + True Negative) Diagnostic accuracy=. = 87% Total number of cases. 55.
(69) Table 8: Comparison of AFTP and Pathophysiology. The table shows the comparison of ascitic fluid total protein as transudate and exudate based on its pathophysiology. Specificity,sensitivity, positive predictive value, negative predictive value and diagnostic accuracy of Ascitic fluid total protein is calculated from the table.. PATHOPHYSIOLOGY. AFTP≥2.5. AFTP<2.5. Exudate. 14 (True Positive) 8 (False Negative) 22. Transudate. 31. (False 47. positive). Negative). 45. 55. 56. (True 78. 100.
(70) True positive Sensitivity =. = 14/22 = 63.64% (True positive + False negative) True negative. Specificity =. = 47/78 = 60.26% (False positive + True negative) True positive. Positive predictive value =. = 14/45 = 31.11% (True positive+ False positive). True Negative Negative predictive value = = 47/55 = 85.45% (True Negative + False Negative) (True Positive + True Negative)(100) Diagnostic accuracy=. = 61% Total number of cases. 57.
(71) Table 9 : Comparison of diagnostic accuracy of AFTP and SAAG for individual aetiology of ascites The table shows the diagnostic accuracy of SAAG and AFTP of various etiology of ascites in this study.. ETIOLOGY. SAAG. AFTP. Cirrhosis. 86.67. 65. CCF. 92.31. 38.46. TB ascites. 92.31. 69.23. 75. 50. 83.33. 83.33. 100. 100. Nephrotic syndrome Peritoneal Carcinomatosis Miscellaneous. p=0.001 (less than 0.05 which is statistically significant). 58.
(72) Table 10: Comparison of SAAG for hepatic and non-hepatic etiology of ascites The table compares the number of patients with high and low SAAG value between the Hepatic and Non-hepatic causes of Ascites.. SAAG <1.1. >1.1. NON HEPATIC CAUSES. 22. 17. HEPATIC CAUSES. 8. 53. Odd’s Ratio – 8.5 SAAG values in Hepatic causes of Ascites are mostly more than 1.1 , with an odd’s ratio of 8.5 when compared with non-hepatic causes.. 59.
(73) Table 11: Comparison of AFTP for hepatic and non-hepatic etiology of ascites The table shows the comparison of number of patients with AFTP value among Hepatic and Non-hepatic causes of Ascites.. ASCITIC FLUID TOTAL PROTEIN <2.5. >2.5. NON HEPATIC CAUSES. 14. 25. HEPATIC CAUSES. 41. 20. 60.
(74) Table 12 : Mean, Standard Deviation And Standard Error Of Mean Of AFTP and SAAG The table shows the mean, standard deviation and standard error of mean of SAAG and AFTP.. PARAMETERS. SAAG. AFTP. MEAN. 1.42. 2.571. STANDARD DEVIATION. 0.049. 0.0847. STANDARD ERROR OF MEAN. 0.494. 0.8469. 61.
(75) 6. DISCUSSION. DIAGNOSTIC ACCURACY: The diagnostic accuracy of SAAG and AFTP among the patients with ascites for evaluating the etiological causes of ascites is determined and was found to be 87% and 61% respectively which showed that SAAG -Serum Ascitic Fluid Albumin Gradient is superior to AFTP in diagnosing the etiological cause of ascites. This is consistent with the findings of numerous other studies done in India and countries outside India byGoyal AK et al8, Beg et al1, Runyon et al39, Laudanno et al56, Akriviadis et al57, Rana SV et al58, ,Younas et al61, Al-Knawye et al60 andDas BB et al59.. 62.
(76) DIAGNOSTIC ACCURACY VALUES OBTAINED IN OTHER STUDIES. S.NO STUDY. PLACE. OF SAAG. STUDY. %). (in AFTP (in %). 1. Al-Knawye et al60. Saudi. 91. 84. 2. Goyal AK et al8. India. 97. 72. 3. Laudanno et al56. spain. 95.7. 65.6. 4. Akriviadis et al57. Greece. 98. 52. 5. Runyon et al39. America. 96.7. 55.6. 6. Younas et al61. Pakistan. 96. 56. 7. Rana SV et al58. India. 86. 72. 8. Beg et al1. India. 96. 68. 9. Das BB et al59. India. 80. 63. 10. Present study. India. 87. 61. The obtained P value was found to be <0.001 suggesting superiority of SAAG when compared to AFTP which is statistically significant.. 63.
(77) SENSITIVITY: The sensitivity of SAAG and AFTP in this present study conducted was found to be 87.01 and 63.64 respectively. This results were consistent with the findings of studies conducted by Beg et al1, Rana SV et al58 and Younas et al61. This is contrast to the findings of study by Das et al59 which showed sensitivity of AFTP was greater than that of SAAG with sensitivity of AFTP was 95% while that of SAAG was 71 % only. SENSITIVITY VALUES OBTAINED BY VARIOUS STUDIES CONDUCTED. S.NO. STUDY. PLACE OF STUDY. SAAG (in %). AFTP (in %). 1. Beg et al1. India. 94.7. 65.6. 2. Rana SV et al58. India. 88. 56. 3. Younas et al61. Pakistan. 97. 53. 4. Das et al59. India. 71. 95. 5. Present study. India. 87.01. 63.64. 64.
(78) SPECIFICITY: The specificity of SAAG and AFTP in the present study was found to be 86.96 % and 60.26% respectively. This results were similar to that obtained by the study conducted by Das et al59 and younas et al61. This is contradictory to the findings of study by Rana SV et al58 where the specificity of AFTP was higher than that of SAAG. The specificity of AFTP was 88% while that of SAAG was 84%. The increase in specificity for AFTP compared to that of SAAG might be the cut off value of AFTP in the above mentioned study was 3 instead of 2.5 which was used in this study. SPECIFICITY VALUES OBTAINED BY VARIOUS STUDIES CONDUCTED. S.NO STUDY. 1. Das et al59. 2. PLACE STUDY. OF SAAG. AFTP. (in %). (in %). India. 92. 46. Younas et al61. Pakistan. 95. 70. 3. Rana SV et al58. India. 84. 88. 4. Present study. India. 86.96. 60.26. 65.
(79) POSITIVE PREDICTIVE VALUE: The positive predictive value (PPV) of SAAG and AFTP was found to be 95.71% and 31.11% respectively. This is consistent with the findings of study done by Rana SV et al58, Das BB et al59, Al-Knawye et al60, Khan Fy et al11 and Younas et al61 suggesting superiority of SAAG in determining the positive prediction of the test. POSITIVE PREDICTIVE VALUES OBTAINED BY VARIOUS STUDIES CONDUCTED. S.NO. STUDY. PLACE OF STUDY. SAAG (in %). AFTP (in %). 1. Khan Fy et al11. Qatar. 88. 63. 2. Rana SV et al58. India. 84. 82. 3. Al-Knawye et al60. Saudi. 80. 68. 4. Das et al59. India. 83. 48. 5. Younas et al61. Pakistan. 98.6. 86. 6. Present study. India. 95.71. 31.11. 66.
(80) NEGATIVE PREDICTIVE VALUE: The negative predictive value (NPV) of SAAG and AFTP was found to be 66.67 and 85.45% respectively. This is consistent with the findings of study done by Das et al59 with SAAG had negative predictive value of 85% while that of AFTP was 92%. This is contradictory to the findings obtained in the study by Rana SV et al58, Khan Fy et al11,Al-Knawye et al60 and Younas et al61 where the negative predictive value of AFTP was greater than that of SAAG. The low negative predictive value of SAAG to AFTP is due to more false negatives of SAAG value in this study that is out of the 30 patients who had Low SAAG only TWENTY(66.66%) had pathophysiology of ascites not related to portal hypertension while TEN (33.34%) had pathophysiology related to portal hypertension. Out of the TEN false negative, 8(80%) is of ascites due to cirrhosis while 1(10%) is of ascites due to cardiac etiology. Out of the EIGHT false negatives among ascites due to cirrhosis SIX are due to non alcoholic etiology. This observation is similar to that of Kajani et al7 which suggested that the SAAG value correlated well with the portal venous pressure in case of cirrhosis due to alcohol induced liver disease but not due to cirrhosis due to non alcoholic causes of liver disease.. 67.
(81) S.NO. STUDY. PLACE OF STUDY. SAAG (in %). AFTP (in %). 1. Das et al59. India. 85. 92. 2. Rana SV et al58. India. 87. 66. 3. Khan Fy et al11. Qatar. 96. 95. 4. Al-Knawye et al60. Saudi. 98. 96. 5. Younas et al. Pakistan. 90. 29. 6. Present study. India. 66.67. 85.45. 68.
(82) DISTRIBUTION OF ASCITES AMONG MALES AND FEMALES: The distribution of ascites among males and females show more preponderance to males when compared to females. In this study 70% were males and this is similar to the observation of Al-knawey et al60, younas et al61, jiang et al50 and khan et al11.. S.NO STUDY. PLACE STUDY. OF MALES (in FEMALES %) (in %). 1. Khan Fy et al11. Qatar. 67.3. 32.7. 2. Younas et al61. Pakistan. 72.04. 27.96. 3. Al-Knawye et al60. Saudi. 72.72. 27.28. 4. Jiang et al50. china. 54.46. 43.64. 5. Present study. India. 70. 30. 69.
(83) MEAN AGE OF INCIDENCE OF ASCITES: The ascites is predominantly distributed among the age group of 41-60 years occupying about 60 percent of the total population studied. The mean age group in the study was found to be 49.51±13.73 years. This is consistent with the findings of the various other studies done by Valdivia et al62, Younas et al61, Al-knawye et al60, Khan Fy et al11 and Jiang et al50.. S.NO. STUDY. PLACE STUDY. OF MEAN AGE. 1. Younas et al61. Pakistan. 57. 2. Jiang et al50. China. 56.82±14.69. 3. Khan Fy et al11. Qatar. 52.9±14.75. 4. Al-Knawye et al60. Saudi. 58.8±15.9. 5. Valdivia et al62. Peru. 46.9±19.6. 6. Present study. India. 49.51±13.73. 70.
(84) ETIOLOGY OF ASCITES: The distribution of ascites based on etiological cause in the study is as follows: 1. Cirrhosis – 60% 2. Cardiac failure-13% 3. Tuberculosis-13% 4. Nephrotic syndrome-4% 5. Peritoneal carcinomatosis-6% 6. Liver metastasis-1% 7. Hypothyroidism-2% 8. AN & Hypertension- 1% According to the studies conducted by Valdivia et al62 ,Beg M et al1, Shaikh et al63 , Younas et al61 cirrhosis is found to be the most common cause of ascites as in this study. The second most common cause of ascites in this study was found to be tuberculosis and cardiac failure while that of Shaikh et al63 , Younas et al61 showed that carcinomatosis was the second most common cause. The tuberculous ascites was found to be the second most common cause of ascites in the study conducted by Valdivia et al62 and Beg M et al.1 However the etiological classification is based on the hospital based studies and it represents only the tip of the iceberg seen in the general population.. 71.
(85) SERUM ALBUMIN LEVEL: The mean serum albumin level in this study was found to be2.91±0.596. this is similar to the findings obtained by Santhosh Kumar et al64 with mean serum albumin among patient with ascites as 2.87 ± 0.34. The reason for the low serum albumin can be attributed to the following reason: 1. As age of the patients increase, patients have lower the serum albumin value as suggested by Greenbalt65 and the mean age group in the study is 49 years. 2. The predominant patients have cirrhosis as the major etiological cause of ascites in the patients studied and as suggested by Gatta A et al66Hypoproteinemia, viz, hypoalbuminemia is associated with cirrhosis.. 72.
(86) CLASSIFICATION OF ASCITES BASED ON SAAG: The classification of ascites based on SAAG into high SAAG and low SAAG showed that 70 % of the patients studied had high SAAG. This finding is consistent with the findings of study by Shaikh et al63 which had 85 % of the studied patient had high SAAG suggesting that predominant cases of ascites have high SAAG and consequently portal hypertension. The SAAG value is high in most of the patients this can be attributed to the low mean serum albumin value. Among the patients with ascites having high SAAG the commonest etiology was found to be cirrhosis with 74.2% and cardiac failure with 17.1%. This is similar to that of finding obtained by khan et al11 with cirrhosis as the major cause of ascites among high SAAG ascites. The second most common cause of high SAAG ascites was found to be cardiac failure while in the study conducted by Khan et al11 showed it was massive hepatic metastasis.. The high SAAG value has correctly identified the pathophysiology of ascites as portal hypertension in 86.67 % of ascites due to cirrhosis and is consistent with observation of Beg M et al1 where it was about 92.59%. Among the ascites due to cardiac etiology the High SAAG value had identified about 92.31% as portal hypertension has its pathophysiology while the observations of Beg M et al1 showed that it had identified 100%. Among the patients with ascites having low SAAG the commonest aetiology was found to be tuberculous ascites with 40%. This is contradictory to the findings of. 73.
(87) Khan et al11 which had peritoneal carcinomatosis as the predominant cause of low SAAG ascites followed by tubercular ascites. This can be because India has more burden of tuberculosis according to the observation of John67, when compared to other countries and hence the tubercular ascites is more predominant among the low SAAG ascites compared to the other study which was done in the state of Qatar. The low SAAG value has correctly identified the pathophysiology of ascites as without portal hypertension in 92% of ascites due to Tuberculosis while that of Beg M et al1 was about 100%.. 74.
(88) CLASSIFICATION OF ASCITES BASED ON AFTP: The classification of ascites by ascitic fluid total protein into two groups based on their values in our study showed that 55% of the patients had AFTP<2.5 , this is similar to the findings obtained by Beg M et al1 where it was 68.42 % suggesting that predominant ascites had ascitic fluid total protein less than 2.5. This is contradictory to the findings of Younas et al61 which had only 48.38 % of patients having AFTP less than 2.5. Among the causes of AFTP<2.5 cirrhosis is the common cause and it accounts about 70.91% of the total ascites having AFTP<2.5 and it is similar to the finding obtained by Beg M et al1 which had about 80.76%. Among the causes of AFTP≥2.5, the most common cause is tubercular ascites according to Beg M et al1 contributing about 50%. This is contradictory to the finding obtained in the present study which showed cirrhotic ascites as the commonest cause contributing about 46.67%. CIRRHOSIS CAUSING ASCITES: The most common cause among cirrhosis causing ascites in our study was found to be secondary to alcohol aetiology. This is similar to the findings obtained by khan et al11 who had about 51.7 % of ascites was due to cirrhosis of alcoholic aetiology while in the present study it was about 45%. Further the most common cause of cirrhosis is due to alcoholic aetiology and in our study alcoholic cirrhosis accounts for 75% of total cirrhosis. This is similar to the results study obtained by Maskey et al68 which showed alcoholic cirrhosis as the most common cause of cirrhosis accounting for about 85.71%. This is contradictory to findings of Perz et al69 75.
(89) which suggested cirrhosis due to Hepatitis viruses as the commonest cause of cirrhosis. The incidence of cirrhosis is more in males when compared to females in our study. About 73.3% are males while 26.6% are females. This can be explained because males outnumber females in alcohol consumption as observed by Jauhar et al70 and further cirrhosis due to alcohol aetiology is the most common cause of cirrhosis in this study and it contributes about 75% of total cirrhosis.. 76.
(90) LIMITATIONS OF THE STUDY: The study has some limitations which are as follows: 1. The number of non-alcoholic cirrhosis involved in this study is very low only 15% of the total patient studied. 2. The sample size of this study is minimal. 3. The number of female patients included in the study is low compared to that of males. FURTHER SCOPE STUDY: The SAAG is an index of portal hypertension and so the correlation between High SAAG and complication of portal hypertension like oesophageal varices can be studied. Further whether, High SAAG can be used as a marker or not of portal hypertension can also be studied. The diagnostic accuracy of SAAG in non-alcoholic cirrhosis alone can also be studied.. 77.
(91) 7. CONCLUSION The SAAG is found to be superior to the traditional method of classifying. ascites based on AFTP in evaluating the etiology of ascites. • The ascites is classified on the basis of SAAG value in to high SAAG and low SAAG. • The sensitivity and Specificity of SAAG and that of AFTP in identifying the pathophysiology of ascites studied and found that SAAG had higher sensitivity and specificity compared to that of AFTP. • The diagnostic accuracy of SAAG and AFTP was compared and SAAG was found to be superior to AFTP and it was proved statistically significant.. 78.
(92) REFERENCES 1. Beg M, Hussain S, Ahmed N, Akhtar N. Serum ascites albumin gradient in the differential diagnosis of ascites. J Indian Acad Clin Med. 2001;2(1&2)(51-4). 2. Runyon BA. Cardiac ascites: a characterization. J Clin Gastroenterol. 1988 Aug;10(4):410–2. 3. Hoefs JC. Increase in ascites white blood cell and protein concentrations during diuresis in patients with chronic liver disease. Hepatol Baltim Md. 1981 Jun;1(3):249–54. 4. Runyon BA, Hoefs JC, Morgan TR. Ascitic fluid analysis in malignancyrelated ascites. Hepatol Baltim Md. 1988 Oct;8(5):1104–9. 5. Sampliner RE, Iber FL. High protein ascites in patients with uncomplicated hepatic cirrhosis. Am J Med Sci. 1974 May;267(5):275–9. 6. Runyon BA. Low-protein-concentration ascitic fluid is predisposed to spontaneous bacterial peritonitis. Gastroenterology. 1986 Dec;91(6):1343–6. 7. Kajani MA, Yoo YK, Alexander JA, Gavaler JS, Stauber RE, Dindzans VJ, et al. Serum-ascites albumin gradients in nonalcoholic liver disease. Dig Dis Sci. 1990 Jan;35(1):33–7. 8. Goyal AK, Goyal SK, Pokharna DS, Sharma SK. Differential diagnosis of ascitic fluid: evaluation and comparison of various biochemical criteria with a special reference to serum ascites albumin concentration gradient and its 79.
(93) relation to portal pressure. Trop Gastroenterol Off J Dig Dis Found. 1989 Mar;10(1):51–5. 9. Alba D, Torres E, Vázquez JJ. [Sero-ascitic gradient of albumin: usefulness and diagnostic limitations]. An Med Interna Madr Spain 1984. 1995 Aug;12(8):404–7. 10. Hou W, Sanyal AJ. Ascites: diagnosis and management. Med Clin North Am. 2009 Jul;93(4):801–817, vii. 11. Khan FY. Ascites in the state of Qatar: aetiology and diagnostic value of ascitic fluid analysis. Singapore Med J. 2007 May;48(5):434–9. 12. Moore CM, Van Thiel DH. Cirrhotic ascites review: Pathophysiology, diagnosis and management. World J Hepatol. 2013 May 27;5(5):251–63. 13. Healy JC, Reznek RH. The peritoneum, mesenteries and omenta: normal anatomy and pathological processes. Eur Radiol. 1998;8(6):886–900. 14. Standring susan. Gray’s Anatomy: The Anatomical Basis of Clinical Practice. 40th ed. philadelphia: Churchill Livingstone/Elsevier; 2008. 15. Taylor AE. Capillary fluid filtration. Starling forces and lymph flow. Circ Res. 1981 Sep;49(3):557–75. 16. Gerbes AL. Pathophysiology of ascites formation in cirrhosis of the liver. Hepatogastroenterology. 1991 Oct;38(5):360–4.. 80.
(94) 17. Schrier RW. Pathogenesis of Sodium and Water Retention in High-Output and Low-Output Cardiac Failure, Nephrotic Syndrome, Cirrhosis, and Pregnancy. N Engl J Med. 1988;319(17):1127–34. 18. Lieberman FL, Denison EK, Reynolds TB. The Relationship of Plasma Volume, Portal Hypertension, Ascites, and Renal Sodium Retention in Cirrhosis: The Overflow Theory of Ascites Formation. Ann N Y Acad Sci. 1970 Jul 1;170(1):202–12. 19. Lieberman FL, Reynolds TB. Plasma Volume in Cirrhosis of the Liver: Its Relation of Portal Hypertension, Ascites, and Renal Failure*. J Clin Invest. 1967 Aug 1;46(8):1297–308. 20. Schrier RW, Arroyo V, Bernardi M, Epstein M, Henriksen JH, Rodés J. Peripheral arterial vasodilation hypothesis: a proposal for the initiation of renal sodium and water retention in cirrhosis. Hepatol Baltim Md. 1988 Oct;8(5):1151–7. 21. Levy M, Wexler MJ. Renal sodium retention and ascites formation in dogs with experimental cirrhosis but without portal hypertension or increased splanchnic vascular capacity. J Lab Clin Med. 1978 Mar;91(3):520–36. 22. Levy M, Allotey JB. Temporal relationships between urinary salt retention and altered systemic hemodynamics in dogs with experimental cirrhosis. J Lab Clin Med. 1978 Oct;92(4):560–9.. 81.
(95) 23. Schrier RW, Caramelo C. Hemodynamics and vasoactive hormones in hepatic cirrhosis. In: Epstein M, ed. The kidney in liver disease. 3 rd edition. Baltimore;Williams & Wilkins(in press); 24. EPSTEIN FH, POST RS, MCDOWELL M. The effects of an arteriovenous fistula on renal hemodynamics and electrolyte excretion. J Clin Invest. 1953 Mar;32(3):233–41. 25. Caramelo C,, Fernandez Munoz D, Santos JC. Effect of volume expansion on hemodynamics, capillary permeability and renal function in conscious cirrhotic rats. Hepatology 1986; 6:129–34.; 26. Martin P-Y, Ginès P, Schrier RW. Nitric Oxide as a Mediator of Hemodynamic Abnormalities and Sodium and Water Retention in Cirrhosis. N Engl J Med. 1998;339(8):533–41. 27. Andrade DR de Jr, Galvão FHF, Santos SA dos, Andrade DR de. [Ascite--state of the art based on evidences]. Rev Assoc Médica Bras 1992. 2009 Aug;55(4):489–96. 28. Sangisetty SL, Miner TJ. Malignant ascites: A review of prognostic factors, pathophysiology and therapeutic measures. World J Gastrointest Surg. 2012 Apr 27;4(4):87–95. 29. Tamsma JT, Keizer HJ, Meinders AE. Pathogenesis of malignant ascites: Starling’s law of capillary hemodynamics revisited. Ann Oncol Off J Eur Soc Med Oncol ESMO. 2001 Oct;12(10):1353–7. 82.
(96) 30. Uygur-Bayramicli O, Dabak G, Dabak R. A clinical dilemma: abdominal tuberculosis. World J Gastroenterol WJG. 2003 May;9(5):1098–101. 31. Sharma MP, Bhatia V. Abdominal tuberculosis. Indian J Med Res. 2004 Oct;120(4):305–15. 32. Bansal S, Lindenfeld J, Schrier RW. Sodium retention in heart failure and cirrhosis: potential role of natriuretic doses of mineralocorticoid antagonist? Circ Heart Fail. 2009 Jul;2(4):370–6. 33. Kozarek RA. Management of Pancreatic Ascites. Gastroenterol Hepatol. 2007 May;3(5):362–4. 34. McHutchison JG. Differential diagnosis of ascites. Semin Liver Dis. 1997;17(3):191–202. 35. Runyon BA. Care of patients with ascites. N Engl J Med. 1994 Feb 3;330(5):337–42. 36. Runyon BA, AASLD Practice Guidelines Committee. Management of adult patients with ascites due to cirrhosis: an update. Hepatol Baltim Md. 2009 Jun;49(6):2087–107. 37. Lindsay KL, Reynolds TB, Hoefs JC, Sanmarco ME. Ascites. West J Med. 1981 May;134(5):414–23.. 83.
(97) 38. Hoefs JC. Serum protein concentration and portal pressure determine the ascitic fluid protein concentration in patients with chronic liver disease. J Lab Clin Med. 1983 Aug;102(2):260–73. 39. Runyon BA, Montano AA, Akriviadis EA, Antillon MR, Irving MA, McHutchison JG. The serum-ascites albumin gradient is superior to the exudate-transudate concept in the differential diagnosis of ascites. Ann Intern Med. 1992 Aug 1;117(3):215–20. 40. Hoefs JC. Globulin correction of the albumin gradient: correlation with measured serum to ascites colloid osmotic pressure gradients. Hepatol Baltim Md. 1992 Aug;16(2):396–403. 41. Bosch J, García-Pagán JC. Complications of cirrhosis. I. Portal hypertension. J Hepatol. 2000;32(1 Suppl):141–56. 42. Aller M-A, Arias J-L, Cruz A, Arias J. Inflammation: a way to understanding the evolution of portal hypertension. Theor Biol Med Model. 2007;4:44. 43. Laleman W, Landeghem L, Wilmer A, Fevery J, Nevens F. Portal hypertension: from pathophysiology to clinical practice. Liver Int Off J Int Assoc Study Liver. 2005 Dec;25(6):1079–90. 44. Heidelbaugh JJ, Bruderly M. Cirrhosis and chronic liver failure: part I. Diagnosis and evaluation. Am Fam Physician. 2006 Sep 1;74(5):756–62. 45. Gauthier F. Recent concepts regarding extra-hepatic portal hypertension. Semin Pediatr Surg. 2005 Nov;14(4):216–25. 84.
(98) 46. Bari K, Garcia-Tsao G. Treatment of portal hypertension. World J Gastroenterol WJG. 2012 Mar 21;18(11):1166–75. 47. Kumar A, Sharma P, Sarin SK. Hepatic venous pressure gradient measurement: time to learn! Indian J Gastroenterol Off J Indian Soc Gastroenterol. 2008 Apr;27(2):74–80. 48. Vanbiervliet G, Pomier-Layrargues G, Huet P-M. [Invasive diagnosis of portal hypertension in cirrhosis: a critical evaluation of the hepatic venous pressure gradient measurement]. Gastroentérologie Clin Biol. 2005 Oct;29(10):988–96. 49. Dittrich S, Yordi LM, de Mattos AA. The value of serum-ascites albumin gradient for the determination of portal hypertension in the diagnosis of ascites. Hepatogastroenterology. 2001 Feb;48(37):166–8. 50. Jiang C, Shi B, Shi J, Yuan Z, Xie W. New proposal for the serum ascites albumin gradient cut-off value in Chinese ascitic patients. Diagn Pathol. 2013;8:143. 51. Khandwalla HE, Fasakin Y, El-Serag HB. The utility of evaluating low serum albumin gradient ascites in patients with cirrhosis. Am J Gastroenterol. 2009 Jun;104(6):1401–5. 52. Engel H, Bac DJ, Brouwer R, Blijenberg BG, Lindemans J. Diagnostic analysis of total protein, albumin, white cell count and differential in ascitic fluid. Eur J Clin Chem Clin Biochem J Forum Eur Clin Chem Soc. 1995 Apr;33(4):239– 42. 85.
(99) 53. Fine J. The biuret method of estimating albumin and globulin in serum and urine. Biochem J. 1935 Mar;29(3):799–803. 54. Runyon BA. Ascites and spontaneous bacterial peritonitis. Sleisenger & Fordtran’s Gastrointestinal and Liver Disease. 10th ed. philadelphia: Saunders Elsevier; 2010. 55. Sakai H, Sheer TA, Mendler MH, Runyon BA. Choosing the location for nonimage guided abdominal paracentesis. Liver Int Off J Int Assoc Study Liver. 2005 Oct;25(5):984–6. 56. Laudanno OM, Bresciani P, Silva M. [Diagnostic efficacy of albumin gradient in different causes of ascitis]. Acta Gastroenterol Latinoam. 1995;25(5):285– 90. 57. Akriviadis EA, Kapnias D, Hadjigavriel M, Mitsiou A, Goulis J. Serum/ascites albumin gradient: its value as a rational approach to the differential diagnosis of ascites. Scand J Gastroenterol. 1996 Aug;31(8):814–7. 58. Rana SV, Babu SGV, Kocchar R. Usefulness of ascitic fluid cholesterol as a marker for malignant ascites. Med Sci Monit Int Med J Exp Clin Res. 2005 Mar;11(3):CR136–142. 59. Das B, Acharya U, Purohit A. Comparative utility of sero ascites albumin gradient and ascitic fluid total protein for differential diagnosis of ascites. Indian Pediatr. 1998 Jun;35(6):542–5.. 86.
Figure


+7


Related documents
In the present study, the changes in serum tocopherol, copper, zinc and albumin were assayed in PEM in order to define the status in protein energy malnourished
Therefore, we determined the levels of lactate dehydrogenase and serum ascites albumin gradient (SAAG) in differentiating malignant from non-malignant ascites.. PATIENTS
Correlation of serum-ascites albumin concentration gradient and endoscopic parameters of portal hypertension in chronic liver disease.. Suresh I 1 , Shiva Prasad Jagini
A serum ascites albumin gradient >1.1 gm/dl is suggestive of portal hypertension not only in patients with transudative type of ascites but also in cases
The aim of this study is to evaluate the role of serum ascites albumin gradient for prediction of esophageal varices in hepatitis C virus (HCV) cirrhotic patients with
analysis showed that total protein, albumin, alpha globulin, beta globulin, gamma globulin in synovial fluid were significantly lower than the.. serum
The purpose of the present study was to measure serum IL-6, C-reactive protein (CRP) (as a positive phase reactant) and albumin level (as a negative phase reactant) in
Hence, the present study was planned to assess the levels of serum total protein and albumin as plasma’s potent anti-oxidant defenses and advanced oxidation protein products,
