Guessing Answers to Pass a 5-item True False Test:
Solving a Binomial Problem Three Different Ways
A binomial problem is examined through the use of three methods: a classical approach using the binomial formula, Pascal’s Triangle, and a frequentist approach using a Fathom™ simulation. Using both physical and virtual coins students explored the distinction between a coin-sequence and a coin-combination (where the order is not important) as a foundation for a 5-item True False test task. Pedagogy was based on general principles identified by probability education research as best practice and by Ma, who emphasised deep understanding of concepts through the use of multiple approaches to problem solving.
The Binomial Theorem is a well established topic in the senior secondary curriculum. Normally taught using the binomial formula and Pascal’s Triangle, a computer simulation has the potential to offer an additional perspective and method of problem-solving.
The study examined students’ responses to a binomial problem using the three methods of the binomial formula, Pascal’s Triangle, and a Fathom™ simulation, and whether the use of a multiple-method approach that included electronic simulation may assist student learning. Three student tasks from a two-week study are presented. The physical and virtual “Coin-sequence” and “Coin-combination” tasks provided an opportunity for students to explore the distinction between an ordered coin-sequence and a coin-combination, where only the total number of heads and tails is recorded. The third task, where students calculated the probability of “Guessing correctly four or more answers on a 5-item True False test”, first established students’ existing knowledge and then traced their development of understanding of the binomial.
Theoretical Background
Probability is a mathematics topic where students are likely to bring their own beliefs and misconceptions to the classroom, and this may confound the study of probability. The counterintuitive results that exist at the elementary level, argued Batanero and Sanchez (2005), may explain the existence of learning difficulties at high school.
The concept of probability literacy is less developed in the research literature than the closely related statistical literacy. Gal (2005), developed a definition of probability literacy that identified five knowledge elements and three dispositional elements from which Jones et al. (2007) were able to infer the pedagogical approach of using contextual problems and a multiple approach to problem solving.
Pratt (2005) developed four guidelines for probability instruction: (a) purpose and utility, (b) testing personal conjectures where students’ existing conceptions are connected to new knowledge, (c) large scale simulations, and (d) systematic variation of the context. As Pratt noted testing personal conjectures and conducting large scale experiments are impracticable without electronic simulations. The use of electronic simulation to teach probability is well-established in the literature (e.g., Garfield & Gal, 1999)
Ma (1999) developed Profound Understanding of Elementary Mathematics to describe a depth of subject knowledge that she argued was the essential distinction between Chinese
Anthony Bill Jane Watson Peter Gayton
University of Tasmania University of Tasmania Department of Education, Tasmania
and American elementary mathematics teaching. Four principles were identified: (a) connectedness, to avoid fragmenting students’ learning; (b) multiple perspectives to solve problems; (c) basic ideas, explicitly taught and reinforced; and (d) longitudinal coherence, where critical concepts taught earlier are linked to what students will learn in subsequent years. These four principles could be applied at all levels, and all streams, of school mathematics. Larsen (2006) provided guidelines for teaching statistics and advocated an approach similar to Ma where tasks are investigated at depth, but he differed from current research by not explicitly mentioning the use of simulation.
Students’ understanding of a multiple coin toss as a coin-sequence task is reported extensively in the research literature (e.g., Rubel, 2006). The current study extended the coin-sequence task to explore the distinction between the probability of a specific ordered coin-sequence and the probability of a coin-combination, where only the total number of Heads and Tails that occurred was important. Equiprobability bias – an tendency to see events as equally likely, when they are not – was explored by Garfield and Gal (1998) in a system of two dice rolled simultaneously. This task is recast in the current study as a multiple coin toss, and presented as a companion task to a coin-sequence. The approach provides a two-fold function: (a) a more thorough investigation of the coin system and (b) a foundation for the exploration of the binomial theorem.
Method
Sample. The convenience sample was a Year 10 class in a government all boys high school in Tasmania. The group of nineteen students was an advanced mathematics class, but the students were self-selected and presented with a range of abilities. The classroom component of the research study was taught by the first author as a naturalistic teaching program, while the third author acted in the role of colleague teacher. Principles identified in education research including active learning, whole class discussion, multiple perspectives in developing a solution, connectedness of the concepts, and appropriate technology were particularly influential in the design of the study. The software Fathom, a product of Key Curriculum Press (Finzer, 2005), was used to support the teaching program, and many of the students had limited exposure to Fathom from a short study conducted the previous year. The study was developed as a pilot program within a broader study examining the use of Fathom to support learning in middle to late high school.
Task 1: Coin-sequence
The coin-sequence task is a the classic task used throughout the research literature. The principal objective was to determine students’ preconceptions of independent events.
Which of the following sequences is more likely to result from flipping a fair coin 5 times: (a) HHHTT; (b) HTTHT; (c) THTTT; (d) HTHTH; (e) all four sequences are equally likely? Explain your answer.
The correct response is (e), and an example of the preferred explanation might be: “…the outcome of the toss of a fair coin is equally either heads or tails…”
Task 2: Coin-combination
The coin-combination task extended the coin-sequence task to examine the most likely outcome of flipping a coin five times, but with only total number of Heads or Tails, not the sequence in which they occurred; e.g. a sequence of HTHHT is recorded as 3H&2T.
A fair coin is flipped five times and only the total number of Heads and Tails is recorded, not the sequence in which it occurred. Which result is more likely: (a) 3H&2T; (b) 5H; (c) H&4T; (d) all three (a),(b) and (c) are equally likely; (e) it is impossible to give and answer. Explain your answer. The correct response is (a), and the preferred response might be “…all sequences are equally likely, but the 3H&2T combinations is more likely because it can occur in the most number of different sequences…”
Task 3: Guessing four or more correct answers on a 5-item True False test
This task is taken from a scenario designed to be familiar to students: A student is given a 5 question True-False test, but because he had not studied for the test, he decided to guess the answers. Student responses are scaffolded by first asking the probability of choosing, purely by chance, five correct answers, and then, in a more complex question:
The teacher, suspecting students are guessing the answers said students must get four or more correct answers to pass. What is the probability of guessing four or more answers correctly?
To complete the latter task students must perform three calculations: (a) find the probability of guessing five correct answers; (b) find the probability of guessing correctly four answers; and (c) add the two probabilities to give the final answer of 6/32.
In the post-test the students were instructed to demonstrate competency in all three methods introduced in the study: the classical approach using the binomial formula, Pascal’s Triangle, and Fathom software. Students were also asked to identify which of the three methods they would use to solve a hypothetical 40-item binomial task (Pascal’s Triangle is impracticable in this situation), and to demonstrate a thorough understanding of the concepts through their post-test responses to Task 2, the coin-combination task.
integrates effectively many elements and reconciles any contradiction; and an extended abstract response incorporates aspects beyond the immediate task.
Results
Task 1: Coin-sequence
Students’ performance on the task in the pre-test (95%) was very high, with students providing an explanation that each outcome, heads or tails, was equally likely. This was a higher level of correct responses than that found by Konold et al. (1993) in a study of first year pre-service teachers (78.7% correct), and it is consistent with Konold’s conclusion that by early teens the majority of people believe in the independence of trials of coin flipping.
Only one student (5%) gave the incorrect response, and he re-worded the item as a coin-combination identifying the sequence HTTHT “…closest to even […] 1/2T, 1/2H…”
[image:4.595.77.518.354.639.2]Task 2: Coin-combination
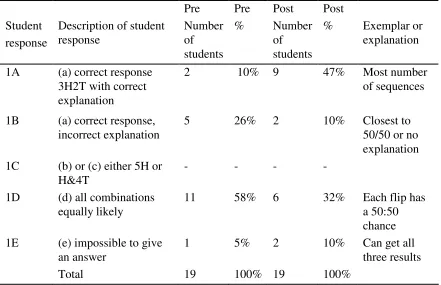
Table 1
Task 2: Students’ pre- and post- responses to the most likely coin-combination
Pre Pre Post Post
Student response
Description of student
response Number of
students
% Number
of students
% Exemplar or explanation 1A (a) correct response
3H2T with correct explanation
2 10% 9 47% Most number
of sequences
1B (a) correct response,
incorrect explanation 5 26% 2 10% Closest to 50/50 or no explanation 1C (b) or (c) either 5H or
H&4T - - - -
1D (d) all combinations
equally likely 11 58% 6 32% Each flip has a 50:50 chance 1E (e) impossible to give
an answer 1 5% 2 10% Can get all three results
Total 19 100% 19 100%
In the pre-test only two students (10%) gave the correct response (1A) of 3H & 2T, and provided a correct explanation “…each sequence is equally likely, and this combination can be generated by the most number of sequences…” A further five students (26%) selected the correct response but provided the less robust explanation that the combination was “…closest to the expected 50/50 split…”.
of each flip is equally likely…” This suggests these students had either incorrectly focussed on the notion of independent events, or had viewed the task entirely from the perspective of a coin-sequence. Conversely, the student who provided an incorrect response in the pre-test to Task 1 provided a correct response to Task 2, suggesting that this particular student viewed the task entirely from the perspective of a coin-combination.
Students’ performance on the pre-test (a total of 36% correct responses) was below that reported by Green (1984) (77%) in a similar task of students of the same age; on the post-test although students results had improved (57%), they were still below those of Green. The number of correct student responses was lower on Task 2 than on Task 1. Task 3: Guessing four or more correct answers on a 5-item True False test
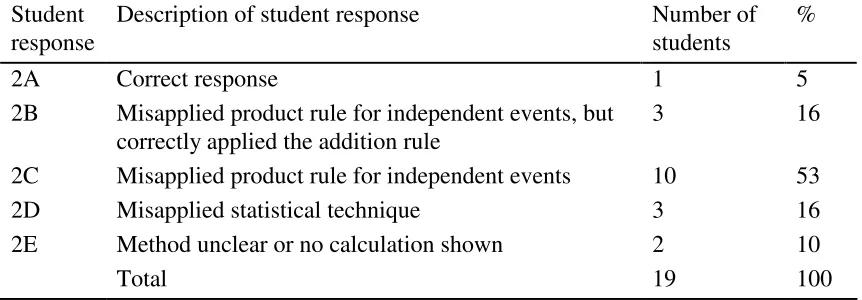
[image:5.595.97.528.343.493.2]The results for this task are presented in two ways: (a) firstly, in Table 2, students’ pre-test responses warrant separate analysis as they highlight the range of strategies used; and (b) secondly, in Table 3, SOLO taxonomy is used to trace students’ development of understanding because of the complexity of the task and the richness of their responses. Table 2
Task 3: Students’ pre-test responses to guessing four or more questions correctly Student
response Description of student response Number of students %
2A Correct response 1 5
2B Misapplied product rule for independent events, but
correctly applied the addition rule 3 16
2C Misapplied product rule for independent events 10 53
2D Misapplied statistical technique 3 16
2E Method unclear or no calculation shown 2 10
Total 19 100
Only one student gave the correct response (student response 2A) calculating the probability of guessing four and five correct answers and then adding the two probabilities. The student used the binomial formula and the correct notation. The student had completed another extended mathematics course and was familiar with the binomial formula.
Pr ( 4) = 5C
3(1/2)4(1/2)1 + 5C4(1/2)5(1/2) = 5 * 1/32 + 1 * 1/32 = 6/32 = 3/16
Three students (16%) misapplied the product rule (student response 2B) for independent events, but correctly applied the addition rule. Statistically the response is nonsensical, but it represents a more sophisticated response because it recognises that probabilities of the two outcomes must be added.
1/16 + 1/32 = 3/32
In the most common response 10 students (53%) misapplied the product rule (student response 2C) for independent events: ½ * ½ * ½ * ½ = 1/16. The students had, in error, calculated only the probability of guessing 4 successes in a 4-trial binomial.
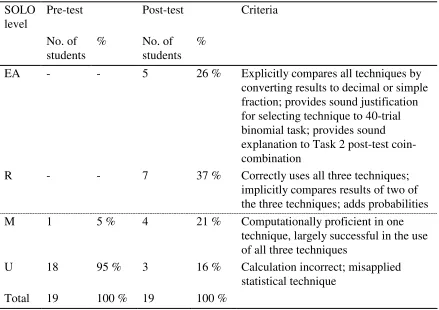
In the second part of the analysis, students’ responses on both the pre- and post-test were assessed using the SOLO taxonomy as this allowed more thorough analysis of their development of understanding. On the pre-test students were asked to calculate the probability only, and the pre-test responses only allowed, as delineated by a dashed line in Table 3, an opportunity to provide evidence up to a multistructural level. In the post-test students were instructed to demonstrate an understanding of the three methods examined, to provide a sound justification for the method they would use in a large 40-trial binomial problem, and to complete the Task 2 coin-combination task. Students were able to demonstrate a relational or extended abstract response by comparing and reconciling the three methods, and by conveying an sense of an integrated task. The results of the SOLO evaluation are presented below in Table 3, and the examples of student work are selected entirely from the responses to the post-test as it provides examples for all SOLO levels. Table 3
SOLO evaluation Guessing four or more correct answers and Task 2 coin-combination SOLO
level Pre-test Post-test Criteria
No. of
students % No. of students %
EA - - 5 26 % Explicitly compares all techniques by
converting results to decimal or simple fraction; provides sound justification for selecting technique to 40-trial binomial task; provides sound explanation to Task 2 post-test coin-combination
R - - 7 37 % Correctly uses all three techniques;
implicitly compares results of two of the three techniques; adds probabilities
M 1 5 % 4 21 % Computationally proficient in one
technique, largely successful in the use of all three techniques
U 18 95 % 3 16 % Calculation incorrect; misapplied statistical technique
Total 19 100 % 19 100 %
Five students (26%) provided an extended abstract (EA) response. One student recalculated the decimal fraction obtained in the simulation as a – somewhat inelegant – mixed simple/decimal fraction “…21/128 which is equal to 5.25/32…” to compare the results of the three methods explicitly; and he selected the classical method on the basis that “…forty items is too big for Pascal’s…[and]…Fathom can only be used on the computer – it can’t be used everywhere...”; and gave a correct response and explanation to the coin-combination item “…there are more sequences that add up to 3H and 2T …”
students correctly selected either the classical method or the Fathom simulation in the 40-trial binomial task in clear preference to Pascal’s Triangle.
Four students (21%) provided a multistructural (M) response. The addition rule was not applied consistently and the students did not reconcile the clearly different results obtained. The students inappropriately selected Pascal’s to solve the 40-trial binomial task, providing the justification “…because it is the easiest…” when Pascal’s is entirely impracticable in that task.
Three student (16%) provided a unistructural (U) response. As an exemplar one student used only the Fathom simulation correctly, and only in this one method was the addition rule applied. The student did not recall the classical formula, and he did not display a strong sense of the shape of the distribution. Pascal’s was inappropriately selected for the hypothetical 40-trial binomial and the justification provided for the selection was weak.
Discussion
Probability education research recommends activities designed to confront misconceptions: Task 1 and 2 are such activities. Students’ understanding of the five coin-sequence on the pre-test was robust, but students’ performance on Task 2 coin-combination remained below that on Task 1 coin-sequence throughout the study. A coin-combination task is arguably more intuitive than a coin-sequence task, and it is intriguing that students’ performance was lower on this “simpler” task. This may reflect students’ prior experiences at school, which may have emphasised the concept of independent events, but had not considered combinations. The reasons for students’ incorrect responses to coin-sequence or coin-combination tasks might lie with students re-interpreting a coin-coin-sequence as a coin-combination, or vice-versa – this distinction is rarely made in casual conversation, and this may be confounding students. It is intriguing that the Task 2 coin-combination does not appear to be used in education research as a companion task to the coin-sequence in Task 1.
In the pre-test when attempting to solve Task 3, half the student group misapplied the product rule for independent events. Rather than a misconception this response could be described by Pratt’s (2005) framework: “…old pieces of knowledge coexist with newer pieces of knowledge, either in a connected or perhaps isolated way…” (p. 183). Misapplication of a familiar technique may only be evident with students who have acquired a basic repertoire of formal statistical techniques. Students were clearly not confident of the response they gave, but from the students’ perspective the pre-test was a test, and they may have felt under pressure to give a response.
The post-test showed that 16 (84%) of the students were procedurally correct in at least one method for solving Task 3, and 12 (63%) were competent in all three methods. However, many students could demonstrate a procedural competence in Task 3, but were unable to solve the original coin-combination task correctly. This highlighted students’ incomplete understanding of both the coin-system and the binomial theorem, but the explanation may be quite simple: students’ focus had shifted to procedures, and simple revision of the Fathom coin simulation may have addressed this misconception.
Conclusion
Students’ understanding of the coin-combination task was persistently less well-developed than their understanding of the companion task of coin-sequences, and many students continued to confound the two. Schools may emphasise the concept of independent events at the expense of consideration of coin-combinations, and failure to make the distinction between coin-sequence and coin-combination clear may be contributing to students’ difficulties.
Building from a familiar physical activity and explicitly developing confidence in the electronic simulation may be a key first step in facilitating students’ transition to electronic simulation at more senior school levels. Using three methods to examine one task in-depth was acknowledged by the students and the colleague teacher, and shown by the post-test responses, as an effective teaching strategy. This approach may appeal to multiple intelligences, and it provides an opportunity for students to evaluate the methods used.
Implications for teaching and research. A clear distinction should be made between a coin-sequence and a coin-combination, and a study of the two should be considered companion tasks. Coin-sequences tasks allow exploration of independent events and, the more intuitive, coin-combination tasks provide a basis for a study of the binomial theorem. A strategy using multiple approach examining one conceptually simple task at depth may be effective in developing students’ profound understanding of a concept.
Acknowledgment. This research was supported under an ARC Linkage grant LP0669106, by the Australian Bureau of Statistics and KCP, the manufacturer of Fathom. The researchers thank the students and staff at the school for their participation.
References
Batanero, C., & Sanchez, E. (2005). What is the nature of high school students’ conception and misconceptions about probability? In G. A. Jones (Ed.), Exploring probability in school: Challenges for
teaching and learning. (pp. 241-266). New York, NY: Springer.
Biggs. J. B., & Collis, K. F. (1982). Evaluating the quality of learning: The SOLO taxonomy (Structure of the
Observed Learning Outcome). New York: Academic Press, Inc.
Finzer, W. (2005). Fathom™: Dynamic data software. Emeryville, CA: Key Curriculum Press.
Green, D. R., (1984). Talking of probability. Mathematics Today. September/October, Vol. 20 pp. 145-149. Jones, G. A., Langrall C. W., & Mooney E. S. (2007). Research in probability: Responding to classroom
realities. In F. K. Lester (Ed.)., Second handbook of research on mathematics teaching and learning. Charlotte, NC: NCTM.
Konold, C., Pollatsek, A., Well, A., Lohmeier, & Lipson, A. (1993). Inconsistencies in students’ reasoning about probability. [Electronic version]. Journal for Research in Mathematics Education. 24 (November 1993): pp. 392–414. Downloaded 8th February, 2009.
Larsen, M. D. (2006). Advice for new and student lecturers on probability and statistics. Journal of Statistics
Education. [Electronic version] Vol. 12, No.1. Downloaded 29th January, 2008 from
http:/amstat.org/publications/jse/v14n1/larsen.html
Ma, Liping. (1999). Knowing and teaching elementary mathematics. Mahwah, NJ: Lawrence Erlbaum. Pratt, D. (2005). How do teachers foster students’ understanding of probability? In G. A. Jones (Ed.),
Exploring probability in school: Challenges for teaching and learning. (pp. 171-190). New York, NY:
Springer.
Rubel, L. H. (2006). Students’ probabilistic thinking revealed – the case of coin tosses. In G. F. Burrill & P. C. Elliott (Eds.), Thinking and reasoning with data and chance: Sixty-eighth yearbook, (pp. 49-60). Reston, VA: NCTM.