EUROPEAN ORGANISATION FOR NUCLEAR RESEARCH (CERN)
Submitted to: JHEP CERN-EP-2016-194
25th October 2016
Measurement of the
Z Z
production cross section in
proton–proton collisions at
√
s
=
8 TeV using the
Z Z
→
`
−
`
+
`
0 −
`
0
+
and
Z Z
→
`
−
`
+
ν
ν
¯
decay
channels with the ATLAS detector
The ATLAS Collaboration
A measurement of theZZ production cross section in the`−`+`0 −`0+ and`−`+νν¯ channels (`=e, µ) in proton–proton collisions at √s=8 TeV at the Large Hadron Collider at CERN, using data corresponding to an integrated luminosity of 20.3 fb−1 collected by the ATLAS experiment in 2012 is presented. The fiducial cross sections forZZ → `−`+`0 −`0+ and
ZZ →`−`+νν¯ are measured in selected phase-space regions. The total cross section forZZ
events produced with bothZbosons in the mass range 66 to 116 GeV is measured from the combination of the two channels to be 7.3± 0.4 (stat)±0.3 (syst)+−00..21 (lumi) pb, which is consistent with the Standard Model prediction of 6.6+−00..76pb. The differential cross sections in bins of various kinematic variables are presented. The differential event yield as a function of the transverse momentum of the leadingZboson is used to set limits on anomalous neutral triple gauge boson couplings inZZproduction.
c
2016 CERN for the benefit of the ATLAS Collaboration.
Reproduction of this article or parts of it is allowed as specified in the CC-BY-4.0 license.
Contents
1 Introduction 3
2 The ATLAS detector 4
3 Phase-space definitions 5
3.1 ZZ →`−`+`0 −`0+channel 5
3.2 ZZ →`−`+νν¯channel 6
4 Standard Model predictions 6
5 Simulated event samples 8
6 Data samples, reconstruction of leptons, jets, andEmiss
T and event selections 8
6.1 Data samples 8
6.2 Reconstruction of leptons, jets, andETmiss 9
6.3 Event selection 10
6.3.1 ZZ→`−`+`0 −`0+selection 10
6.3.2 ZZ→`−`+νν¯selection 10
7 Background estimation 11
7.1 ZZ →`−`+`0 −`0+backgrounds 11
7.2 ZZ →`−`+νν¯backgrounds 13
7.2.1 Backgrounds from leptonicWZdecays andZZ→`−`+`0 −`0+decays 13
7.2.2 Backgrounds fromtt¯,W−W+,Wt,ZZ →ττννandZ →τ−τ+ 13
7.2.3 W+jets and multijet background 14
7.2.4 Z+jets background 14
7.2.5 Background summary forZZ→`−`+νν¯ 14
8 Event yields 14
9 Correction factors and detector acceptance 17
10 Systematic uncertainties 19
11 Cross-section measurements 21
11.1 Cross-section extraction 21
11.2 Differential cross sections 23
11.2.1 ZZ→`−`+`0 −`0+channel 24
11.2.2 ZZ→`−`+νν¯channel 24
12 Anomalous neutral triple gauge couplings 24
12.1 Parameterization of signal yield 27
12.2 Confidence intervals for aTGCs 27
1 Introduction
The underlying structure of the Standard Model (SM) in the electroweak sector is the non-abelian SU(2)L×
U(1)Ygauge group [1–3] that has been successful in describing features such as the masses of the vector bosons and their couplings to fermions. The production of electroweak gauge boson pairs provides an opportunity to perform precision studies of the electroweak sector by looking for deviations from the predicted total and differential production cross sections, which could be an indication of new resonances or couplings not included in the SM.
In the SM,Z boson pairs may be produced at lowest order via quark–antiquark (qq¯) annihilation, as well as through gluon–gluon fusion via a quark loop. In √s = 8 TeV proton–proton (pp) collisions, approximately 6% of the predicted total cross section is due to gluon–gluon fusion [4]. A pair of Z
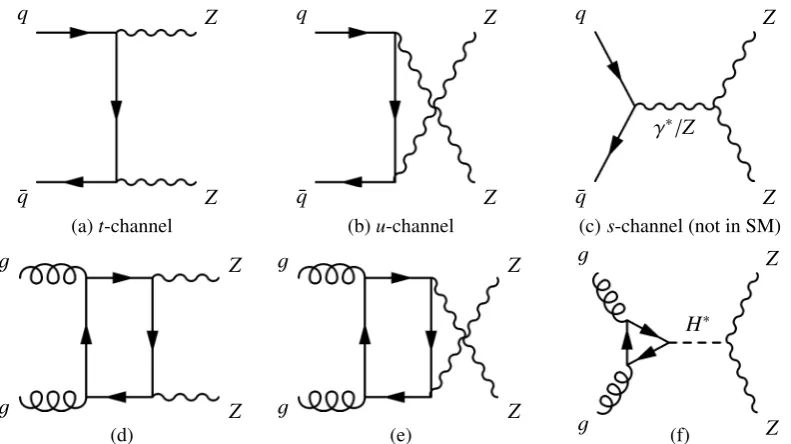
bosons may also be produced by the decay of a Higgs boson. Lowest-order Feynman diagrams for SM production ofZZdibosons are given in Figures1(a),1(b)and1(d)to1(f). These represent the dominant mechanisms forZZ diboson production at the Large Hadron Collider (LHC). The self-couplings of the electroweak gauge bosons are fixed by the form of the SM Lagrangian. Consequently, neutral triple gauge couplings such asZZZandZZγare not present in the SM, making the contribution from the s-channel diagram zero (Figure1(c)).
In addition to precision tests of the electroweak sector of the SM, ZZ diboson measurements motivate higher-order calculations in perturbative quantum chromodynamics (pQCD) and allow for in-depth tests of pQCD. Production of ZZ dibosons is a background to the SM Higgs boson process and to many searches for physics beyond the SM, and precise knowledge of the cross section is necessary to observe deviations relative to SM predictions.
¯q q
Z Z
(a)t-channel
¯
q q
Z Z
(b)u-channel
γ∗/Z
¯
q q
Z Z
(c)s-channel (not in SM)
g Z
g Z
(d)
g Z
g Z
(e)
H∗
g g
Z Z
[image:3.595.104.500.431.653.2](f)
Figure 1: Lowest-order Feynman diagrams forZZ production. The(a)t-channel and(b)u-channel diagrams con-tribute toZZ production cross section, while the(c)s-channel diagram is not present in the SM, as it contains a neutralZZZorZZγvertex. Examples of one-loop contributions toZZproduction via gluon pairs are shown in(d),
Many extensions to the SM predict new scalar, vector, or tensor particles, which can decay to pairs of electroweak bosons. For example, diboson resonances are predicted in technicolour models [5–8], models with warped extra dimensions [9–11], extended gauge models [12,13], and grand unified theories [14]. Furthermore, extensions to the SM such as supersymmetry or extra dimensions predict new particles, which can either produce boson pairs directly, in cascade decays, or indirectly via loops. At higher orders, loop contributions involving new particles can lead to effective anomalous neutral triple gauge couplings (aTGCS) as large as 10−3[15]. Any significant deviation in the observed production cross section relative to the SM predictions can indicate a potential source of new physics. Thus,ZZ production is important not only for precision tests of the electroweak sector and pQCD, but also for searches for new physics processes.
This paper presents measurements of the fiducial, total and differential cross sections forZZ production in ppcollisions at a centre-of-mass energy of √s = 8 TeV using 20.3 fb−1 of data. These have been measured by both the ATLAS [16] and CMS [17] Collaborations at 7 TeV. Recently, the ATLAS Col-laboration has measured the fiducial and total cross section forZZproduction at a centre-of-mass energy of √s = 13 TeV [18] and the cross section as a function of the invariant mass of the four-lepton system at a centre-of-mass energy of √s = 8 TeV [19]. The CMS Collaboration has recently measured theZZ
production cross section at 8 TeV [20].
This paper also presents limits onZZZ andZZγ aTGCs within the context of an effective Lagrangian framework [21]. The limits obtained by both ATLAS [16] and CMS [17] using the full 7 TeV data sets are approximately 10 to 20 times stricter than limits set at LEP2 [22] and the Tevatron [23]. More recently, limits on aTGCs have been set by the CMS Collaboration using the full 8 TeV data set of 19.6 fb−1in the
ZZ → `−`+`0 −`0+channel (` = e, µ, τ) [20]. CMS has also measured theZZ production cross section using theZZ →`−`+νν¯ decay mode and set limits on aTGCs using the combination of 5 fb−1of data at 7 TeV and 19.6 fb−1of data at 8 TeV [24].
The paper is organized as follows. An overview of the ATLAS detector is given in Section2. Section3
defines the phase space in which the cross sections are measured, while Section4gives the SM predic-tions. The simulated signal and background samples used for this analysis are given in Section5. Data samples, reconstruction of leptons, jets andEmissT , and event selection for each final state are presented in Section6. The estimation of background contributions to the ZZ → `−`+`0 −`0+ andZZ → `−`+νν¯ channels, using a combination of simulation-based and data-driven techniques, is discussed in Section7. The observed and expected event yields are presented in Section 8, while Section9 describes the cor-rection factors and detector acceptance for this measurement. Section10describes the experimental and theoretical systematic uncertainties considered. Section11presents the results of the total and differential cross-section measurements. Limits on aTGCs are discussed in Section12in the context of an effective Lagrangian framework. Finally, Section13presents the conclusions.
2 The ATLAS detector
The inner detector (ID) provides tracking of charged particles in the pseudorapidity1 range |η| < 2.5. It consists of three layers of silicon pixel detectors and eight layers of silicon microstrip detectors sur-rounded by a straw-tube transition radiation tracker in the region|η|<2.0, which contributes to electron identification.
The high-granularity electromagnetic (EM) calorimeter utilizes liquid argon (LAr) as the sampling me-dium and lead as an absorber, covering the pseudorapidity range|η| <3.2. A steel/scintillator-tile calor-imeter provides hadronic coverage for |η| < 1.7. The endcap and forward regions of the calorimeter system, extending to|η|=4.9, are instrumented with copper/LAr and tungsten/LAr modules for both the EM and hadronic measurements.
The MS consists of three large superconducting toroids, each comprising eight coils, and a system of trigger chambers and tracking chambers that provide triggering and tracking capabilities in the ranges |η|<2.4 and|η|<2.7, respectively.
The ATLAS trigger system [26] consists of a hardware-based Level-1 trigger followed by a software-based High-Level Trigger (HLT). It selects events to be recorded for offline analysis, reducing their rate to about 400 Hz.
3 Phase-space definitions
This analysis measures the cross section ofZZdiboson production in a region of kinematic phase space very close to the geometric acceptance of the full detector. Fiducial cross sections are measured for the
e−e+e−e+, e−e+µ−µ+and µ−µ+µ−µ+final states in theZZ → `−`+`0 −`0+channel and for the e−e+νν¯ and µ−µ+νν¯final states in theZZ→`−`+νν¯channel. Final states with leptonicτdecays are not included as signal in any of the final states considered.
The information from each final state in both channels is combined to measure the totalZZ production cross section in a kinematic phase space, referred to as the total phase space, defined by 66 < m`−`+ < 116 GeV, wherem`−`+is the invariant mass of each charged lepton pair. Where there is ambiguity in the choice of lepton pairs, the pairing procedure described in Section6.3.1is used.
The kinematic properties of final-state electrons and muons include the contributions from final-state radiated photons within a distance in the (η, φ) plane of ∆R = 0.1 around the direction of the charged lepton.2
3.1 Z Z → `−`+`0 −`0+
channel
Three different fiducial phase-space regions are used for theZZ → `−`+`0 −`0+ channel of the analysis, one for each decay mode, and selected to increase the geometric acceptance by using the forward regions of the detector while controlling backgrounds. TheZ boson pairs are required to decay to e−e+e−e+,
e−e+µ−µ+, or µ−µ+µ−µ+, where the invariant mass of each opposite-sign, same-flavour lepton pair is
1ATLAS uses a right-handed coordinate system with its origin at the nominal interaction point (IP) in the centre of the detector
and thez-axis along the beam pipe. The x-axis points from the IP to the centre of the LHC ring and they-axis points upward. Cylindrical coordinates (r,φ) are used in the transverse plane,φbeing the azimuthal angle around the beam pipe. The pseudorapidity is defined in terms of the polar angleθasη=−ln [tan (θ/2)].
required to be within 66< m`−`+ < 116 GeV. The transverse momentum, pT, of each lepton must be at least 7 GeV. In theµ−µ+µ−µ+decay mode, the muons must fall within a pseudorapidity range|η|<2.7. In thee−e+e−e+decay mode, three electrons are required to have|η|<2.5 and the fourth electron is required to lie in the pseudorapidity range|η|< 4.9. In thee−e+µ−µ+decay mode, both muons are required to be within|η|< 2.7, while for the electrons, one electron must be central (|η| < 2.5), while the second must fall within|η|<4.9. The minimum angular separation between any two of the four charged leptons must be∆R>0.2.
3.2 Z Z → `−`+νν¯channel
The fiducial phase space for theZZ → `−`+νν¯ channel is defined by requiring oneZboson to decay to neutrinos (invisible) and oneZboson to decay to ane−e+orµ−µ+pair. The invariant mass of the charged lepton pair must lie within 76< m`−`+ <106 GeV. Each charged lepton used to formZcandidates must have transverse momentum pT >25 GeV and|η|< 2.5. The charged leptons must be separated by more
than∆R = 0.3. The axial missing transverse momentum in the event (axial-EmissT ), which expresses the projection of the transverse momentum of the neutrino pair of the invisibly decayingZboson (~pTν¯ν) onto the direction of the transverse momentum of theZboson decaying to charged leptons (~pTZ), is defined as −pνTν¯·cos(∆φ(~pTνν¯, ~pTZ)). The axial-ETmissis required to be greater than 90 GeV. The pT-balance between the twoZ bosons, defined as|pνTν¯− pZT|/pZ
T, must be less than 0.4. There must be no particle-level jets
with pT > 25 GeV,|η| < 4.5 and each jet must have a minimum distance of∆R= 0.3 from any prompt
electron. Particle-level jets are constructed from stable particles with a lifetime ofτ > 30 ps, excluding muons and neutrinos, using the anti-ktalgorithm [27] with a radius parameter ofR=0.4.
The definitions of the fiducial phase space for each of the fiveZZfinal states under study are summarized in Table1.
Fiducial Phase Space
Selection e−e+e−e+ µ−µ+µ−µ+ e−e+µ−µ+ e−e+νν¯ µ−µ+νν¯
Lepton pT >7 GeV >25 GeV
Lepton|η| |η|e1,e2,e3 <2.5 |η|µ<2.7 |η|e1 <2.5,|η|e2 <4.9 |η|e <2.5 |η|µ<2.5
|η|e4 <4.9 |η|µ<2.7
∆R(`, `0) >0.2 >0.3
m`−`+ 66<m`−`+ <116 GeV 76<m`−`+ <106 GeV
Axial-EmissT - >90 GeV
pT-balance - <0.4
Jet veto - pTjet >25 GeV,|η|jet<4.5,
and∆R(e,jet)>0.3
Table 1: Fiducial phase-space definitions for each of the fiveZZfinal states under study.
4 Standard Model predictions
The fiducial and total cross-section predictions for SMZZproduction reported in this paper are evaluated with PowhegBox[28,29] at next-to-leading order (NLO) in QCD and are supplemented with predictions
gluon-induced process. Interference effects with SM Higgs boson production via gluon–gluon fusion as well as off-shell Higgs boson production effects are considered, based on recent calculations [31]. The contribution of the gluon–gluon initial state to the fiducial cross sections is about 6% for theZZ →
`−`+`0 −`0+channel and about 3% for the
ZZ →`−`+νν¯ channel. All computations are performed using dynamic renormalization and factorization scales (µRandµF) equal to the invariant mass of theZZsystem
(mZZ) as the baseline, and the CT10 parton distribution function (PDF) set [32].
The results from PowhegBox are corrected for virtual NLO electroweak (EW) effects [33], applied as
reweighting factors on an event-by-event basis, following the method described in Ref. [34]. As a result, the fiducial cross-section predictions for theZZ →`−`+`0 −`0+andZZ →`−`+νν¯ channels are reduced by 4% and 9% respectively.
σfid
ZZ→e−e+e−e+ = 6.2 +−00..65 fb
σfid
ZZ→e−e+µ−µ+ = 10.8+−11..10 fb
σfid
ZZ→µ−µ+µ−µ+ = 4.9 +−00..54 fb
σfid
ZZ→e−e+νν¯ = 3.7 ±0.3 fb
σfid
ZZ→µ−µ+ν¯ν = 3.5 ±0.3 fb
σtotal
pp→ZZ = 6.6 +
0.7
[image:7.595.232.377.250.392.2]−0.6 pb
Table 2: Predicted fiducial and totalZZproduction cross sections. The considered systematic uncertainties and the accuracy in pertubation theory are detailed in the text.
The SM predictions for the fiducial and total ZZ production cross sections in the regions defined in Section 3and including the EW corrections are summarized in Table 2. The systematic uncertainties shown in the table include a PDF uncertainty of+−43..2%3%[35] applied to the results from both the PowhegBox
andgg2VVgenerators. For the PowhegBoxcontribution, a scale uncertainty of+−23..1%3%[35] is included. For
the gluon–gluon fusion contribution, recent publications [36–38] suggest an increase of theZZproduction cross section by up to a factor of about two, when the calculation is performed at higher orders in QCD. This calculation is sensitive to the choice of PDF set and even more to theµR andµF scales. As this
correction is not available differentially for all distributions and all final states analysed in this paper, no reweighting is applied to the prediction ofgg2VV. In order to account for these higher-order QCD effects, the scale uncertainty forgg2VVis set to±60%. PDF and scale uncertainties are added linearly following the recommendation of Ref. [39]. The jet veto uncertainty obtained using the Stewart and Tackmann method [40] is shown in Table8and is added in quadrature to the systematic uncertainty of the fiducial cross sections for each ZZ → `−`+νν¯ final state. This approach is conservative and it covers further uncertainties from higher-order QCD effects.
The contribution to the cross section predicted with PowhegBoxis known to increase by approximately
5 Simulated event samples
Simulated samples [43] are used to correct the measured distributions for detector effects and acceptance and to determine or validate some background contributions. Production and subsequent decays ofZZ
pairs are simulated using PowhegBoxat NLO in theqq¯ process, andgg2VVat LO in the gluon-induced
process, both interfaced to Pythia8 [44] for parton showering and underlying-event modelling, with the
CT10 PDF set. In each case, the simulation includes the interference terms between theZ andγ∗ dia-grams. The NLO EW corrections are applied to the PowhegBoxpredictions as explained in the previous
section.
Moreover, the PowhegBoxgenerator interfaced to Herwig[45] and Jimmy[46] is used to estimate
system-atic uncertainties due to the choice of parton shower and underlying-event modelling. The LO multi-leg generator Sherpa[47] with the CT10 PDF set is used to assign systematic uncertainties due to the choice
of event generator as well as to generate signal samples withZZZandZZγaTGCs.
The LO generator Alpgen[48] using the CTEQ6L1 PDFs [49] and interfaced to Pythia[50] is used to
simulateZ+jets andW+jets background samples. The same generator interfaced to Herwigis used to
model the Wγ process. The diboson production processes WW and WZ are generated with Powheg
-Box interfaced to Pythia 8 using the CT10 PDFs. Top quark pair production (tt¯) is simulated with
MC@NLO [51] using the CT10 PDFs. Single-top production, includingWt production, is modelled with MC@NLO [52], interfaced to Herwig, and AcerMC [53] using the CTEQ6L1 PDFs. The LO
gen-erator MadGraph[54] using the CTEQ6L1 PDFs is used to model theZZZ∗,ZWW∗andttZ¯ processes.
Events with two hard interactions in appcollision (double proton interactions, DPI) that each produce a
Zboson decaying to leptons are simulated using Pythia8 with the CTEQ6L1 PDF set.
The signal and background generated Monte Carlo (MC) samples are passed through the ATLAS detector simulation [43] based on GEANT4 [55]. Additional inelastic ppinteractions (pile-up) are included in the simulation. The MC events are reweighted to reproduce the distribution of the mean number of interactions per bunch crossing observed in data.
6 Data samples, reconstruction of leptons, jets, and
E
missT
and event
selections
6.1 Data samples
The measurement presented in this paper uses the full data set ofppcollisions at a centre-of-mass energy of √s = 8 TeV collected with the ATLAS detector at the LHC in 2012. The data corresponds to a total integrated luminosity of 20.3 fb−1, with an uncertainty of 1.9% [56]. The absolute luminosity scale and its uncertainty are derived from beam-separation scans performed in November 2012. All events were required to satisfy basic quality criteria indicating stable beams and good operating characteristics of the detector during data taking. The data analysed were selected using single-lepton triggers [57, 58] with isolation requirements and thresholds of 24 GeV for the transverse momentum (energy) of muons (electrons).
collision, and to reduce contamination from cosmic rays, the primary vertex is chosen to be the vertex with the highest sum of the squared transverse momenta of the associated ID tracks.
6.2 Reconstruction of leptons, jets, andEmiss
T
Muon candidates are identified by tracks, or track segments, reconstructed in the MS and matched to tracks reconstructed in the ID [59]. Muons within |η| < 2.5 are referred to as “central muons”. Muons within 2.5 < |η| < 2.7, where there is no ID coverage and they are reconstructed only in the MS, are referred to as “forward muons”. In order to recover efficiency at|η| < 0.1 whereφcoverage in the MS is reduced due to mechanical supports and services, “calorimeter-tagged” muons are reconstructed using calorimeter energy deposits to tag ID tracks. In theZZ → `−`+`0 −`0+channel all three types of muons, “central” withpT >7 GeV, “forward” withpT>10 GeV and “calorimeter-tagged” withpT>20 GeV are used, while in theZZ →`−`+νν¯ channel, only “central” muons with p
T > 25 GeV are used. For muons
with a track in the ID (“central” and “calorimeter-tagged” muons), the ratio of the transverse impact parameter, d0, with respect to the primary vertex, to its uncertainty (d0 significance), must be smaller than 3.0 and the longitudinal impact parameter, |z0| ×sinθ, must be less than 0.5 mm. Isolated muons
are then selected based on track or calorimeter requirements. Track isolation is imposed on “central” and “calorimeter-tagged” muons, by requiring the scalar sum of thepTof the tracks originating from the primary vertex inside a cone of size∆R = 0.2 around the muon to be less than 15% of the muon pT.
Similarly, calorimeter isolation requires the sum of the calorimeter transverse energy in a cone of size
∆R=0.2 around the muon candidate to be less than 15% of the muonpT. For theZZ→`−`+νν¯ channel, both track and calorimeter isolation are imposed on muons, while for theZZ →`−`+`0 −`0+channel, for “central” muons, calorimeter isolation is not required, as it does not offer any extra background rejection, and for “forward” muons, where track isolation is not possible, only calorimeter isolation is required.
Electron candidates in the central region are reconstructed from energy clusters in the calorimeter matched to an ID track [60]. The lateral and transverse shapes of the cluster must be consistent with those of an electromagnetic shower. The transverse energy of the electron, ET, must be greater than 7 GeV for the
ZZ→`−`+`0 −`0+channel and greater than 25 GeV for theZZ→`−`+νν¯channel, while the pseudorapid-ity of the electromagnetic cluster for both channels must be|η|<2.47. To ensure that electron candidates originate from the primary vertex, thed0 significance of the electron must be smaller than 6.0 and the longitudinal impact parameter,|z0| ×sinθ, must be less than 0.5 mm. The electron candidates must be
isolated; therefore, the scalar sum of the transverse momentum of all the tracks inside a cone of size
∆R = 0.2 around the electron must be less than 15% of the pT of the electron. Calorimeter isolation requires the total transverse energy,ET, corrected for pile-up effects in an isolation cone of size∆R=0.2
to be less than 15% of the electronpTand is required only for theZZ→`−`+νν¯ channel.
To further increase the detector acceptance in theZZ → `−`+`0 −`0+ channel, “forward” electrons are used, extending the pseudorapidity coverage to 2.50 < |η| < 3.16 and 3.35 < |η| < 4.90 [61]. These “forward” electrons haveET > 20 GeV, without any track or calorimeter isolation requirements.
Bey-ond|η| = 2.5 there is no ID coverage for tracking, so these electrons are reconstructed from calorimeter information alone. No calorimeter isolation is used for electrons in this region as the calorimeter seg-mentation is too coarse.
to objects. Calorimeter cells are calibrated to the jet energy scale (JES) if they are associated with a jet and to the electromagnetic energy scale otherwise [62].
Jets are reconstructed using the anti-kt algorithm [27] with a radius parameterR=0.4, using topological
clusters of energy deposition in the calorimeter. Jets arising from detector noise or non-collision events are rejected. The jet energy is corrected to account for detector and pile-up effects and is calibrated to account for the different response of the calorimeters to electrons and hadrons, using a combination of simulations and in situ techniques [63–65]. In order to reject jets from pile-up, the summed scalar
pT of tracks associated with both the jet and the primary vertex is required to be greater than 50% of
the summed scalar pT of all tracks associated with the jet. This criterion is only applied to jets with
pT <50 GeV and|η|<2.4. Jets used in this analysis are required to have|η|<4.5 andpT>25 GeV. Jets
that are within∆R=0.3 to an electron or muon that passes the selection requirements are not considered in the analysis.
6.3 Event selection
6.3.1 Z Z →`−`+`0 −`0+selection
TheZZ→`−`+`0 −`0+events are characterized by two pairs of oppositely charged, same-flavour leptons. Events fall into three categories: e−e+e−e+, e−e+µ−µ+ andµ−µ+µ−µ+. Selected events are required to have exactly four isolated leptons above the pT threshold. At least one lepton with pT > 25 GeV must
be matched to a trigger object. In the e−e+e−e+ and µ−µ+µ−µ+ decay modes, there is an ambiguity when pairing leptons to formZ candidates. A pairing procedure to form the candidates is used, which minimizes the quantity|m`−`+−mZ|+|m`0 −`0+ −mZ|, wherem`−`+, andm`0 −`0+ are the invariant masses of the two lepton pairs of a given pairing from the quadruplet, and mZ is the Z mass [66]. The two Z
candidates must have masses in the range 66<m`−`+ <116 GeV. All leptons are required to be separated by∆R > 0.2. Each event is allowed to have a maximum of one extension lepton per category (forward electron, forward muon, or calorimeter-tagged muon) and each lepton pair may only have one extension lepton. In this way, an event must contain at least two central leptons and may contain two extension leptons of different types, as long as they are each paired with a central lepton. Events with a forward electron have the additional requirement that the central electron that is paired with the forward electron must have a transverse momentum of at least 20 GeV instead of 7 GeV.
6.3.2 Z Z →`−`+ν¯νselection
In the ZZ → `−`+νν¯ channel, final states with electron or muon pairs and large ETmiss are considered. Candidate events must have exactly two opposite-sign, same-flavour isolated leptons of pT > 25 GeV.
At least one of the two leptons must be matched to a trigger object. The invariant mass of the leptons must be in the range 76 < m`−`+ < 106 GeV. The mass-window requirement is stricter than in the
ZZ → `−`+`0 −`0+ channel in order to suppress backgrounds, which could produce real or fake lepton pairs close to theZ mass. Leptons are also required to have an angular separation of ∆R > 0.3. The selection ofZZ →`−`+νν¯candidate events requires that theE~Tmissbe highly anti-collinear with the~pTof
as mismeasuredEmissT would in general not have theE~Tmissanti-parallel to the~pTof theZcandidate. The
pT-balance, defined by|ETmiss− pZT|/pZT, is required to be less than 0.4 in order to distinguish the signal
ZZ → `−`+νν¯ from the background, such asZ + jets. In order to suppress thett¯and single-top-quark backgrounds, events are required not to have any reconstructed jet withpT > 25 GeV and|η|<4.5. This
requirement is referred to as the “jet veto”. Finally, to suppressWZbackground, a veto on a third electron (muon) withpT>7 GeV (6 GeV) is applied.
7 Background estimation
7.1 Z Z → `−`+`0 −`0+backgrounds
Backgrounds to the ZZ → `−`+`0 −`0+ channel are events in which four objects identified as isolated, prompt leptons have paired-lepton invariant masses in the signal region 66 < m`−`+ < 116. The leptons of background events in the ZZ → `−`+`0 −`0+ channel can either be “true” leptons from the decays ofZ bosons,W± bosons, or top quarks or they can be “fake” leptons that are defined as jets which are misidentified as leptons or leptons that come from hadronic decays. Background events in which all four leptons are true leptons are called the “irreducible background” as these events have the same signature as the signal events in this channel. In the SM, there are few final states with significant cross sections that can produce four true leptons. The largest sources of irreducible backgrounds arettZ¯ andZZZ∗/ZWW∗
production and events with DPI that separately produceZ bosons that each decay to two leptons. The contributions from each of these background sources are estimated from MC simulations that have been scaled to 20.3 fb−1and can be found in Table3. The systematic uncertainty for the irreducible background is neglected. The cross sections for these processes are much smaller than for the signal, and their overall contribution to the total background is small.
Source e−e+e−e+ µ−µ+µ−µ+ e−e+µ−µ+ `−`+`0 −`0+
ZZZ∗/ZWW∗ 0.12±0.01 0.19±0.01 0.28±0.02 0.58±0.02 DPI 0.13±0.01 0.15±0.01 0.29±0.01 0.57±0.02
tt Z¯ 0.15±0.03 0.16±0.03 0.35±0.05 0.66±0.07
Total irreducible background 0.40±0.04 0.50±0.04 0.93±0.05 1.82±0.08
Table 3: Number of events from the irreducible background SM sources that can produce four true leptons scaled to 20.3 fb−1. The full event selection is applied along with all corrections and scale factors. The errors shown are
statistical only.
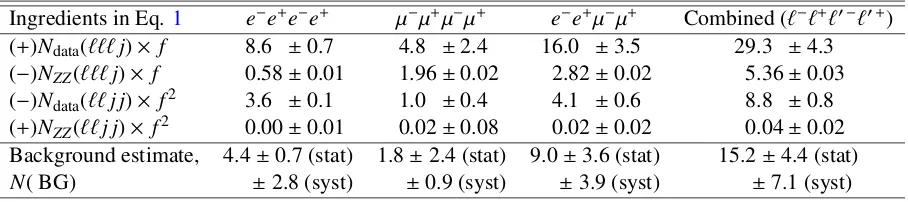
Background events containing one or more fake leptons, constitute the “reducible background”. The dominant reducible background contributions toZZ →`−`+`0 −`0+production areZ +jets,WW +jets, and top quark (tt¯and single-top quark) events in which two prompt leptons are paired with two jets or leptons from a heavy-flavour decay which are misidentified as isolated leptons. Additional background arises fromWZ+jets events containing three true leptons and one fake lepton. To estimate backgrounds containing fake leptons, the data-driven method employed in the ATLAS measurement at 7 TeV [16] is used and only a summary of the relevant parameters is given here.
Ingredients in Eq.1 e−e+e−e+ µ−µ+µ−µ+ e−e+µ−µ+ Combined (`−`+`0 −`0+) (+)Ndata(```j)× f 8.6 ±0.7 4.8 ±2.4 16.0 ±3.5 29.3 ±4.3 (−)NZZ(```j)× f 0.58±0.01 1.96±0.02 2.82±0.02 5.36±0.03
(−)Ndata(``j j)× f2 3.6 ±0.1 1.0 ±0.4 4.1 ±0.6 8.8 ±0.8
(+)NZZ(``j j)× f2 0.00±0.01 0.02±0.08 0.02±0.02 0.04±0.02
Background estimate, 4.4±0.7 (stat) 1.8±2.4 (stat) 9.0±3.6 (stat) 15.2±4.4 (stat)
[image:12.595.79.533.97.198.2]N( BG) ±2.8 (syst) ±0.9 (syst) ±3.9 (syst) ±7.1 (syst)
Table 4: The number ofZZbackground events from sources with fake leptons estimated using the data-driven fake-factor method in 20.3 fb−1of data. The uncertainties quoted are statistical only, unless otherwise indicated, and
combine the statistical uncertainty in the number of observed events of each type and the statistical uncertainty in the associated fake factor. The systematic uncertainty is shown for the background estimate in each final state.
lepton type. For muons, the relaxed criteria give fully selected muons except that they either fail the isolation requirement or fail the impact parameter requirement but not both. For electrons with|η|<2.47, the relaxed criteria give clusters in the electromagnetic calorimeter matched to ID tracks that fail either the strict identification requirement or the isolation requirement but not both. For electrons with|η|>2.5, the relaxed criteria give electromagnetic clusters that are reconstructed as electrons but fail the identification requirement. All events are otherwise required to satisfy the full event selection.
The expected number of reducible background`−`+`0 −`0+events,N(BG), is calculated as:
N( BG)=[Ndata(```j)−NZZ(```j)]× f−[Ndata(``j j)−NZZ(``j j)]× f2 (1)
where double counting from```jand``j jevents is accounted for, and the termsNZZ(```j) andNZZ(``j j)
are MC estimates correcting for contributions from signalZZ → `−`+`0 −`0+events having one or two real leptons that instead satisfy the relaxed lepton selection criteria (j).
The factor fis calculated as a function of the pTandηof the fake lepton and is the ratio of the probability
for a fake lepton to satisfy the full lepton selection criteria to the probability of the fake lepton only satisfying the relaxed lepton criteria. It is measured in a control sample of data events that contains aZ
boson candidate consisting of a pair of isolated same-flavour opposite-sign electrons or muons. In these events, f is measured using the leptons and relaxed leptons not assigned to theZ boson and is found to vary from 0.082±0.001 (0.33±0.01) for pT <10 GeV to 0.027±0.001 (0.72±0.11) forpT > 40 GeV for electrons (muons). The quoted uncertainties are statistical. The weighted number of data events for each of the ingredients in Equation (1) can be found in Table4.
7.2 Z Z → `−`+νν¯backgrounds
The main background sources for theZZ→`−`+νν¯channel are processes with two true isolated leptons andEmissT in the event. Such processes can be diboson WZ events, as well as ZZ → `−`+`0 −`0+ , tt¯,
W−W+, Wt, ZZ → ττνν and Z → τ−τ+. Additionally, processes such as the production of a Z or a W boson in association with jets (Z + jets, W+ jets), as well as multijets, may satisfy the ZZ →
`−`+νν¯ event selection criteria and contribute to the background. The backgrounds from diboson WZ andZZ → `−`+`0 −`0+ production are estimated from MC simulations, while, for all other background sources mentioned above, a combination of data-driven techniques and MC simulation is used for their estimation.
7.2.1 Backgrounds from leptonicW Zdecays andZ Z →`−`+`0 −`0+decays
Background events with multiple true isolated leptons may beWZ events in which both bosons decay leptonically and one of the three leptons is not reconstructed in the detector, andZZ→`−`+`0 −`0+events in which two of the four leptons are not reconstructed. After all selections, theWZevents constitute the dominant background for theZZ → `−`+νν¯ channel. Although this background is estimated only from MC simulation, the simulation is validated using events in dedicated control regions,eee,µµµ,µµeand
eeµ, in which a third lepton is required in addition to the full selection criteria. No significant difference between data and MC simulation is observed in the three-lepton control regions and therefore no scaling is applied to the MC prediction in the signal region. The background due toWZ events is estimated to be 16.7±1.1(stat)±1.7(syst) events in thee−e+νν¯ final state and 18.5±1.0(stat)±1.5(syst) events in theµ−µ+νν¯ final state, and constitutes more than 50% of the total background. The background due toZZ → `−`+`0 −`0+ is small, contributing less than 2% to the total background as shown in Table5. The dominant uncertainties of this background source are theoretical, followed by uncertainties in the reconstruction correction factors applied to the simulated events. The dominant theoretical uncertainty is in the choice of QCD scale (about 7%), while the PDF uncertainties are less than 1%.
7.2.2 Backgrounds fromtt¯,W−W+,W t,Z Z →ττννand Z →τ−τ+
The background contribution from these processes is measured by extrapolating from a control region formed by events with one electron and one muon (instead of two electrons or two muons), which other-wise satisfy the fullZZ→`−`+νν¯selection. Thiseµregion is free from signal events. The extrapolation from theeµcontrol region to theeeorµµsignal regions takes into account the relative branching frac-tions (2 : 1 : 1 foreµ : ee : µµ), as well as the ratio of the efficiencies ee orµµ, for the ee orµµ
selections to the efficiencyeµ for theeµselection. These efficiency ratios are not equal to unity because
7.2.3 W+jets and multijet background
Leptons originating from semileptonic decays of heavy-flavour hadrons may also contribute in the elec-tron or muon final states. However, this background is highly suppressed because of the dilepton mass requirement in the signal selection. TheW+jets and multijet background is estimated using the “matrix method” technique [67]. The fraction of events in the signal region that contain at least one fake lepton is estimated by extrapolating from a background-dominated control region to the signal region using factors measured in data. The contribution of this background to the total background is 8% in thee−e+νν¯final state and negligible in theµ−µ+νν¯ final state. The dominant systematic uncertainty for this background is due to the uncertainty in the extrapolation factors and the limited number of events in the control regions.
7.2.4 Z+jets background
Occasionally, events with oneZboson produced in association with jets or with a photon (Z+jets, orZ+γ) may mimic signal events if they have largeEmissT due to the mismeasurement of the jets or the photon. This background of events with aZboson and jets is estimated by selecting events in data with a high-pT
photon and jets, and reweighting these events to account for differences in the Z boson and photon pT
spectra and reconstruction efficiencies. These weights are determined in a low-EmissT control region. To remove contamination to single-photon events, subtraction of non-(γ+jet) events (e.g. Z(→νν¯)+γ) is performed. The full signal selection is applied to the single-photon plus jets events, and the background is estimated by reweighting these events using weights determined from the low-EmissT control region. The procedure is repeated in bins of pZT in order to obtain the pT distribution of theZ+jets andZ +γ
backgrounds. As shown in Table5, this background is negligible in both thee−e+νν¯ andµ−µ+νν¯ final states. The dominant uncertainty for this background is due to the statistical uncertainty of non-(γ+jet) events, which are subtracted from theγ+jets sample.
7.2.5 Background summary forZ Z→`−`+ν¯ν
A summary of both the simulation-based and data-driven backgrounds in theZZ → `−`+νν¯ channel is given in Table5. The largest background contributions come fromWZandtt¯,W−W+,Wt,ZZ →ττνν, andZ →τ−τ+. Several of the techniques used to determine the data-driven backgrounds require subtrac-tion of non-background processes so that negative background estimates may result when extrapolating to the signal region. Background estimates are required to have a minimum value of zero but are allowed to fluctuate positively within their uncertainty bounds during the cross-section extraction.
8 Event yields
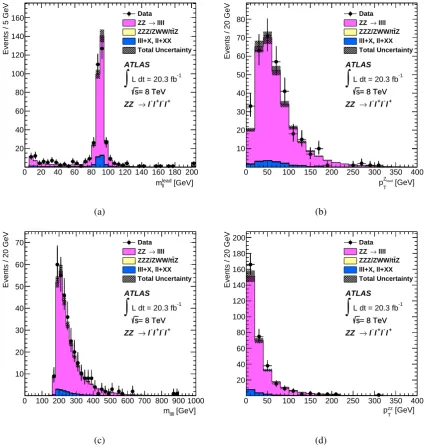
The observedZZ→`−`+`0 −`0+andZZ→`−`+νν¯number of candidates in the data, the total background estimates and the expected signal for the individual decay modes, as well as their combinations, are shown in Table6. The kinematic distributions of the leading lepton pair mass (the pair with the larger transverse momentum of the two pairs of leptons),mlead`−`+, the transverse momentum of the leadingZboson (the Z boson that decays to the leading lepton pair), pZlead
T , the mass of the four leptons, m`−`+`0 −`0 −, as well as
Source e−e+νν¯ µ−µ+νν¯
WZ 16.7±1.1±1.7 18.5±1.0±1.5
ZZ→`−`+`0 −`0+ 0.6±0.1±0.1 0.6±0.1±0.1
tt¯,W−W+,Wt,ZZ→ττνν,Z →τ−τ+ 13.3±3.2±0.2 15.4±3.6±0.3
W+jets 2.6±1.1±0.5 −0.9±0.7±1.0
Z+jets −0.7±3.5±2.7 −0.5±3.8±2.9
[image:15.595.130.482.95.227.2]Total background 32.4±5.5±3.3 33.2±6.0±3.4
Table 5: Number of background events for simulation-based and data-driven estimates in theZZ → `−`+νν¯ chan-nel (e−e+νν¯ andµ−µ+νν¯). The first uncertainty is statistical and the second systematic. The exact treatment of background estimates for the cross-section extraction is discussed in the text.
ZZ→`−`+`0 −`0+ e−e+e−e+ µ−µ+µ−µ+ e−e+µ−µ+ `−`+`0 −`0+
Observed data 64 86 171 321
Expected signal 62.2±0.3±2.6 83.7±0.4±3.2 141.6±0.6±4.0 287.0±0.8±8.1 Expected background 4.8±0.7±2.8 2.3±2.4±1.0 10.0±3.6±3.9 17.1±4.4±7.1
ZZ→`−`+νν¯ e−e+νν¯ µ−µ+νν¯ `−`+νν¯
Observed data 102 106 208
Expected signal 51.1±0.9±2.6 55.1±1.0±2.9 106.2±1.3±3.9 Expected background 32.4±5.5±3.3 33.2±6.0±3.4 65.6±8.1±4.7
Table 6: Summary of observedZZ → `−`+`0 −`0+ andZZ → `−`+νν¯ candidates in the data, total background estimates and expected signal for the individual decay modes and for their combination (last column). The first uncertainty quoted is statistical, while the second is systematic. The uncertainty in the integrated luminosity (1.9%) is not included.
final states, are shown in Figure2. Figure3shows the mass of the leading lepton pair versus the mass of the subleading lepton pair for the data and predicted signal events in theZZ→`−`+`0 −`0+channel.
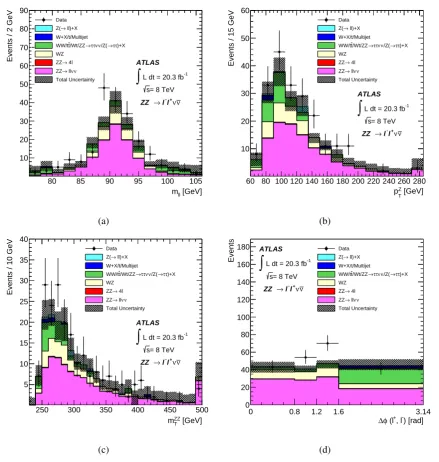
The kinematic distributions of the lepton pair mass,m`−`+, thepZ
T, the transverse mass
3of theZZsystem,
mZZT , and the azimuthal angle between the two leptons (electrons or muons) originating from theZboson,
∆φ(`+, `−), for theZZ →`−`+νν¯ candidates in both lepton final states, are shown in Figure4.
3The transverse mass,mZZ
T , is defined as:m
ZZ
T =
r q
p2 T+m
2
Z+
q
Emiss 2
T +m
2
Z
2
[image:15.595.79.528.285.440.2][GeV]
lead ll
m
0 20 40 60 80 100 120 140 160 180 200
Events / 5 GeV
20 40 60 80 100 120 140
160 DataZZ → llll
Z t ZZZ/ZWW/t lll+X, ll+XX Total Uncertainty -1
L dt = 20.3 fb
∫
= 8 TeV s= 8 TeV s ATLAS + l -l + l l → ZZ (a) [GeV] lead Z T p
0 50 100 150 200 250 300 350 400
Events / 20 GeV
10 20 30 40 50 60 70
80 DataZZ → llll
Z t ZZZ/ZWW/t lll+X, ll+XX Total Uncertainty -1
L dt = 20.3 fb
∫
= 8 TeV s= 8 TeV s ATLAS + l -l + l l → ZZ (b) [GeV] llll m
0 100 200 300 400 500 600 700 800 900 1000
Events / 20 GeV
10 20 30 40 50 60 70 Data llll → ZZ Z t ZZZ/ZWW/t lll+X, ll+XX Total Uncertainty -1
L dt = 20.3 fb
∫
= 8 TeV s= 8 TeV s ATLAS + l -l + l l → ZZ (c) [GeV] zz T p
0 50 100 150 200 250 300 350 400
Events / 20 GeV
20 40 60 80 100 120 140 160 180 200 Data llll → ZZ Z t ZZZ/ZWW/t lll+X, ll+XX Total Uncertainty -1
L dt = 20.3 fb
∫
[image:16.595.94.519.160.608.2]= 8 TeV s= 8 TeV s ATLAS + l -l + l l → ZZ (d)
Figure 2: Kinematic distributions forZZ→`−`+`0 −`0+candidates in all four-lepton final states:(a)mlead
`−`+,(b)pZleadT , (c)m`−`+`0 −`0 − and(d) pZZ
T . The points represent the observed data and the histograms show the expected number
Subleading lepton pair mass [GeV]
0 50 100 150 200 250
Leading lepton pair mass [GeV]
0 50 100 150 200 250
-1
L dt = 20.3 fb
∫
= 8 TeV s= 8 TeV s
ATLAS
+
l
-l
+
l
l → ZZ
Data llll
→
[image:17.595.194.416.99.308.2]ZZ
Figure 3: The mass of the leading lepton pair versus the mass of the subleading lepton pair. The events observed in the data are shown as solid circles and theZZ → `−`+`0 −`0+signal prediction from simulation, normalized to
the luminosity of the data, as pink boxes. The size of each box is proportional to the number of events in each bin. The region enclosed in the solid red box indicates the signal region defined by the requirements on the lepton pair masses forZZevents.
9 Correction factors and detector acceptance
The fiducial cross section as measured in a given phase space for a given final state,ZZ →`−`+`0 −`0+or
ZZ→`−`+νν¯, where`and`0are either an electron or a muon, may be expressed as:
σfid= Ndata−Nbkg
L ·CZZ
, (2)
where Ndata is the number of observed candidate events in data passing the full selection, Nbkg is the estimated number of background events,Lis the integrated luminosity, andCZZis the correction factor
applied to the measured cross section to account for detector effects. This factor corrects for detector inefficiencies and resolution and is defined as:
CZZ=
NZZreco
NZZfid , (3)
where the numerator, NrecoZZ , is the expected yield of reconstructedZZ events in the signal region after the full selection is applied, and the denominator,NZZfid, is the generated yield ofZZevents in the fiducial phase space defined for a given final state. It is determined using simulated ZZ production samples. The numbers of eventsNZZrecoand NZZfid found in each sample (PowhegBoxandgg2VV) are weighted by
the relative cross sections of the two samples in order to combine them in the ratio. In the calculation ofCZZ forZZ → `−`+`0 −`0+final states, pairs of oppositely charged leptons produced from decays of
[GeV]
ll
m
80 85 90 95 100 105
Events / 2 GeV
10 20 30 40 50 60 70 80 90 Data ll)+X → Z( W+X/t/Multijet )+X τ τ → /Z( ν ν τ τ → /Wt/ZZ t WW/t WZ 4l → ZZ ν ν ll → ZZ Total Uncertainty ATLAS -1
L dt = 20.3 fb
∫
= 8 TeV s ν ν + l l → ZZ (a) [GeV] Z T p 60 80 100 120 140 160 180 200 220 240 260 280
Events / 15 GeV
10 20 30 40 50 60 Data ll)+X → Z( W+X/t/Multijet )+X τ τ → /Z( ν ν τ τ → /Wt/ZZ t WW/t WZ 4l → ZZ ν ν ll → ZZ Total Uncertainty ATLAS -1
L dt = 20.3 fb
∫
= 8 TeV s ν ν + l l → ZZ (b) [GeV] ZZ T m
250 300 350 400 450 500
Events / 10 GeV
5 10 15 20 25 30 35 40 Data ll)+X → Z( W+X/t/Multijet )+X τ τ → /Z( ν ν τ τ → /Wt/ZZ t WW/t WZ 4l → ZZ ν ν ll → ZZ Total Uncertainty ATLAS -1
L dt = 20.3 fb
∫
= 8 TeV s ν ν + l l → ZZ (c) ) [rad] -, l + (l φ ∆ Events 0 20 40 60 80 100 120 140 160 180
0 0.8 1.2 1.6 3.14
Data ll)+X → Z( W+X/t/Multijet )+X τ τ → /Z( ν ν τ τ → /Wt/ZZ t WW/t WZ 4l → ZZ ν ν ll → ZZ Total Uncertainty ATLAS -1
L dt = 20.3 fb
∫
[image:18.595.90.530.151.614.2]= 8 TeV s ν ν + l l → ZZ (d)
Figure 4: Kinematic distributions forZZ → `−`+νν¯ candidates in both lepton final states: (a)m`−`+,(b) pZ
T,(c)
mZZ
T and(d)∆φ(`+, `
−). The points represent the observed data and the histograms show the expected number of
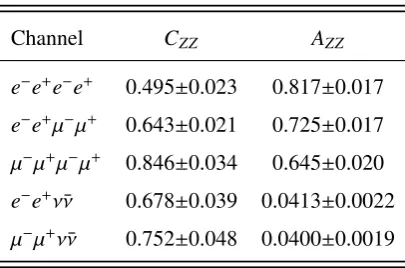
Channel CZZ AZZ
e−e+e−e+ 0.495±0.023 0.817±0.017
e−e+µ−µ+ 0.643±0.021 0.725±0.017
µ−µ+µ−µ+ 0.846±0.034 0.645±0.020
e−e+νν¯ 0.678±0.039 0.0413±0.0022
[image:19.595.203.406.95.229.2]µ−µ+νν¯ 0.752±0.048 0.0400±0.0019
Table 7: TheCZZ andAZZ factors for each of theZZ → `−`+`0 −`0+andZZ → `−`+νν¯decay modes. The total
uncertainties (statistical and systematic) are shown and a description of the systematic uncertainties can be found in Section10.
The total cross section as measured in a particular final state may be expressed as:
σtot= Ndata−Nbkg
L ·CZZ·AZZ·BF =
σfid
AZZ·BF
, (4)
where BF is the branching fraction ofZZto a particular final state (0.113% fore−e+e−e+andµ−µ+µ−µ+ final states, 0.226% for thee−e+µ−µ+final state and 2.69% for the`−`+νν¯channel) andAZZis the detector
acceptance as measured in a particular decay mode and is determined at particle level. The acceptance factor is defined as:
AZZ =
NZZfid
NZZtot, (5)
where the numerator,NZZfid, is again the number ofZZevents predicted in the fiducial phase space, and the denominator,NZZtot, is the number ofZZevents predicted in the total phase space.
According to Equation (4), the acceptance for the total phase-space events in the signal region is given by the quantityCZZ·AZZ·BF. The purpose of this factorization is to separate the term that is sensitive to
theoretical uncertainties (AZZ) from the term representing primarily detector efficiency (CZZ).
TheCZZ andAZZ factors are shown in Table7for all decay modes considered here. The acceptance in
theZZ → `−`+νν¯ channel is much smaller than the one in theZZ → `−`+`0 −`0+channel mainly due to the axial-EmissT and jet veto requirements, which reduce the number of selected events by about 86% and 40% respectively.
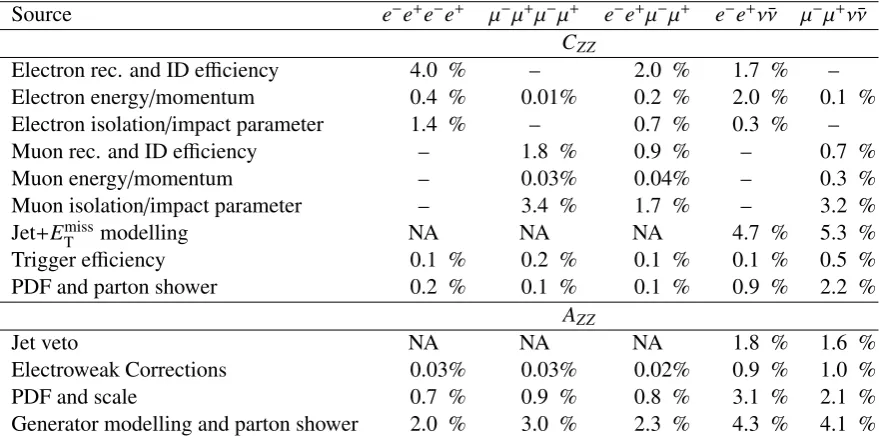
10 Systematic uncertainties
Systematic uncertainties arise from theoretical and experimental sources, which affect the correction factor,CZZ, the detector acceptance, AZZ, the number of expected background events, and the extracted
aTGCs limits. These uncertainties are also propagated through the unfolding procedure (Section11.2) to obtain the differential distributions. A summary of these uncertainties is shown in Table8.
The dominant experimental uncertainties depend on both the channel and final state under study. In the
parameter uncertainties have the largest effect, while in theZZ →`−`+νν¯ channel, the modelling of the jets and the measurement of theETmissare the dominant uncertainties. The systematic uncertainties due to lepton reconstruction are estimated using theZ →`+`−andW →`νprocesses as described in Refs. [59,
60,68]. For final states with electrons, the electron reconstruction uncertainty is about 4.0%, 2.0% and 1.7% in theZZ → e−e+e−e+,ZZ → e−e+µ−µ+ andZZ → e−e+νν¯ final states, respectively. Modelling of the isolation of muons along with their reconstructed impact parameter relative to the reconstructed collision vertex are the dominant effects onCZZfor final states with muons, having contributions of 3.4%
and 3.2% in theZZ →µ−µ+µ−µ+andZZ →µ−µ+νν¯ final states, respectively.
Uncertainties in the modelling of the jets andEmissT are significant in theZZ → `−`+νν¯ channel due to the jet veto requirement and the axial-EmissT > 90 GeV selection. The JES uncertainty4 corresponding to the local cluster weighting calibration scheme is obtained using data from test-beams, LHC collision data and simulations [69,70] and is provided in bins of jet pT and|η|. The jet energy resolution (JER) and its uncertainty are determined using in situ techniques based on the transverse momentum balance in dijet events. The impact due to the uncertainty on the resolution is evaluated by smearing the pT of the
jets within its uncertainty. The reconstruction of theEmissT is affected by uncertainties associated with the leptons, JES and JER that are propagated to theEmissT determination. As there are no requirements on either jet reconstruction orEmissT for theZZ → `−`+`0 −`0+channel, the impact of these uncertainties is negligible for these final states.
The uncertainty in the integrated luminosity is 1.9%. This affects the overall normalization ofZZ produc-tion for the total cross-secproduc-tion measurement and the unfolded differential distributions.
In addition to experimental uncertainties, the measurements are subject to sources of theoretical uncer-tainty. The correction factor and detector acceptance forZZ→`−`+`0 −`0+andZZ →`−`+νν¯final states are calculated using PowhegBoxinterfaced to Pythia for the qq¯ component, and using gg2VV for the
gg→ZZcomponent. These calculations are sensitive to the choice ofµRandµFscales, as they are
miss-ing higher terms from the perturbative expansion. The uncertainty associated with this choice is estimated by comparing the detector acceptance, AZZ, when theµR andµF scales are increased and decreased by
a factor of two, with the nominal. The uncertainty associated with the jet veto in theZZ → `−`+νν¯ fi-nal state is determined via the Stewart and Tackmann method [40] using the jet veto efficiency for each sample generated with differentµRandµFscales.
The choice of parton shower and underlying-event modelling is one of the smaller sources of theoretical uncertainty and its effect is estimated in two ways. First,AZZis recalculated from MC samples generated
with PowhegBoxbut interfaced with Herwigfor the parton showering instead of Pythiaas is done for
the nominal samples. The uncertainty is estimated from the difference inAZZfor the Herwigand Pythia
showered samples. The second method usesZZ samples generated using Sherpato calculate bothCZZ
andAZZ. Sherpais formally a LO generator with respect to theqq¯process, and does not include the gluon
diagrams. However, Sherpauses its own matrix-element generation and parton shower algorithms, and
can be used to provide an estimate of the effects of the uncertainty due to the choice of parton shower. As in the first method, the uncertainty is estimated using the difference inCZZ andAZZ calculated using the
nominal and Sherpasamples.
As described in Section4, the predicted cross sections for theZZfinal states are corrected for virtual NLO EW effects by applying a reweighting factor to each event. The uncertainty in this reweighting procedure
4The JES uncertainty is fully parameterized by 56 nuisance parameters resulting from various estimation techniques including
is estimated by combining the uncertainty in the theoretical predictions used to estimate the NLO EW effects and the statistical uncertainty from its prediction. These uncertainties are added in quadrature.
The choice of PDF represents an additional source of uncertainty. To estimate this theoretical uncertainty, the eigenvectors of the CT10 PDF set are varied within their±1σuncertainties. The same procedure is followed for the backgrounds estimated from simulation where the CT10 PDF set is used.
Source e−e+e−e+ µ−µ+µ−µ+ e−e+µ−µ+ e−e+νν µ¯ −µ+νν¯
CZZ
Electron rec. and ID efficiency 4.0 % – 2.0 % 1.7 % –
Electron energy/momentum 0.4 % 0.01% 0.2 % 2.0 % 0.1 %
Electron isolation/impact parameter 1.4 % – 0.7 % 0.3 % –
Muon rec. and ID efficiency – 1.8 % 0.9 % – 0.7 %
Muon energy/momentum – 0.03% 0.04% – 0.3 %
Muon isolation/impact parameter – 3.4 % 1.7 % – 3.2 %
Jet+ETmissmodelling NA NA NA 4.7 % 5.3 %
Trigger efficiency 0.1 % 0.2 % 0.1 % 0.1 % 0.5 %
PDF and parton shower 0.2 % 0.1 % 0.1 % 0.9 % 2.2 %
AZZ
Jet veto NA NA NA 1.8 % 1.6 %
Electroweak Corrections 0.03% 0.03% 0.02% 0.9 % 1.0 %
PDF and scale 0.7 % 0.9 % 0.8 % 3.1 % 2.1 %
[image:21.595.85.525.183.402.2]Generator modelling and parton shower 2.0 % 3.0 % 2.3 % 4.3 % 4.1 %
Table 8: A summary of the systematic uncertainties, as relative percentages of the correction factorCZZ and the
detector acceptanceAZZ is shown. For rows with multiple sources, the uncertainties are added in quadrature.
Dashes indicate uncertainties which are smaller than 0.01% and uncertainites with NA are not applicable for that specific final state.
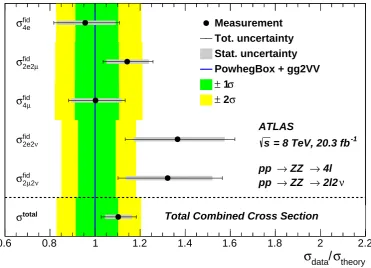
11 Cross-section measurements
11.1 Cross-section extraction
Measurement Prediction
σfid
ZZ→e−e+e−e+ = 5.9 ±0.8 (stat) ±0.4 (syst) ±0.1 (lumi) fb 6.2 +−00..65fb
σfid
ZZ→e−e+µ−µ+ = 12.4±1.0 (stat) +−00..65(syst) +−00..32(lumi) fb 10.8 +−11..10fb
σfid
ZZ→µ−µ+µ−µ+ = 4.9 −+00..65(stat) +−00..32(syst) ±0.1 (lumi) fb 4.9 +−00..54fb
σfid
ZZ→e−e+νν¯ = 5.0 +−00..78(stat) +−00..45(syst) ±0.1 (lumi) fb 3.7 ±0.3 fb
σfid
ZZ→µ−µ+νν¯ = 4.7 ±0.7 (stat) +−00..54(syst) ±0.1 (lumi) fb 3.5 ±0.3 fb
σtotal
pp→ZZ = 7.3 ±0.4 (stat) ±0.3 (syst) +
0.2
−0.1(lumi) pb 6.6 + 0.7
[image:22.595.127.486.99.256.2]−0.6pb
Table 9: The measured fiducial cross sections and the combined total cross section compared to the SM predictions. For experimental results, the statistical, systematic, and luminosity uncertainties are shown. For the theoretical predictions, the combined statistical and systematic uncertainty is shown.
theory
σ
/
data
σ
0.6 0.8 1 1.2 1.4 1.6 1.8 2 2.2
Measurement Tot. uncertainty Stat. uncertainty PowhegBox + gg2VV
σ
1
± σ
2
±
4e fid
σ
µ
2e2 fid
σ
µ
4 fid
σ
ν
2e2 fid
σ
ν
2
µ
2 fid
σ
total
σ
ATLAS
4l
→
ZZ
→
pp
ν
2l2
→
ZZ
→
pp
-1
= 8 TeV, 20.3 fb s
Total Combined Cross Section
[image:22.595.119.491.320.588.2]11.2 Differential cross sections
The differential cross sections presented in this section allow a more detailed comparison of the meas-urement to current and future theoretical predictions. The measured kinematic distributions are unfolded back to the underlying distributions, accounting for the effect of detector resolution, efficiency and ac-ceptance. The unfolding as a function of different kinematic variables is performed separately for the two channels. More specifically, it is performed within the fiducial phase space of theZZ →`−`+νν¯ measure-ment and within the total phase space of theZZ →`−`+`0 −`0+measurement, defined in Section3. This different approach between the channels is chosen to benefit from the extended fiducial phase space for leptons in theZZ→`−`+`0 −`0+channel.
The unfolding procedure is based on a Bayesian iterative algorithm [72]. In the unfolding of binned data, the effects of the experimental acceptance and resolution are expressed in terms of a two-dimensional response matrix,Ai j, where each element corresponds to the probability of an event in thei-th
generator-level bin being reconstructed in the j-th measurement bin. The unfolding algorithm combines the meas-ured spectrum with the response matrix to form a likelihood, takes as input a prior for the specific kin-ematic variable and iterates using the posterior distribution as prior for the next iteration. The SM predic-tion calculated using the PowhegBoxandgg2VVgenerators is used as the initial prior and three iterations
are performed. The number of iterations is optimized to find a balance between too many iterations, causing high statistical uncertainties associated with the unfolded spectra, and too few iterations, which increases the dependency on the MC prior.
The statistical uncertainty of the unfolded distribution is tested via toy-MC tests. Each measured data-point is Poisson fluctuated and the full nominal unfolding procedure is applied. This is repeated 2000 times and the root mean square of the resulting unfolded values is taken as the unfolded distribution’s statistical uncertainty.
The systematic uncertainties are estimated as follows: for each scale, efficiency or resolution systematic uncertainty, a new response matrix is produced reflecting a variation by that systematic uncertainty. The measured data distribution is then unfolded for all instances separately, leading to one distribution for each systematic uncertainty. The difference between each of the distributions that correspond to the different systematic uncertainties and the nominal distribution, where no variation has been applied, is defined as the systematic uncertainty in each bin.
Uncertainties on the unfolding due to imperfect description of the kinematic properties of the data by the MC are evaluated using a data-driven method [73], where the MC differential distribution is corrected to match the data distribution and the resulting weighted MC distribution at reconstruction level is unfolded with the response matrix used in the actual data unfolding. The new unfolded distribution is compared to the weighted MC distribution at generator level and the difference is taken as the systematic uncertainty. Moreover, in theZZ →`−`+`0 −`0+channel, as the unfolding is performed within the total phase space, theoretical uncertainties due to this extrapolation are also considered. These uncertainties include the choice ofµRandµFscales, which access the impact of higher-order contributions from QCD, the PDF
set, and the parton shower modelling. The latter is estimated by comparisons with SherpaZZsamples.
11.2.1 Z Z→`−`+`0 −`0+channel
The kinematic distributions that are unfolded in this channel are thepZlead
T , the number of jets in associated
production withZZ → `−`+`0 −`0+ (Njets), the azimuthal angle between the two leptons (electrons or muons) originating from the leadingZ boson (∆φ(`+, `−)lead) and the difference in rapidity between the
two Z bosons of the ZZ system (∆y(Z,Z)). The differential cross sections and their comparison with the SM predictions (PowhegBox andgg2VV) are shown in Figure 6. The dominant uncertainty is the
statistical uncertainty of the data, ranging from 7% to 17% in most bins. The theoretical modelling uncertainties are of the order of 1%–3%. According to Figure6(b), more than 70% ofZZ→`−`+`0 −`0+ events are produced without any associated high-pT jets, and this is well modelled by MC simulation. The measurement is consistent with the SM prediction within 1σin most of the bins.
11.2.2 Z Z→`−`+ν¯νchannel
The kinematic distributions that are unfolded in this channel are the pZT of the Z boson that decays to electrons or muons, the azimuthal angle between the two leptons (electrons or muons) originating from theZboson (∆φ(`+, `−)) and the transverse mass of theZZsystem (mZZT ).
The differential cross sections are shown in Figure7. The measured values are compared with the SM predictions (PowhegBox and gg2VV). The theoretical modelling uncertainties, evaluated by the
data-driven method described in Section11.2, are in the order of a few percent (0.7%–1% for pZT , 0.7%– 1.5% for∆φ(`+, `−) and 3%–9% formZZT ). While the central values of the unfolded data differ from the prediction by up to 50% in some of the bins, the measurement is consistent with the SM prediction within 1–2σ.
12 Anomalous neutral triple gauge couplings
According to the SM SU(2)L×U(1)Ygauge symmetry, vertices of the formZZZandZZγare not present at tree level. Consequently,ZZproduction does not receive a contribution from the s-channel resonance diagram (Figure1(c)). At one-loop level, fermionic triangle loops contribute to the generation of effective neutral aTGCs at the level of 10−4to 10−3[15]. A typical signature of aTGCs is an enhanced cross section at high centre-of-mass energies. Thus, observables which are proportional to the invariant mass of the
ZZdiboson system and the gauge boson transverse momentum are particularly sensitive to contributions from aTGCs. Studies of aTGCs have been performed by the LEP Collaborations [22,74–77], as well as the CDF and D0 Collaborations. More recent studies performed by the ATLAS and CMS Collaborations using data collected during 2011 at 7 TeV indicate that if there are any contributions from new physics at the TeV scale, they are at most of the order of 10−3.
In this paper, an effective Lagrangian framework [78] is used for the aTGCs studies, where the most generalZZV (V = Z orγ) couplings, which respect gauge and Lorentz invariance [21] are considered. Such couplings can be parameterized by twoCP-violating (f4γ, f4Z) and two CP-conserving (f5γ, f5Z) parameters. The contribution of anomalous couplings to theZZproduction cross section grows with the partonic centre-of-mass energy squared, ˆs. To avoid violation of unitarity a form factor is introduced to the anomalous couplings of the form:
fiV( ˆs)= fiV,01+ sˆ
Λ2
−2
[fb/GeV] lead Z T /dp σ d 0 20 40 60 80 100 120 140 ATLAS =8 TeV s -1
L dt = 20.3 fb
∫
+ l -l + l l → ZZ Data Stat. Uncertainty Total UncertaintyPowhegBox + gg2VV
[GeV] lead
Z T
p
0-30 30-60 60-100 100-200 200-1500
Data/MC 0.5 1 1.5 (a) ] jets [fb/N jets /dN σ d 0 1000 2000 3000 4000 5000 6000 7000 8000 9000 10000 ATLAS =8 TeV s -1
L dt = 20.3 fb
∫
+ l -l + l l → ZZ Data Stat. Uncertainty Total UncertaintyPowhegBox + gg2VV
jets
N
0 1 2-10
Data/MC 0.60.8 1 1.2 1.4 (b) [pb/rad] lead ) -,l + (l φ∆ /d σ d 0 1 2 3 4 5 6 7 8 ATLAS =8 TeV s -1
L dt = 20.3 fb
∫
+ l -l + l l → ZZ Data Stat. Uncertainty Total UncertaintyPowhegBox + gg2VV
[rad] lead ) -,l + (l φ ∆
0-1.3 1.3-1.9 1.9-2.3 2.3-2.7 2.7-3.14
Data/MC 0.8 1 1.2 1.4 (c) y(Z,Z) [pb] ∆ /d σ d 0 1 2 3 4 5 6 7 8 9 ATLAS =8 TeV s -1
L dt = 20.3 fb
∫
+ l -l + l l → ZZ Data Stat. Uncertainty Total UncertaintyPowhegBox + gg2VV
y(Z,Z)
∆
0-0.4 0.4-0.8 0.8-1.2 1.2-4
Data/MC 0.60.8 1 1.2 1.4
[image:25.595.87.518.154.609.2](d)
Figure 6: The measured differential cross-section distributions (black points) normalized to the bin width for(a) pZlead
T , (b) Njets, (c) ∆φ(`+, `
−)
lead and (d) ∆y(Z,Z) in the ZZ → `−`+`0 −`0+ channel, unfolded within the total