This is a repository copy of Objective Evaluation of Fabric Pilling Using Digital Image Processing.
White Rose Research Online URL for this paper: http://eprints.whiterose.ac.uk/86673/
Version: Accepted Version
Proceedings Paper:
Jung, MH, Rhodes, PA and Clark, M (2013) Objective Evaluation of Fabric Pilling Using Digital Image Processing. In: MacDonald, L, Westland, S and Wuerger, S, (eds.) AIC Colour 2013. 12th Congress of the International Colour Association, 08-12 Jul 2013, Newcastle upon Tyne, UK. The Colour Group , pp. 1033-1036. ISBN 978-0901623027
© 2013 The Colour Group (Great Britain). This is an author produced version of a paper published in the Proceedings of AIC Colour 2013.
[email protected] https://eprints.whiterose.ac.uk/
Reuse
Unless indicated otherwise, fulltext items are protected by copyright with all rights reserved. The copyright exception in section 29 of the Copyright, Designs and Patents Act 1988 allows the making of a single copy solely for the purpose of non-commercial research or private study within the limits of fair dealing. The publisher or other rights-holder may allow further reproduction and re-use of this version - refer to the White Rose Research Online record for this item. Where records identify the publisher as the copyright holder, users can verify any specific terms of use on the publisher’s website.
Takedown
If you consider content in White Rose Research Online to be in breach of UK law, please notify us by
Objective Evaluation of Fabric Pilling Using Digital
Image Processing
Min-Ho JUNG,1 Peter A. RHODES,1 Matthew CLARK2
1
School of Design, University of Leeds
2
Society of Dyers and Colourists, United Kingdom
ABSTRACT
This study aimed to develop and evaluate a new objective pilling assessment method. Visual grading was carried out by non-experts and two expert groups. The proposed system for image acqusition utilised three linear LED sources to obtain good pill-background contrast. Pill measurement was then computed from a statistical analysis of the image. The performance of this new objective technique was verified by comparison with subjective observer grading.
1. INTRODUCTION
Pilling of fibres on the surface of fabrics is undesirable and has long been considered as a big problem in the apparel industry. It not only detracts from the appearance and handle of the substrate but it also, in some instances, affects the service life of the product. The pills are formed as a result of rubbing or friction against the same fabric or another object during wear and/or washing (Cooke 1985). Various methods have been developed and testing standards proposed, but there is still need for improvement of objective assessment. Most of the objective methods can be divided into two components: the apparatus for image capture and digital image processing. In the former stage, it is generally accepted that illumination setup is the key to differentiating between the pills and their background. According to the ISO standard (BS EN ISO 2000), good pill-background contrast indicates that shadows produced by pills appear distinct and dark due to the fact that light cannot penetrate the pills and that other areas appear bright. Since it is difficult to identify pills on a highly textured fabric, a method to remove texture structure was critical to the analysis of fabric samples in the latter stage of digital image processing.
2. SUBJECTIVE PILLING ASSESSMENT
Figure 1: Schematic of image acquisition system
As an exception, the other group performed the judgment of pilling grade without reference samples.
3. OBJECTIVE PILLING ASSESSMENT
The overall subjective pilling grading method has a number of limitations such as being a time-consuming and subjective process. To overcome these problems, an objective pilling assessment is proposed. This method can be carried out without experts or multiple observers. Hence, it can be said that objective pilling assessment is more efficient than the previous method in terms of time and cost. The determination of objective pilling grade using digital image processing can be divided into two stages: image preparation and digital image analysis.
3.1 Image Preparation
Image preparation for digital image processing was divided in three steps: image acquisition, illumination uniformity correction and normalisation. The proposed system for image acquisition is shown in Figure 1. The apparatus consists of three linear LED light sources, a digital camera and a plate for the sample. It was determined that the illumination set up is one of the most important factors for obtaining good pill- background contrast. In the new imaging system, LED lights were used as the source. Since this light has a more directional nature, it facilitates obtaining high contrast between pills and the fabric background. Three LED units were used; each unit consisted of several individual LEDs. The LED sources were designed to light the sample from three different directions in which each angle between two light sources was 120°. Using these LED lights, four images were captured under four different lighting conditions: three images with a single light on and one image with all three lights on. The locations of the shadows on the image were changed according to the angles of the lighting. This result can help identify pills through the difference in their shadows in each of the images. Also, analysing shadows can be utilised as a means of reducing fabric texture and removing noise. In the acquisition system, a digital camera was used as the detector due to its non-connect nature. This means that the delicate specimens could avoid damage or distortion. The RGB images were converted to greyscale to reduce their size and then illumination uniformity correction was applied to compensate for variations in the image resulting from the unevenness of the illumination used. Finally, a normalising process was employed to overcome the uneven surface of images caused by the flexible nature of fabric specimens. The z-score was used to standardise and hence compare data from different populations (Lewis 1999).
3.2. Digital Image Analysis
Digital image processing consists primarily of three steps: texture removal, pill enhancement and pill measurement. Texture removal is the key to
range 106 or higher, some visual detail is lost in 8-bit displays, while the log transform compresses the dynamic range resulting in a more useful tool to check peak points (Xu 1997). Using power thresholds, which were carried out twice for the image of higher dynamic range, the areas of peaks were found. After removing periodic pattern of fabrics, pill enhancement was applied to remove unwanted noise and shadows produced by threads. The first step of pill enhancement was pill identification using he four different images from three light sources positioned at three different angles. One image captured with all three lights on was combined with each image captured with a single light on using ‘min’ function. Next, a threshold was applied to remove minor noise such as fuzz and noise. Finally, the three images were combined to one image after noise reduction.
4. RESULTS AND CONCLUSIONS
[image:4.595.118.520.311.434.2]In comparing the results from the two expert groups shown in Figure 2, the grading by one expert group for the majority of samples was more widely spread than the other. The reason for this was identified as being the use of reference samples. It can be concluded that memory judgement is far less reliable for pilling assessment.
Figure 2: Comparison between expert and non-expert visual assessment
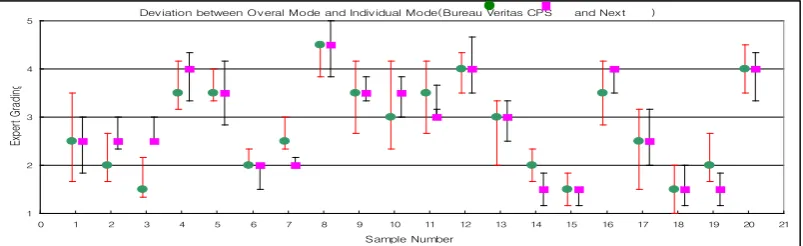
From the results of the comparison between non-experts and the combined experts shown in Figure 3, the error bars for non-experts were obviously big. It can be said that grading between non-expert observers exhibited only a weak agreement; however the average grade of the non-experts were close to those of the experts. This means that the patterns of both modes are considerably consistent and so they can be used as a reference.
Figure 3: Comparison between expert and non-expert visual assessment
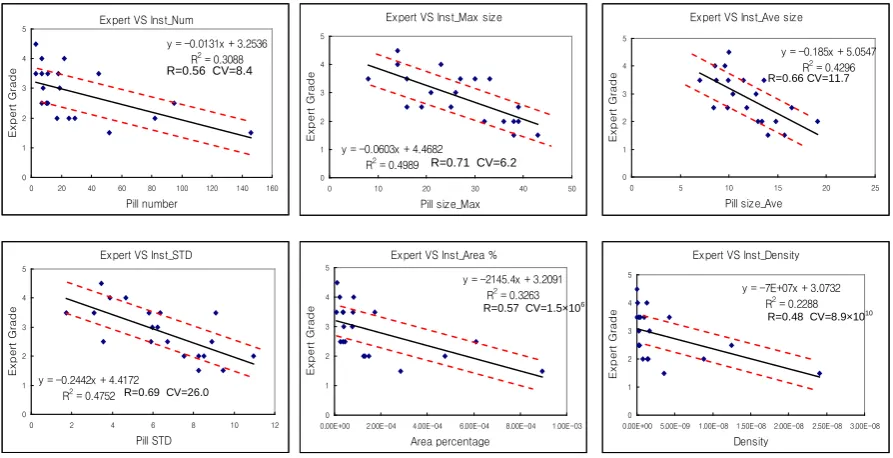
From digital image analysis, six features were extracted: pill count (number), maximum size, average size, standard deviation, area percentage and density of pills. Figure 4 shows the comparison between the results of objective pill assessment and expert grade. The red parallel lines indicate uncertainty with the black fitted lines falling within this range of
Deviation between Overal Mode and Individual Mode( Expert and Non-Expert )
1 2 3 4 5
0 1 2 3 4 5 6 7 8 9 10 11 12 13 14 15 16 17 18 19 20 21
Sample Number
Ex
pe
rt
a
nd
N
on
-E
xp
er
t G
ra
di
n
Deviation between Overal Mode and Individual Mode(Bureau Veritas CPS and Next )
1 2 3 4 5
0 1 2 3 4 5 6 7 8 9 10 11 12 13 14 15 16 17 18 19 20 21
Sample Number
Ex
pe
rt G
ra
di
[image:4.595.122.494.542.667.2]variation. In this way, it can be seen that points of features of pills were located in the range between or close to the two red lines. Therefore, considering the nature of variation of visual assessment, variation ±5, it can be said that the correlation of objective pill assessment is better than the result explained by statistical method, R and R-squared.
Figure 5: Objective method vs expert grade
Using polynomial models, 20×3 complexity, measured properties were converted into predicted grades. The coefficient of determination between predicted grade and expert grade was obtained as 1. Therefore, there is no doubt that the performance of the new objective pilling assessment is significantly reliable.
REFERENCES
Cooke, W.D. 1985. Pilling attribution and fatigue. Textile Research Journal 55(7) 409-414.
Lewis, J. P. and A. Traill. 1999. Statistics Explained, Addison-Wesley.
ISO 2001. BS EN ISO 12945-1:2001:Textiles – Determination of fabric propensity to
surface fuzzing and to pilling, Part 1: Pilling box method.
Xu, B. 1997. Instrumental evaluation of fabric pilling. Journal of the Textile Institute 88(1) 488-500.
Address: Min-Ho Jung, Colour and Imaging Science, School of Design, University of Leeds, Leeds, LS2 9JT, UK E-mails: [email protected], [email protected], [email protected]
Expert VS Inst_Num
y = -0.0131x + 3.2536 R2 = 0.3088
0 1 2 3 4 5
0 20 40 60 80 100 120 140 160
Pill number E x p e rt G ra d e
Expert VS Inst_Max size
y = -0.0603x + 4.4682 R2 = 0.4989 0 1 2 3 4 5
0 10 20 30 40 50
Pill size_Max E x p e rt G ra d e
Expert VS Inst_Ave size
y = -0.185x + 5.0547 R2 = 0.4296
0 1 2 3 4 5
0 5 10 15 20 25
Pill size_Ave E x p e rt G ra d e
Expert VS Inst_STD
y = -0.2442x + 4.4172 R2 = 0.4752 0 1 2 3 4 5
0 2 4 6 8 10 12
Pill STD E x p e rt G ra d e
Expert VS Inst_Area % y = -2145.4x + 3.2091
R2 = 0.3263
0 1 2 3 4 5
0.00E+00 2.00E-04 4.00E-04 6.00E-04 8.00E-04 1.00E-03
Area percentage E x p e rt G ra d e
Expert VS Inst_Density
y = -7E+07x + 3.0732 R2 = 0.2288
0 1 2 3 4 5
0.00E+005.00E-09 1.00E-081.50E-08 2.00E-082.50E-08 3.00E-08
Density E x p e rt G ra d e
R=0.71 CV=6.2
R=0.69 CV=26.0
R=0.57 CV=1.5×10⁶
R=0.48 CV=8.9×10¹⁰
R=0.56 CV=8.4