UNIVERSITI TEKNIKAL MALAYSIA MELAKA
APPLICATION OF THE MICROFIBER SENSOR FOR
MONITORING CONCENTRATION OF ACETONE
This report submitted in accordance with requirement of the Universiti Teknikal Malaysia Melaka (UTeM) for the Bachelor Degree of Electronic Engineering
Technology (Telecommunications) (Hons.)
by
MUHAMMAD ZAWANI AFFENDI BIN SUHAIMI B0710210283
890922-10-5405
UNIVERSITI TEKNIKAL MALAYSIA MELAKA
BORANG PENGESAHAN STATUS LAPORAN PROJEK SARJANA MUDA
TAJUK: Application of the Microfiber Sensor for Monitoring Concentration of Acetone
SESI PENGAJIAN: 2015/16 Semester 1
Saya MUHAMMAD ZAWANI AFFENDI BIN SUHAIMI
mengaku membenarkan Laporan PSM ini disimpan di Perpustakaan Universiti Teknikal Malaysia Melaka (UTeM) dengan syarat-syarat kegunaan seperti berikut:
1. Laporan PSM adalah hak milik Universiti Teknikal Malaysia Melaka dan penulis. 2. Perpustakaan Universiti Teknikal Malaysia Melaka dibenarkan membuat salinan
untuk tujuan pengajian sahaja dengan izin penulis.
3. Perpustakaan dibenarkan membuat salinan laporan PSM ini sebagai bahan pertukaran antara institusi pengajian tinggi.
4. **Sila tandakan ( )
SULIT
TERHAD
TIDAK TERHAD
(Mengandungi maklumat yang berdarjah keselamatan atau kepentingan Malaysia sebagaimana yang termaktub dalam AKTA RAHSIA RASMI 1972)
(Mengandungi maklumat TERHAD yang telah ditentukan oleh organisasi/badan di mana penyelidikan dijalankan)
__________________________
Alamat Tetap:
NO. 18 Jalan 9 Fasa 2,
Taman Changgang Jaya,
42700 Banting, Selangor
Tarikh: ________________________
Disahkan oleh:
____________________________
Cop Rasmi:
Tarikh: _______________________
iv
DECLARATION
I hereby, declared this report entitled “Application of the Microfiber Sensor for Monitoring Concentration of Acetone” is the results of my own research except as
cited in references.
Signature :………
Name : ………
v
APPROVAL
This report is submitted to the Faculty of Engineering Technology of UTeM as a partial fulfillment of the requirements for the degree of Bachelor of Electronic Engineering Technology (Telecommunications) (Hons.). The member of the supervisory is as follow:
vi
ABSTRACT
vii
ABSTRAK
viii
DEDICATIONS
This humble effort especially to my beloved parents, Maimunah binti Mohsin and Suhaimi bin Abd Razak,
siblings, Maizatul, Ashrafy and Nadia,
ix
ACKNOWLEDGMENTS
In the name of Allah S.W.T, the Most Gracious, who has given me the strength and ability to complete this thesis. Praise to Him to who seek help and guidance and under His benevolence we exist and without His help, this project could not have been accomplished.
I would like to take this opportunity to express my gratitude to my beloved supervisor whom in the period of doing my research, always gives me the guidance, Mr. Md Ashadi bin Md Johari. All the information and knowledge that they gave were priceless and have contributed to the completion of this project. Although there are were so many weaknesses in myself, they never gives up to help me in proceeding this project.
My special gratitude also dedicated to my classmates, friends, academic staffs, technical staffs, and every person who participated in helping me during the process of completing this project. The guidance and support they gave to help me to overcome the obstacle encountered during completing this project.
x
TABLE OF CONTENTS
DECLARATION ... iv
APPROVAL ... v
ABSTRACT ... vi
ABSTRAK ... vii
DEDICATIONS ... viii
ACKNOWLEDGMENTS ... ix
TABLE OF CONTENTS ... x
LIST OF FIGURES ... xiii
LIST OF TABLE ... xv
LIST OF SYMBOLS AND ABBREVIATIONS ... xvi
CHAPTER 1 ... 1
1.0 Introduction ... 1
1.1 Background ... 4
1.2 Problem Statement ... 4
1.3 Objectives ... 5
1.4 Scope of Study ... 6
1.5 Limitation ... 6
CHAPTER 2 ... 7
2.0 Introduction ... 7
xi
100 T/bit Fiber Transmission (Hecht, 2011) ... 7
2.1.2 Fiber Optic Splicing (Solomon, 2012) ... 10
2.2 Fiber Optic Sensor (F.O.S) ... 14
2.2.1 Fiber Optic Sensor for Temperature Measurement (Ohodnicki, 2013) ... 14
2.2.2 Fiber Optic Sensor for Glucose (Li, 2015)... 15
2.3 Optical Microfiber ... 16
2.3.1 Optical Microfibers and Nanofibers (Wu, 2013) ... 16
2.4 Acetone Concentration ... 22
2.4.1 Toward portable breath acetone analysis for diabetes detection (Righettoni, 2011) ... 22
CHAPTER 3 ... 29
3.0 Introduction ... 29
3.1 Project Overview ... 29
3.1.1 Title Finding ... 30
3.1.2 Literature Survey / Review ... 31
3.1.3 Deciding Raw Material ... 31
3.1.4 Develop Sensor ... 31
3.1.5 Testing the Sensor ... 32
3.1.6 Analyse Sensor ... 32
3.1.7 Writing Formal Report ... 32
3.2 Experiment Process ... 32
3.2.1 Tapering Process ... 33
xii
3.2.3 Fusion Splicing Method ... 38
3.2.4 Experiment Procedure ... 42
3.3 Project Flowchart ... 44
CHAPTER 4 ... 45
4.0 Introduction ... 45
4.1 Process ... 45
4.1.1 Equipment ... 46
4.1.2 Acetone with Different Concentrations ... 47
4.1.3 Tapering Machine ... 48
4.2 Experiment Results ... 50
4.2.1 Output Reading from Optical Spectrum Analyzer ... 50
4.2.2 Conversion of Power Loss dB to Voltage Gain, Av ... 51
4.2.3 Plotted Graph ... 51
4.2.4 Sensitivity & Linearity of Optical Microfiber Sensor on Graph... 56
4.2.5 Conclusions from Analysis ... 56
CHAPTER 5 ... 57
5.0 Introduction ... 57
5.1 Summary of Research ... 57
5.2 Achievement of Research Objectives ... 58
5.3 Significance of Research ... 58
5.4 Suggestion for Future Work ... 59
APPENDIX A ... 60
xiii
LIST OF FIGURES
Figure 2.1: A seven-core optical fiber (Courtesy of NIICT) ... 9
Figure 2.2: Combination of two pair fiber optic cable to be spliced ... 10
Figure 2.3: Process of Fiber Optic Splicing ... 13
Figure 2.4: Fiber Optic Sensor with Plasmonic Film ... 14
Figure 2.5: Waveguiding properties and potentials of optical MNFs ... 18
Figure 2.6: Schematic diagram of flame-heated taper drawing. ... 20
Figure 2.7: (a) Sensor fabrication schematic and (b) Sensor characterization setup 23 Figure 2.8: XRD pattern (2θ = 20◦–40◦) of 10 mol% Si-doped WO3 nanoparticle ... Error! Bookmark not defined. Figure 2.9: Sensor resistance change of 10 mol% in a Si-doped WO3 nanoparticles ... 28
Figure 2.10: Acetone MS signal intensity and temperature. ... 28
Figure 2.11: Sensor response to different acetone concentrations. ... 28
Figure 3.1 : Steps of Project Methodology ... 29
Figure 3.2: Simple tapering of the optical fiber basic diagram ... 33
Figure 3.3: Diagram of tapered fiber optic using flame brushing technique set-up .. 34
Figure 3.4: Fiber optic during flame brushing technique process ... 35
Figure 3.5: A mistakes during splicing process ... 36
Figure 3.6: Fusion Splicer ... 37
Figure 3.7: Fiber optic stripper and stripping method ... 38
Figure 3.8: The process of cleaning using Alcohol (in a bottle) ... 39
Figure 3.9: Fiber optic cleaver ... 40
Figure 3.10: Fusion Splicer Machine are Being Used ... 41
Figure 3.11: Optical Microfiber Sensor is being tested with Acetone Concentration ... 42
Figure 3.12: Project Methodology Summarization ... 44
Figure 4.1: Experiment diagram of microfiber sensor design ... 46
Figure 4.2: Portable ASE and OSA used in this experiment ... 46
xiv
Figure 4.4: Tapering machine ... 48
Figure 4.5: Graph of Output Av versus Acetone Concentration ... 52
Figure 4.6: Power Loss of Slope for ASE wavelength 850nm ... 53
Figure 4.7: Power Loss of a Slope for ASE wavelength 1310nm ... 54
xv
LIST OF TABLE
Table 4.1: Diameter and Length of Optical Microfiber before and After Tapering.. 48
Table 4.2: OSA reading in dB of power losses with different concentration of Acetone with using of various ASE wavelength ... 50
Table 4.3: Reading after a conversion of Power Loss unit from dB to Av ... 51
xvi
LIST OF SYMBOLS AND ABBREVIATIONS
ASE = Amplified Spontaneous Emission
OSA = Optical Spectrum Analyzer
LED = Light Emitting Diode
EMI = Electromagnetic Interference
RFI = Radio Frequency Interference
OMF = Optical Microfiber
SMF = Single Mode Fiber
UV = Ultra Violet
PPM = Part Per Million
POF = Plastic Optical Fiber
µ = Micro
mV = Milli Volts
λ = Lambda
T/bit - Terabit
dB = Decibel
1
CHAPTER 1
INTRODUCTION
1.0 Introduction
This is the first chapter of this research which is responsible to give a general explanation regarding the purpose of this research. In this chapter, it will give an overview about the title of this research, history of the research had done before, the problem statements, the objective of this study and the scopes of study for this research. The overview will only be general information and the details for this research are discussed in other chapter. According to (K.S Thyagarajan., 2007), a flexible and transparent fiber which made of from high quality extruded glass or plastic that operates at higher bandwidth (data rate) than any form of communication as well as permits transmission over longer distances is called fiber optic. Fiber optic technology plays an important role in modern electronic telecommunication system. Besides that, the principle of fiber optic is also applied and used in diverse modern bio-medical electronic fields.
2
Fiber optic sensors are also immune to electromagnetic interference, and do not conduct electricity so they can be used in places where there is high voltage electricity or flammable material such as jet fuel. Fiber optic sensors can be designed to withstand high temperatures as well. Optical fibers can be used as sensors to measure strain, temperature, pressure and other quantities by modifying a fiber so that the quantity to be measured modulates the intensity, phase, polarization, wavelength or transit time of light in the fiber. Sensors that vary the intensity of light are the simplest, since only a simple source and detector are required. A particularly useful feature of intrinsic fiber optic sensors is that they can, if required, provide distributed sensing over very large distances. Fiber optic sensing systems are presently used in harsh industrial environments for the measurement of pressure, temperature, differential pressure, strain, position, vibration, and acceleration. The major technical advantages of fiber optic transducers include small size, inherent safety, immunity to EMI, and continuous use at temperatures up to 1000°F. (Needham, 2010)
In the past 50 years, fiber-optical sensing has been one of the most successful and powerful applications of both fiber optics and sensing technology. Recently, along with the rapid progress in micro/nanotechnology and increasing demands on optical sensors with higher performances and versatilities, spatial miniaturization has been one of the current trends of fiber-optic sensors. It is obvious that, reducing the size of a sensing structure is usually an essential step to bestow the sensor with faster response, higher sensitivity, low power consumption and better spatial resolution, and an optical microfiber is one of the best candidates for this purpose.
3
platform for optical sensing with special advantages including faster response, higher sensitivity, low power consumption.
Acetone (systematically named propan-2-one) is the organic compound with the formula (CH3)2CO. It is a colorless, volatile, flammable liquid, and is the
simplest ketone. Acetone is miscible with water and serves as an important solvent in its own right, typically for cleaning purposes in the laboratory. About 6.7 million tonnes were produced worldwide in 2010, mainly for use as a solvent and production of methyl methacrylate and bisphenol A. It is a common building block in organic chemistry. Familiar household uses of acetone are as the active ingredient in nail polish remover and as paint thinner.
Acetone is produced and disposed of in the human body through normal metabolic processes. It is normally present in blood and urine. People with diabetes produce it in larger amounts. Diabetes is a complex group of diseases with a variety of causes. People with diabetes have high blood glucose, also called high blood sugar or hyperglycemia.
If the diabetes isn’t being managed effectively, there isn’t enough functioning insulin to help deliver glucose to your body’s cells that need it. Deprived of glucose its main fuel source in human body will launch into a backup plan: burning fat for energy. The breakdown products of the process, called ketones, can accumulate in your blood and eventually in your urine. One type of ketone, called acetone, has a telltale “fruity” smell; if you’re making ketones, you’ll likely have fruity-smelling breath. (Since acetone is a key ingredient in nail polish remover, it might more accurately be called “nail polish remover breath.”)
4
of acetone production and elimination in breath and urine were determined and the rates of vivo metabolism were calculated.
1.1 Background
This research entitiled as Application of the Microfiber Sensor for Monitoring Concentration of Acetone. The reason why the detection of acetone viscosity system using fiber optic sensor needs to be develop because to determine the concentrated acetone in human body to examine the diabetic. The correlation of diabetes and acetone are is it can detect a somehow person afflicted with diabetes through high level acetone level from respiration of human being and excretion in form of urine which is can determined sugar viscosity in blood.
1.2 Problem Statement
5
hydroxybutyrate concentration of venous blood in fasting obese patients. Overnight fasting levels of both breath acetone and blood-sugar were measured in 251 diabetics, after which the patients were grouped for analysis by the type of diabetic management and the fasting blood-sugar found (Dept. of Medicine, n.d.)
Main problem is to analyze the diabetes which used to detect level of glucose in blood is not stable. There is need the device to detect the diabetes with a continuous stability and precise testing result. Optical microfiber as sensor helps medics to detect diabetes in patient’s bodies as a faster transmission and high sensitivity by microfiber sensor to detect the concentration of acetone.
1.3 Objectives
The objectives of this project are to:
i. To understand the concept of fiber optic sensor and microfiber sensor. ii. To study acetone effect in diabetes detection.
iii. To develop fiber optic acetone sensor.
6
1.4 Scope of Study
Before a new technology or technique is applied, the system must be tested so that the performance of the design and analysis can be known. However, for any project to be done, the limitation of the scope of work must be very realistic and applicable. In order to achieve the objective of study, the following were outline as follows :
i. Study on the correlation of type of diabetes and acetone in human breath, in urine and in blood testing.
ii. Analyze on microfiber sensor capability.
iii. Design and develop the microfiber sensor to detect the concentration of acetone.
iv. Applying the various acetone concentration and obtain the result required which are closed to the theoretical results.
v. Analyze the data obtained and select the data that have optimum results. vi. Report writing.
1.5 Limitation
The limitations of the study are those characteristics of design or methodology that impacted or influenced the interpretation of the findings from a research. They are the constraints on generalizability, applications to practice, and/or utility of findings that are the result of the ways in which there initially chose to design the study and/or the method used to establish internal and external validity. Some of limitation are:
7
CHAPTER 2
THEORETICAL BACKGROUND
2.0 Introduction
In this chapter, the research has been done by other persons which are related with this research were discussed. The facts from their research were used to guide this research in correct way. The source came from the journals and articles wrote by the previous researchers which related to this project. Their theory and results help this research as they can be a comparison between this research and theirs.
2.1 Fiber Optic
2.1.1 Fiber-Optic Communications: OFC Postdeadline Highlights Include 100 T/bit Fiber Transmission (Hecht, 2011)
Demonstrations of high-speed fiber-optic transmission reached a major milestone at the March 10 post deadline session of this year’s Optical Fiber Communications Conference (OFC; Mar. 6–10, 2011, Los Angeles, CA). Two groups reported sending more than 100 Tbit/s through single optical fibers using different techniques. That caps three years of rapid increases in fiber-optic speed records following a hiatus in hero experiments during the post-telecom-bubble years.
8
channel between Paris and Frankfurt. At the end of March, Verizon announced it would install the first three 100 Gbit optical channels in US long-haul systems.
i. Superchannels
How to further upgrade that capacity has been an issue. At the OFC postdeadline sessions, a team from Verizon (Richardson, TX) and NEC Labs (Princeton, NJ) described mixing 100 Gbit/s optical channels with “superchannels” transmitting 450 Gbit/s and 1.15 Tbit/s across wider spectral regions through 3560 km of fiber in the Verizon network. The superchannels combined orthogonal frequency-division multiplexing (OFDM) with dual-polarization quadrature phase-shift key (DP-QPSK) modulation of multiple subcarriers within the transmission band. Tiejun Xia of Verizon and colleagues reported that the superchannels “provide higher channel capacity and higher spectral efficiency than the existing 100 Gbit/s system” in installed fiber. That shows the feasibility of upgrading existing networks to terabit transmission, says Ting Wang, manager of NEC Labs’ optical networking department.
NEC Labs stretched the superchannel approach to demonstrate 101.7 Tbit/s transmission over three 55 km lengths of standard single-mode fiber. They started with 370 laser transmitters spaced at 25 GHz intervals in the C-band at 1527.4 to 1565.7 nm and the L-band at 1570 to 1607 nm. They modulated odd and even channels independently, and partitioned each 25 GHz band into four subbands, each carrying a 6-GHz-wide OFDM signal, with 1 GHz left as a guard band. They modulated and combined those signals, with polarization-division-multiplexed 128QAM applied to each subcarrier. This built up a 294 Gbit/s signal for each of the 370 transmitting lasers, a raw data rate of 108.8 Tbit/s, which corresponds to 101.7 Tbit/s after error correction is done. Dispersion was compensated electronically.
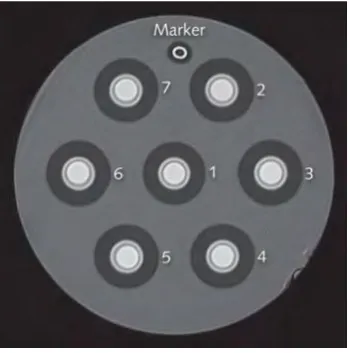
ii. Seven-core fiber
9
[image:24.595.250.425.167.344.2]look for new ways to increase fiber capacity. Sakaguchi and colleagues from Sumitomo Electric’s R&D Lab (Yokohama, Japan) and Optoquest (Saitama, Japan) described WDM of 10 Gbit/s signals in seven-core fibers during the regular sessions.
Figure 2.1: A seven-core optical fiber (Courtesy of NIICT)
In the postdeadline sessions, Sakaguchi reported a big step forward: transmitting 97 WDM channels on a 100 GHz grid, each carrying DP-QPSK signals at 172 Gbit/s, through all seven cores. The raw data rate adds up to 15.6 Tbit per core or 109 Tbit/s through the entire fiber, excluding the overhead for forward-error correction. The experiments divided output from a single WDM transmitter among all seven cores, with different time delays added between the transmitter and the optics that focused the light into each of the singlemode cores, which were spaced on 45 µm centers in a 150 µm cladding. The signals then went through 16.8 km of the multicore fiber without amplification before being demultiplexed.