This paper is available online free of all access charges (see http://jxb.oxfordjournals.org/open_access.html for further details)
© The Author [2013]. Published by Oxford University Press on behalf of the Society for Experimental Biology.
This is an Open Access article distributed under the terms of the Creative Commons Attribution Non-Commercial License (http://creativecommons.org/licenses/ by-nc/3.0/), which permits non-commercial re-use, distribution, and reproduction in any medium, provided the original work is properly cited. For commercial re-use, please contact journals.permissions@oup.com
ReseaRch papeR
Genome-wide transcriptomic analysis of the sporophyte of
the moss
Physcomitrella patens
Martin-Timothy O’Donoghue1,*, Caspar Chater2,*, Simon Wallace1, Julie E. Gray2, David J. Beerling1 and Andrew J. Fleming1,†
1 Department of Animal and Plant Sciences, University of Sheffield, Sheffield S10 2TN, UK
2 Department of Molecular Biology and Biotechnology, University of Sheffield, Sheffield S10 2TN, UK
*These authors contributed equally to this manuscript.
† To whom correspondence should be addressed. E-mail: a.fleming@sheffield.ac.uk
Received 22 February 2013; Revised 26 April 2013; Accepted 28 May 2013
Abstract
Bryophytes, the most basal of the extant land plants, diverged at least 450 million years ago. A major feature of these plants is the biphasic alternation of generations between a dominant haploid gametophyte and a minor diploid sporophyte phase. These dramatic differences in form and function occur in a constant genetic background, rais-ing the question of whether the switch from gametophyte-to-sporophyte development reflects major changes in the spectrum of genes being expressed or alternatively whether only limited changes in gene expression occur and the differences in plant form are due to differences in how the gene products are put together. This study performed replicated microarray analyses of RNA from several thousand dissected and developmentally staged sporophytes of the moss Physcomitrella patens, allowing analysis of the transcriptomes of the sporophyte and early gametophyte, as well as the early stages of moss sporophyte development. The data indicate that more significant changes in tran-script profile occur during the switch from gametophyte to sporophyte than recently reported, with over 12% of the entire transcriptome of P. patens being altered during this major developmental transition. Analysis of the types of genes contributing to these differences supports the view of the early sporophyte being energetically and nutritionally dependent on the gametophyte, provides a profile of homologues to genes involved in angiosperm stomatal develop-ment and physiology which suggests a deeply conserved mechanism of stomatal control, and identifies a novel series of transcription factors associated with moss sporophyte development.
Key words: Alternation of generations, gametophyte, microarray, moss, Physcomitrella, sporophyte, stomata.
Introduction
Alternation of generations is a fundamental concept in plant biology. Each plant species undergoes two distinct stages in its life cycle: a haploid stage (gametophyte) capable of gen-erating gametes via mitosis and a diploid stage (sporophyte) distinguished by the ability of the plant to generate spores via meiosis. Plant evolution has been characterized by the increasing dominance of the sporophyte stage at the expense of a free-living gametophyte. This has led to the point where, in present-day angiosperms, the sporophytic form dominates and the gametophyte is reduced to a non-free-living stage
enclosed within the pollen or embryo sac (Haig and Wilczek, 2006). The drivers for this evolutionary progression have been proposed to be the environmental stresses associated with the colonization of a terrestrial environment compared with an aquatic one. The acquisition of a few key traits has been proposed to underpin the success of land plants, with subsequent consequences for the evolution of life and cli-mate on the planet (Kenrick and Peter, 1997; Kenrick et al., 1997; Hughes and Otto, 1999; Graham and Wilcox, 2000;
Renzaglia et al., 2000; Bennici, 2008; Langdale, 2008; Niklas
at Royal Hallamshire Hospital on September 29, 2015
http://jxb.oxfordjournals.org/
and Kutschera, 2009). Despite a plethora of descriptive stud-ies on traits proposed to be required for the adaptation of the sporophyte generation for survival on land, the molecular evolution underpinning these traits has only recently begun to be unravelled. A focus of these studies has been on the comparison of two model plant systems with fully sequenced genomes: Arabidopsis thaliana, a representative angiosperm,
and Physcomitrella patens, a representative bryophyte.
Moreover, various genomic tools have been developed for these plants which facilitate gene swap and mutation experi-ments, allowing the rigorous testing of gene function in an evolutionary context.
The Physcomitrella gametophyte consists of protonemal filaments which give rise to gametophores upon which the gametes are generated (Fig. 1). Following gamete fusion, the sporophyte develops as a proto-shoot structure which remains relatively small and attached to the gametophyte (Glime, 2007a). The main bulk of the sporophyte is devoted to the formation of spores which are eventually released for dispersal. Thus, the two forms of the plant (gametophyte and sporophyte) are distinguished not only by their nuclear chro-mosome content and ontogeny, but also by form and func-tion. These two distinct plant forms are encoded by the same genome (Szovenyi et al., 2011). This raises fundamental ques-tions relating to the biology of the alternation of generaques-tions. For example, is there a distinct difference in the spectrum of gene products utilized by the gametophyte and sporophyte plant forms, or are essentially the same gene products used in both but in a different constellation? The advent of genomic sequencing, along with tools for the genome-wide analysis of gene expression data, has opened the door to the analysis of these types of questions. A recent study of Funaria hygromet-rica (a close relative of Physcomitrella) exploited advances in high throughput sequencing to compare RNA extracted from the gametophore and sporophyte tissue (Szovenyi et al. 2011). The similarity of the Funaria sequences to the fully sequenced genome of Physcomitrella allowed the identification of 13 000 gene models whose expression could be compared between the two life history stages. These data indicated that the tran-sition from gametophyte-to-sporophyte was marked by a change in transcription profile; however, the number of genes showing differential expression was moderate, represent-ing only about 4% of the genes that could be unequivocally identified. In addition, the gametophyte-stage tissue used was gametophore-enriched but did not include the earlier pro-tonemal stage of gametophyte development.
One of the reasons for focusing on Funaria was that the spo-rophyte of this moss is relatively large, certainly in comparison to Physcomitrella. However, the high-throughput sequencing approach relies on the ability to unequivocally relate novel sequences to an anchor genome, and this leads to a limita-tion in the approach because of the lack of a Funaria genome sequence. An alternative strategy (reported here) is to adopt a more direct approach to comparing transcription profiles of the moss gametophyte and sporophyte by dissecting the minute Physcomitrella sporophytes and using the available genomic tools for this plant. This work reports on the analysis of RNA extracted from several thousand Physcomitrella sporophytes
[image:2.612.316.546.230.570.2]dissected at two different stages, thus providing an insight into the transcriptome during early sporophyte development. For comparison, gametophyte tissue at the protonemal stage was used. This is relatively homogeneous tissue compared with the gametophore and is unequivocally free of any potentially contaminating sporophyte tissue. It also has a distinct tissue organization (filamentous cells) so that transcriptome analysis provides an insight into this particular morphology. The RNA analysis was performed using a custom-built microarray based on the sequenced genome of Physcomitrella which allowed the expression analysis of over 30 000 genes and was validated by reverse-transcription PCR (RT-PCR) of selected lead genes. The data indicate a much larger difference in transcript profile than previously reported for the gametophore to sporophyte
Fig. 1. The lifecycle of moss alternates between the haploid gametophyte stage and the diploid sporophyte stage. A single haploid Physcomitrella patens spore gives rise a gametophore (central image). Fertilization of gametes on the gametophore apex produces a structure called a sporophyte (capsule on top of gametophore in central image). This sporophyte is the diploid phase in the lifecycle of the moss. As the sporophyte matures, haploid spores form within the capsule. Eventually the sporophyte bursts, releasing spores to repeat the lifecycle. Early sporophytes (bottom left) and mid-sporophytes (bottom right) were harvested for RNA extraction and microarray analysis. Bars, 100 μm (early sporophyte), 200 μm (mid-sporophyte) (this figure is available in colour at JXB online).
at Royal Hallamshire Hospital on September 29, 2015
http://jxb.oxfordjournals.org/
comparison in Funaria (Szovenyi et al., 2011). In addition, this analysis of the transcriptome during early sporophyte devel-opment provides a first insight into the genes that putatively control moss stomatal development and function, as well as gene expression changes that occur as the capsule proceeds towards meiosis and spore generation.
Materials and methods
Plant materialP. patens subspecies patens (Hedwig) wildtype ecotype ‘Villersexel’. ‘Villesexel’ was found to produce sufficient sporophytes for analy-sis, unlike the ‘Gransden’ ecotype (the strain from which microarray probes were constructed). However, there is little polymorphic dif-ference between the two strains with 829bp/SNP and therefore little effect on hybridization to the microarray (Kasahara, 2011). Plants were grown in Sanyo MLR incubators with a 16/8 light/dark cycle, 140 μmol m–2, and 22/16 °C. Protonema and gametophores were grown on organic-nitrogen-supplemented BCD medium in sterile Petri dishes overlaid with sterile cellophane discs (AA Packaging, UK) and sealed with micropore tape, as described (Knight et al, 2002). Protonemal cultures were maintained by subculturing weekly in a sterile laminar flow hood. Mechanical disruption of protone-mata was performed using a Polytron homogenizer (Kinematica, Switzerland). Gametophore production was initiated by subcultur-ing protonemal fragments onto agar lacksubcultur-ing cellophane discs and culturing these for longer than 14 days. Gametogenesis was initiated by transferring cultures to 15 °C growth cabinet for 3 weeks with a 16/8 light/dark cycle, (140 μmol m–2), after which they were flooded with sterile deionized water to promote fertilization of archegonia for about 2 hours. Subsequently, the cultures were returned to gameto-phyte growth conditions for further development of the sporogameto-phytes.
RNA extraction
RNA was extracted from all plant tissues using the Spectrum Total Plant RNA extraction kit (Sigma, STRN250) following manu-facturer’s recommendations. Approximately 100 mg of tissue was harvested directly into liquid nitrogen in microcentrifuge tubes and ground to a powder. RNA integrity and concentration were ana-lysed by agarose gel electrophoresis and an Agilent Bioanalyzer. Gametophyte RNA (G) was extracted from 7-day-old protone-mal tissue. RNA was extracted from early stage sporophytes (ES, defined as pre-expanded columnar capsules with the foot, calyptras, and calyptral remnants removed) and mid-stage sporophytes (MS, defined as ovoid to near-spherical translucent green capsules with the foot, calyptras, and calyptral remnants removed). The ES stage is prior to meiosis and spore formation. The MS stage contains tissue in which the initial stages of meiosis and spore formation are occurring. To meet the quality requirements for the microarray experiment, at least 400 sporophytes were used per extraction. Three or four RNA extracts were then pooled for further precipitation to maximize purity and concentration. Up to 1600 sporophytes were harvested to prepare sufficient RNA for each microarray replicate.
Microarray hybridization
A triplicated transcriptomic microarray experiment was designed to compare gametophyte gene expression against the gene expression of both early and mid stage sporophytes. One of three independent replicate RNA samples of each sporophyte stage was co-hybridized with one of six independent replicate gametophyte samples. Samples were co-hybridized as total RNA with cyanine (Cy-3/Cy-5) fluores-cent ULS labels onto an Agilent custom array with anti-sense probes (synthesized as 60-mer length oligonucleotide probes on glass slides using Agilent Technologies’ ‘SurePrint’ inkjet technology (Reski
and Frank, 2005) in collaboration with MOgene LC, an Agilent-certified facility based in St Louis, MO, USA (www.mogene.com, MOGene LC, St Louis, consulted October 2004). Microarrays were performed essentially as described in the manufacturer’s instruc-tions with hybridization overnight at 65 °C followed by washing to a stringency of 0.2 × SSC followed by brief drying by centrifugation. The microarray dataset has been deposited on GEO online database (GSE32928; www.ncbi.nlm.gov/geo).
Microarray analysis
Microarrays were analysed using the limma bioconductor package in the R environment (Smyth, 2005). The probes were background corrected using normexp with an offset of 50 (Ritchie et al., 2007). They were then normalized within arrays using loess and normal-ized between arrays using Aquantile (Smyth and Speed, 2003). The arrays were split into individual channels. This allowed the comparison of gametophyte vs. early sporophyte, gametophyte vs. mid-sporophyte, and early sporophyte vs. mid-sporophyte. Analysis showed that the three technical and three biological replicates used for each sample comparison were robust (Supplementary Figs. S1 and S2, available at JXB online). The limma empirical Bayes method was used to identify differentially expressed genes (Smyth, 2004). A P-value of 0.01 and a fold change of 1.5 (0.585 on a log2 scale) were used as a cut-off for the comparisons described below. This fold cut-off was chosen in order to include genes with a low change in expression and, consequently, a low p-value was used in order to reduce the likelihood of false positives.
Gene annotation and ontology analysis
Gene sequences associated with each identifier were downloaded (transcripts.Phypa1_1.FilteredModels3.fasta.gz, available at http://genome.jgi-psf.org/Phypa1_1/Phypa1_1.download.ftp.html) (Rensing et al., 2008). These sequences were annotated from the NCBI nr database using blast2go (Conesa et al., 2005; Conesa
and Gotz, 2008). Gene ontology terms associated with each gene ID were downloaded (Phypa1_1_goinfo_FilteredModels3.tab.gz) (Rensing et al., 2008). These GO annotations were uploaded to the program blast2go in order to visualize the relative distribution of
the GO terms in each category (Conesa et al., 2005; Conesa and Gotz, 2008; Gotz et al., 2008). GO enrichment analysis of func-tionally significant terms in the GO database using blast2go was
applied (Fisher’s test, P < 0.01).
RT-PCR
RT-PCR for microarray analysis verification was set up as previously described (Malinowski et al., 2011). Reactions paused at defined inter-vals during the program at the lowest temperature (60 °C) of cycles 20, 24, 28, and 32. At these times, individual aliquots of 8 μl were removed from the tubes and placed on ice to stop the reaction. At the end of the program, aliquots were loaded into wells for agarose gel (1%, w/v) electrophoresis in time order and visualized by UVtech Digital Camera. Primers were selected using Primer3 (http://frodo.wi.mit.edu/ primer3/). Primer sequences are given in Supplementary Table S1.
Results and discussion
Early sporophyte development involves altered expression of a large fraction of the moss
transcriptome relative to the protonemal-gametophyte Comparison of gametophyte (G) and early sporophyte (ES) data indicate that a substantial number of genes are either upregulated (2042) or downregulated (1919) (Fig. 2 and Supplementary Tables S12 and S15). Since the
at Royal Hallamshire Hospital on September 29, 2015
http://jxb.oxfordjournals.org/
microarray represents 31 000 independent transcripts within the Physcomitrella genome, the combined number of up- and downregulated genes (3961) equates to 12.8% of the entire transcriptome on the array. When mid-sporophyte (MS) and G data are compared a similar picture emerges. As shown in
Fig. 2, transcript levels for 1816 genes are upregulated in the MS sample relative to the G sample, with 2014 genes show-ing a significantly decreased transcript level (Supplementary Tables S13 and S16). This represents a 12.4% shift in tran-scriptome expression between the G and MS phase, compara-ble to the value (12.8%) calculated for the G to ES transition.
In contrast, comparison of the early and mid-stage sporo-phyte transcriptomes reveals a much smaller shift in gene expression. Thus, as shown in Fig. 2, transcript levels for 708 genes are upregulated and 540 genes downregulated during the ES to MS transition. The total number of genes showing a significant change in level during the ES to MS transition (1248) represents only 4% of the transcriptome represented on the microarray (Supplementary Tables S14 and S17). Moreover, only a few (8.5%) of the genes identified as chang-ing transcript level in the comparison of early and mid-stage sporophyte development were detected in the comparison of Fig. 2. Global analysis of differences in transcripts between the gametophyte and sporophyte of Physcomitrella. Pairwise microarray comparison of RNA extracted from gametophyte, early sporophyte, and mid-sporophyte samples were performed. The overlap between the genes identified as significantly upregulated (A) or downregulated (B) when gene expression in gametophyte tissue was compared either to early sporophyte tissue or mid-sporophyte tissue, or when early sporophyte tissue was compared with mid-sporophyte tissue is shown. The total number of genes identified as being differentially expressed in each comparison is indicated. Significance was set at
P < 0.01, with a fold-change of 1.5 (log2 scale).
at Royal Hallamshire Hospital on September 29, 2015
http://jxb.oxfordjournals.org/
gametophyte and sporophyte tissue, whereas a large percent-age (>70%) of the genes detected as changing transcript level at the gametophyte to early sporophyte transition were also identified as showing a significant difference in transcript level when gametophyte and mid-stage sporophyte tissue were compared. The genes identified as upregulated or down-regulated in the comparisons of the G, ES, and MS tissues and their gene ontology (as defined by molecular function, biological process, and cell component) are summarized in
Supplementary Table S2 and shown in Supplementary Tables S3–S8.
To validate the microarray data a number of analyses were performed. Firstly, RT-PCR experiments were performed on lead genes resulting from the analysis shown in Fig. 2. These genes were chosen because they showed either high predicted levels of differential gene expression or were expected to be expressed similarly in both tissues. RNA was extracted from either protonemal gametophyte or dissected sporophyte tis-sue, cDNA synthesized, and then PCR performed using primers for genes shown in Supplementary Table 1. As shown in Fig. 3, the majority of genes tested showed an expression pattern consistent with that predicted by the microarray anal-ysis, including both sporophyte- and gametophyte-specific expression. As a second validation step for the microarray data, previous analyses of Physcomitrella gene expression were compared with this microarray-based analysis of game-tophyte and sporophyte tissue. For example, the microarray data showed that both PpLFY1 and PpLFY2 are expressed in gametophyte and sporophyte tissue and did not reveal any significant difference in transcript levels between the two tis-sue types, which is consistent with published data (Tanahashi
et al., 2005). It should be noted that although PpLFY1 and
PpLFY2 show no difference in transcript levels between
gametophyte and sporophyte tissue, altered expression of these genes leads to a clear phenotype specifically in the sporophyte, highlighting the potential limitation of analyses restricted to transcriptomic data. Previous analysis has identi-fied three KNOX-related genes (MKN2, MKN4, and MKN5) as being specifically sporophyte expressed (Sakakibara et al., 2008). These genes were not identified in the microarray anal-ysis as being differentially expressed. However, it should be noted that the RT-PCR analysis used in the previously pub-lished work required 40 amplification cycles to detect these transcripts and it is highly possible that such relatively low transcript levels are below the sensitivity of the microarrays used. Again, although microarray approaches are useful in providing global views on transcript expression pattern, care must be taken in their interpretation since it is highly unlikely that all transcripts will be detected. The definition of differen-tial expression is to a large extent determined by the statistical analysis performed and this study took a rather conservative approach in the analysis to minimize the identification of potential false positives.
[image:5.612.336.536.47.622.2]Overall, the RT-PCR results indicate that the microarray data can be used with confidence to indicate gene expression levels in the relevant tissue samples but that, as with all such data, some caution needs to be used in their functional inter-pretation. It should also be noted that the dissection approach
Fig. 3. RT-PCR validation of microarray data. RNA was extracted from gametophyte or sporophyte tissue and reverse transcribed, and then PCR was performed using primers designed to amplify a spectrum of lead genes identified as being differentially expressed in the microarray comparison of gametophyte and sporophyte tissue (Fig. 2). Amplified DNA was removed at different cycle numbers (24, 28, 32) and run on 1% (w/v) agarose gel before visualization. The Physcomitrella
gene id/names are indicated on the left.
at Royal Hallamshire Hospital on September 29, 2015
http://jxb.oxfordjournals.org/
prevented analysis of the very earliest stages of sporophyte formation (i.e. clearly there are stages prior to the defined ES stage). An analysis of such tissue would require a laser micro-dissection approach coupled with RNA amplification, which was beyond the present investigation.
Taken together, these data suggest that the transition from gametophyte to sporophyte in mosses is accompanied by a relatively large shift in the transcriptome (>12% as repre-sented on the microarray), whereas early to mid-sporophyte development involves much fewer changes in transcript level. It is striking that these data indicate far greater transcrip-tomic changes than reported in the recent analysis of the gametophyte-to-sporophyte transition in the closely related moss, F. hygrometrica (Szovenyi et al., 2011), who used next generation sequencing to analyse RNA extracted from game-tophores (the leaf-like organs on which the antheridia and archegonia develop) and growing sporophytes. They then used the P. patens genome to tether Funaria sequences, which allowed them to map 34% of the Funaria transcripts. Of these unambiguously identified Funaria sequences, a relatively small percentage (4.2%, 558 genes) was differentially expressed between the gametophore tissue and the sporophyte tissue. Of these, 277 were upregulated and 281 were downregulated. These values compare with those reported here for the micro-array comparison of Physcomitrella gametophyte and early sporophyte tissue in which transcripts for 2042 genes were upregulated and 1919 genes were downregulated, represent-ing 12.8% of the 31 000 gene sequences on the array. Clearly the two analyses give quantitatively distinct results.
The analysis by Szovenyi et al. depended on the ability to map Funaria RNA sequences onto the Physcomitrella genome. Although partially successful, the total number of unambiguous sequences that were identified by this approach was limited, decreasing the total pool of genes analysed from over 30 000 on the array to fewer than 14 000 via the sequencing route. Both methods used relatively strin-gent criteria for calling expression as being significantly different, with the reliability of the data depending on dupli-cate biological samples in the sequencing analysis approach and triplicate biological samples with triplicate technical replicates per biological sample with the microarray analysis reported here.
One further major difference between the two analyses was the developmental stage of the gametophyte. The study by Szovenyi et al. used gametophores consisting of leaves and rhizoids whereas this analysis used the earlier protonemal stage as the source of gametophyte RNA. The protonemal stage is characterized by mainly filamentous growth, whereas the gametophore involves a switch of cellular organization into leaves, stems, and rhizoids. Therefore, one possibility is that it is this switch in cellular organization during gameto-phyte development which underpins the major change in transcriptome expression during moss development, with the switch from gametophyte to sporophyte reflecting a more lim-ited change in gene expression pattern. However, an analysis of the types of genes underpinning the altered expression pat-terns in the two studies suggests that this is not the case, as described below.
Transition to the sporophyte involves major changes in gene expression that are linked with carbohydrate and lipid/fatty acid metabolism
Carbohydrate metabolism Comparison of the biological
processes represented by the genes whose expression are up- or downregulated on the transition from protonemal gametophyte to early sporophyte development and during the development from early to mid-stage sporophyte provides an insight into the types of changes occurring (Fig. 4). The GO terms with the largest absolute number of changes comparing both G vs. ES and G vs. MS samples are involved in carbohydrate metabolism. Thus, the G vs. ES comparison reveals changes in 25% of all genes annotated in the Physcomitrella genome linked with this process (significant at P = 5.9E–09) (Fig. 4A and Supplementary
Tables S3, S4, and S9) and the G vs. MS comparison
indicates a switch in expression of 22.7% of all genes annotated as being involved in carbohydrate metabolic processes (P = 2.5E–06) (Fig. 4B and Supplementary Tables S5, S6, and S10). In contrast, comparison of ES vs. MS samples indicates changes in only 4.7% of all of the genes associated with this GO term and this is not significant (P = 0.35) (Fig. 4C and Supplementary Tables S7, S8, and S11). Carbohydrates are involved in many processes, including the production of structural components, cell signalling, metabolism for immediate energy or conversion to starch or lipid storage, and the development of spores (Koch, 1996; Graham and Wilcox, 2000; Glime, 2007a). Interestingly, although the total number of gene expression changes identified in the Funaria gametophyte/sporophyte transition was much lower than reported here, as already discussed, genes linked with carbohydrate metabolism also represented the most common GO term distinguishing the two tissue types in that study. Linked with this, it is noticeable that both studies identified GO terms ‘photosynthesis’ and ‘electron transport’ as being good discriminators of gametophyte and sporophyte tissue. Thus, in this study, the ES and MS stages were distinguished by virtually all genes linked with photosynthesis being downregulated relative to the G stage tissue (Fig. 4A, B and Supplementary Tables S2,
S9, and S10). These genes represent 39% (ES; P = 1.95E– 08) and 41.8% (MS; P = 8.11E–11), respectively, of all the Physcomitrella genes annotated linked with photosynthesis. In contrast, comparison of the transcriptome of ES and MS tissue revealed that only a small level fraction (0.9%) of genes associated with the GO term photosynthesis were differentially expressed and this was not statistically significant (Supplementary Tables S2 and S11). Finally, changes in the GO term glycolysis appeared in all three comparisons (G vs. ES, G vs. MS, and ES vs. MS) but the differences were only marginally significant in the G vs. MS comparison (P = 0.06). However, it is noticeable that in the ES vs. MS comparison, all genes of this class were recorded as showing an increase in transcript level. Overall, both this study and that of Szovenyi et al. (2011) indicate that the gametophyte-to-sporophyte transition is marked by major changes in carbohydrate and energy metabolism.
at Royal Hallamshire Hospital on September 29, 2015
http://jxb.oxfordjournals.org/
Genes affected included those which encode for cellu-lase (involved in cell-wall construction during cell expan-sion and fruit ripening; Rose and Bennett, 1999) and citrate synthase (involved in the electron transport chain and amino acid biosynthesis; Wiegand and Remington, 1986). This is to be expected if one considers the struc-tural and reproductive changes that take place between the gametophyte and sporophyte. UDP-Glucose 4-epime-rase/UDP-sulfoquinovose synthase was more strongly
represented in all three of the upregulated sporophyte datasets than was the case in the downregulated ones (i.e. has a lower expression in the gametophyte). Various iso-forms of the UDP-glucose 4-epimerase gene influence growth and cell-wall biosynthesis, act in stress situations, or influence pollen development in Arabidopsis (Rosti
et al., 2007). UDP-sulfoquinovose synthase on the other hand is involved in maintaining balance in the thylakoid membrane (Benning, 1998; Sanda et al., 2001). Another
0 20 40 60 80 100
Apoptosis Photosynthesis Reproduction Response to hormone stimulus Vitamin metabolic process Transmembrane transport Amino acid metabolic process Glycolysis Cell wall organization Response to stress Protein ubiquitination Lipid metabolic process Signal transduction Electron transport Proteolysis Regulation of transcription, DNA-dependent Protein amino acid phosphorylation Carbohydrate metabolic process Apoptosis Photosynthesis Reproduction Response to hormone stimulus Vitamin metabolic process Transmembrane transport Amino acid metabolic process Glycolysis Cell wall organization Response to stress Protein ubiquitination Lipid metabolic process Signal transduction Electron transport Proteolysis Regulation of transcription, DNA-dependent Protein amino acid phosphorylation Carbohydrate metabolic process Apoptosis Photosynthesis Reproduction Response to hormone stimulus Vitamin metabolic process Transmembrane transport Amino acid metabolic process Glycolysis Cell wall organization Response to stress Protein ubiquitination Lipid metabolic process Signal transduction Electron transport Proteolysis Regulation of transcription, DNA-dependent Protein amino acid phosphorylation Carbohydrate metabolic process
Up-regulated
Down-regulated A. G vs. ES
B. G vs. MS
[image:7.612.151.417.43.534.2]C. ES vs. MS
Fig. 4. Comparative functional gene ontology analysis for Physcomitrella gametophyte and sporophyte tissue: (A) gametophytic tissue compared to early sporophyte tissue (G vs. ES); (B) gametophyte tissues compared to mid-sporophyte tissue (G vs. MS); (C) early sporophyte tissues compared with mid-sporophyte tissue (ES vs. MS). The charts show the number of genes that fall into a particular gene ontological (GO) term for biological process category in the comparison of gene expression derived from Fig. 2. Upregulated genes are represented by dark grey bars and downregulated genes are represented by light grey bars. GO terms are organized in decreasing order of the number of upregulated genes associated with each category.
at Royal Hallamshire Hospital on September 29, 2015
http://jxb.oxfordjournals.org/
gene, xyloglucan:xyloglucosyl transferase, is involved in the cell wall and this enzyme’s substrate, xyloglucan, is involved in developmental processes such as pollen forma-tion in Arabidopsis (Otegui and Staehelin, 2000; Freshour
et al., 2003) and Capsicum annuum (Barany et al., 2010). Xyloglucans have been identified in the Physcomitrella cell wall (Pena et al., 2008), but no data are available docu-menting their function in the moss sporophyte.
Both developmental stages contain green tissue and are, thus, presumably photosynthetic. However, the sporophyte stage represents a commitment of the plant to spore differen-tiation and eventual death of the sporophyte (Glime, 2007b). To what extent the gametophyte nourishes the sporophyte remains a point of debate, but the combined microarray data from the two studies are consistent with the gametophyte (protonema and gametophore) having a primary role in pho-tosynthesis, resource acquisition, and long-term maintenance of the plant, with the sporophyte (which has high energy costs linked with spore formation and dispersal) being pre-dominantly reliant on the gametophyte for both carbon and energy. A decrease in transcript level of genes linked with elec-tron transport and an increase in transcripts related to glyco-lysis in the sporophyte also fits with an organ whose energy requirements cannot be met by oxidative respiration alone.
A potential complication of interpreting these data is that a 15 °C temperature shift was required to elicit sporophyte devel-opment in Physcomitrella, which is likely to influence meta-bolic-linked gene expression. However, subsequent to this low temperature elicitation, sporophyte development progressed in identical conditions to gametophyte growth, thus any temperature-related difference would need to be maintained despite a return to normal growth conditions. Moreover, the similarity of the types of carbohydrate metabolism-linked genes identified in the two independent studies suggests that this temperature shift is not a major confounding issue.
Lipid and fatty acid metabolism An analysis of the transcript levels for genes associated with lipid metabolism also supports the inference that the sporophyte is distinguished from the gametophyte by a distinct biochemical state, in particular one which is dependent on the import of carbon and energy. Gene expression linked with lipid metabolism tended to be upregu-lated in the gametophyte/sporophyte comparison (Fig. 4). For example, in the G vs. MS comparison, 23.2% of genes with the GO term ‘lipid metabolic processes’ showed altered transcript level, and this was significant at the P = 0.001 confidence level (Supplementary Tables S2 and S10). Analysis of this GO term indicates a shift of 19.2% of these genes on the G to ES transition (P = 0.16) (Supplementary Table S2). Such major shifts were not identified during the ES to MS transition, with only 3.6% of the genes with this GO term being differentially expressed.
As with the recorded shift in genes linked with carbohy-drate metabolism, changes in lipid metabolism-associated gene expression are indicative of a major shift in metabo-lism occurring during sporophyte formation. Lipid and fatty acid metabolism are required for pollen development in Arabidopsis, as well as wound response, biotic defence, stor-age, and signalling (Murphy, 1993; Porta and Rocha-Sosa,
2002; Ryu, 2004; Senger, 2005; Rensing et al., 2007; de Azevedo Souza et al., 2009). If photosynthesis in the spo-rophyte is insufficient to provide the carbon requirements of the developing sporophyte, then import and potentially local storage and use of alternative carbon sources would be required. Lipids could fulfil this function. It is interesting to note that no major changes in the expression pattern of these genes were noted during later sporophyte development (ES to MS). This is the developmental stage when spore forma-tion begins and one might expect this process to be linked with intense lipid metabolism (Huang et al., 2009). It is pos-sible that many of the metabolic pathways required for spore formation are established early in sporophyte development, laying down the foundation for a later, rapid process of spore differentiation. Finally, the potential role of fatty acid metab-olism in pollen development has also been noted (Wang et al., 2008) and it will be interesting to explore the types of lipid metabolism that are involved in moss spore formation.
Other metabolic changes
In the G vs. MS comparison, 21.5% of all Physcomitrella genes with the GO term ‘cellular amino acid metabolic process’ showed a change in transcript level with the majority showing a downregulation in transcript level, which was highly significant (P = 0.009) (Supplementary Tables S2 and S10). Comparison of G vs. ES samples showed that 19.5% of the genes displayed an altered transcript level, but this was not significant (P = 0.12) (Supplementary Tables S2 and S9). However, when considering only those genes with this GO term which were downregulated, the differences were significant (P = 1.46E–04). The functional reason behind potential changes in amino acid metabolism is unclear but it is a further indication that the metabolism of the early gametophyte and sporophyte are distinct.
Cell walls
As noted already, altered carbohydrate metabolism appears as a major signature of the differences that distinguish the gametophyte and the sporophyte. This was also reflected in altered transcript levels of genes implicated in carbon storage and cell-wall formation. Thus, 39% of all genes linked with ‘cell-wall organization’ in the Physcomitrella genome were identified as being significantly differentially expressed in the G vs. ES comparison (P = 5.0E–06), with 43% being identi-fied in the G vs. MS comparison (P = 3.38E–08). In the ES vs. MS comparison it was 12% (P = 0.005) (Supplementary Tables S2, S9, S10, and S11). The sporophyte generation has a distinct morphology and undergoes a specific pathway of differentiation. This includes the generation of spores which are characterized by a highly resistant cell wall. At the same time, the protonemal stage has a distinct cellular organization which might be reflected in specific cell-wall structure.
This analysis supports the hypothesis that changes in cell-wall structure and function distinguish the protonemal and sporophyte stages of moss development and identifies a swathe of genes whose products are potentially involved in this process. For example, genes implicated in xyloglucan
at Royal Hallamshire Hospital on September 29, 2015
http://jxb.oxfordjournals.org/
processing were identified as being upregulated in sporo-phyte tissue. These cell-wall polymers have not been detected in three charophycean green algae species (Manhart and Palmer, 1990; Kranz et al., 1995) but have been identified in moss gametophytes, leading to the suggestion that xylo-glucans might have played an important role in the transi-tion to terrestrial life. This hypothesis is further supported by the reports that xyloglucan:xyloglucosyl transferases are involved in pollen development in both Arabidopsis (Otegui and Staehelin, 2000; Freshour et al., 2003) and Capsicum annuum (Barany et al., 2010). Similarly, genes encoding UDP-glucose 4-epimerase were identified as being upregulated in sporophyte tissue and this enzyme has also been implicated in pollen development in Arabidopsis (Rosti et al., 2007).
Changes in transcription factor gene expression
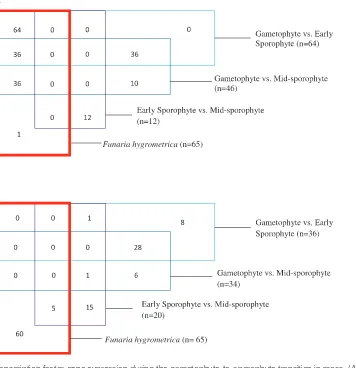
Major changes in the transcriptome suggest that altered tran-scription factor activity is likely to underpin the dramatic developmental changes involved in the alternation of genera-tions. The data do indeed indicate that there is a change in the expression of genes linked with the regulation of tran-scription on this transition (Fig. 4A, B and Supplementary Tables S2, S9, and S10). Szovenyi et al. (2011) also identi-fied GO terms linked with transcription factors as being a good discriminator of gametophyte and sporophyte tissue. Strikingly, the identical 64 transcription factors were identi-fied as being upregulated in both studies (Physcomitrella G vs. ES and Funaria gametophore vs. sporophyte), despite the different gametophyte tissue used in the two studies (Fig. 5). This exact correlation from two independent studies using different species suggests that these transcription factors play a crucial role in the gametophyte to sporophyte transition. Interestingly, however, none of the 36 transcription factors identified as being downregulated in the G to ES transition in this study were identified in the Funaria experiment, nor were any of the 34 downregulated transcription factors identified in the G vs. MS comparison. These results suggest that the gametophyte-to-sporophyte transition is linked with both up- and downregulation of transcription factor gene expression; however, the Funaria study may have missed a large number of the genes whose expression is repressed during this shift. The reasons for this are unclear but may reflect the overall lower number of genes that can be unequivocally identified using a high throughput sequencing approach and an indirect anchor genome.
These data provide a first glimpse of the types of transcrip-tion factors associated with sporophyte development. Thus, 12 transcription factors were identified as being differentially expressed during the transition from early to mid sporo-phyte. These include a MADS box domain protein, GATA transcription factors, and pathogenesis-related transcription factors. The development of the moss sporophyte is distin-guished by the acquisition of a number of traits which are thought to be linked to the ability of the sporophyte to with-stand abiotic stresses associated with a terrestrial environ-ment. For example, the moss sporophyte develops stomata (Chater et al., 2011) which are thought to allow better control
of water balance, and the differentiation of spores involves the development of novel cell-wall characteristics which allow them to cope with both a dry and UV-rich environment (Wallace et al., 2011). The transcription factors identified in this study will help to identify the key players involved in the acquisition of these developmental novelties which enabled the gradual dominance of the sporophyte generation on land.
Examination of the types of transcription factor showing differential expression between gametophyte and sporophyte tissues revealed some interesting correlations. Two MADS-box transcription factor genes (an unspecified MADS MADS-box transcription factor and PpMA12) were found in both the G vs. ES and G vs. MS comparisons and downregulated in the sporophyte with respect to the gametophyte. A third MADS box gene (PpMADS2) noted in the G vs. ES com-parison was also downregulated in the sporophyte with respect to the gametophyte. PpMADS2 and PpMAD12 are MIKC* MADS domain proteins and the MIKC* group genes have previously been identified to be mainly expressed in the Arabidopsis male gametophyte (Kofuji et al., 2003;
Verelst et al., 2007), with one member of the group being expressed in the female gametophyte (Lehti-Shiu et al., 2005). According to PlantTFDB 2.0 (Zhang et al., 2011) PpMADS2 is orthologous to AGAMOUS-LIKE66 and AGAMOUS-LIKE104, both of which are involved in pollen development in Arabidopsis (Adamczyk and Fernandez, 2009). Previous investigations on MADS box genes in the related species Funaria found that orthologues of PpMADS2 and PpMA12 were more strongly expressed in gametophyte tissue relative to sporophyte tissue (Zobell et al., 2010), suggesting that it is conserved between the two bryophytes. Only one MADS-box gene (PpTIM1) was noted to be upregulated on the transi-tion from ES to MS stage. This gene was not noted as being significantly differentially expressed in the comparisons with gametophyte tissue, suggesting that it plays a specific role in the developing sporophyte. Further genetic analysis of these transcription factors may reveal evolutionary conserved roles in sporophyte formation and development.
The role of post-transcriptional changes and hormone signalling in the gametophyte to sporophyte transition
Although major changes in transcription factor gene expres-sion occur on the gametophyte-to-sporophyte transition, this analysis indicated that post-transcriptional regulation is also likely to play a role in this developmental switch (Fig. 4). MAPKs were identified as being differentially expressed and similar gene products have been implicated in various aspects of cytoskeleton organization and signalling in higher plants (Reiland et al., 2009; Bartels et al., 2010; Rodriguez et al., 2010), including pollen development (Chaiwongsar et al., 2006) and stomatal development (Lampard et al., 2009). The study on Funaria gametophore to sporophyte transi-tion also identified genes associated with the GO term ‘pro-tein amino acid phosphorylation’ as distinguishing the two samples, again suggesting that, despite the distinct stages of gametophyte tissue used, the two studies identify genes which play a role in the sporophyte transition. This current study
at Royal Hallamshire Hospital on September 29, 2015
http://jxb.oxfordjournals.org/
also analysed the early and mid-sporophyte stages, with the majority of genes linked with protein phosphorylation being upregulated in the G vs. ES comparison, whereas in the G vs. MS comparison the number of genes showing up- and down-regulation of transcript level was very similar. This suggests that early sporophyte development might show a distinct pat-tern of post-transcriptional regulation compared with later stages of sporophyte development. As suggested by the anal-ysis of carbohydrate and lipid metabolism, the data are con-sistent with the idea that the fates of many tissues of the moss sporophyte are determined early in sporophyte development.
Hormone signalling is closely linked with post-transcrip-tional protein modifications and is associated with numer-ous developmental transitions and responses in higher plant. For example, the expression of some auxin response genes is altered on the transition from gametophyte to sporophyte including an auxin response factor (ARF) (Sessions et al.,
1997; Guilfoyle and Hagen, 2007) and Nup160 which has
been implicated in cold tolerance, flowering time regulation,
and seedling growth in Arabidopsis (Dong et al., 2006; Parry
et al., 2006). Ethylene-responsive transcription factors were also differentially expressed (Licausi et al., 2010; Liu et al., 2011). Finally, the expression of GLP2/GID2 (implicated in gibberellin signalling) was upregulated in the early and mid-sporophyte stages relative to the gametophyte, but was not differentially expressed in the ES vs. MS comparison. The role of gibberellins in moss is unclear (Hirano et al., 2007;
Yasumura et al., 2007), but there does appear to be a role for this class of growth factor in Physcomitrella spore germina-tion (Anterola et al., 2009).
Changes in stomata-associated gene expression in the moss sporophyte
Physcomitrella, like most mosses, produces stomata only
[image:10.612.133.489.44.412.2]on its sporophyte and not on the gametophyte. Transcripts homologous to many Arabidopsis genes controlling stomatal development were detected in the microarray, and several of Fig. 5. The pattern of transcription factor gene expression during the gametophyte-to-sporophyte transition in moss: (A) upregulated genes (B) downregulated genes. The distribution of genes encoding transcription factors whose expression is differentially regulated between gametophyte vs. early sporophyte, gametophyte vs. mid-sporophyte, and early sporophyte vs. mid-sporophyte in
Physcomitrella and the overlap of these transcription factor gene identities with those characterized as being differentially expressed on the gametophyte vs. sporophyte transition in Funaria (bold box), described in Szovenyi et al (2011) (this figure is available in colour at
JXB online).
at Royal Hallamshire Hospital on September 29, 2015
http://jxb.oxfordjournals.org/
these were significantly differentially expressed in this analy-sis between the protonemal tissue and the early and mid-spo-rophytic tissues (Supplementary Table S18A). Of particular interest is the sporophyte upregulation of Phypa_209063, a homologue to the Arabidopsis bHLH transcription factor ICE1/SCREAM which forms a heterodimer with bHLHs SPCH, MUTE, and FAMA to induce stomatal fate transi-tions (Kanaoka et al., 2008). MUTE- and FAMA-like genes
PpSMF1 (Phypa_184221) and PpSMF2 (Phypa_156270) are
present in Physcomitrella (MacAlister and Bergmann, 2011). Interestingly, PpSMF1 is significantly upregulated in ES vs. MS. A bHLH heterodimer may therefore be implicated in the initiation and proliferation of stomatal precursors in the moss spore capsule as it is in angiosperms.
Negative regulation of Arabidopsis stomata occurs via mitogen-activated protein kinases (MAPKs) in a phospho-rylation cascade involving YODA, MKKs 4/5, and MPKs 3/6 (Bergmann et al., 2004; Wang et al., 2007; Lampard
et al., 2009). Homologues to all these MAPKs are expressed in the developing sporophyte, although not differentially. Homologues to components upstream of these cascades, the EPIDERMAL PATTERNING FACTOR (EPF) family pep-tides (Hara et al., 2007, 2009; Hunt and Gray, 2009; Abrash and Bergmann, 2010; Abrash et al., 2011), the leucine-rich repeat receptor kinases ERECTA (ER), ERECTA-LIKE 1 (ERL1), and ERL2 (Shpak et al., 2005), and a leucine-rich repeat-receptor-like protein, TOO MANY MOUTHS (TMM) (Yang and Sack, 1995; Nadeau and Sack, 2002) are also expressed in the sporophyte. Intriguingly, PpTMM (Phypa_51089), a homologue of AtTMM (Peterson et al., 2010), is not differentially expressed between gametophyte and early sporophyte, but is significantly downregulated in MS vs. G. Furthermore, several ERECTA-like kinase tran-scripts (Villagarcia et al., 2012) are differentially expressed;
PpERL1a (Phypa_152090) is significantly downregulated
across analyses, whereas PpERL2b (Phypa_136017) is sig-nificantly upregulated in the sporophyte. Phypa_117216 and Phypa_205498, two homologues of STOMATAL DENSITY
AND DISTRIBUTION 1 (SDD1), a subtilase which
inter-acts with TMM (Berger and Altmann, 2000; von Groll et al., 2002), are significantly upregulated in the sporophyte. These expression patterns strongly suggest a specialized role for sub-tilases in the young capsule and warrant further investigation. The expanding Physcomitrella sporophyte possesses mature and active stomata (Supplementary Fig. S3; Chater et al., 2011) and expression of many homologues to Arabidopsis genes present in developed guard cells can be detected in this analysis (Supplementary Table S18B). Key genes that are differentially expressed in this experiment include
OPEN STOMATA 1 (OST1)-like homologues PpOST1-3
(Phypa_195464) and PpOST1-2 (Phypa_106968) (Thelander
et al., 2009). These are significantly upregulated in both the early and the mid-stage sporophyte, and their expression may contribute to the partial redundancy observed in PpOST1-1 (Phypa_194508) function in Physcomitrella stomatal closure (Chater et al., 2011). AtOST1 is a Snf-related serine/threo-nine protein kinase (SnRK2) which positively regulates ABA-induced stomatal closure in Arabidopsis (Mustilli et al., 2002).
PpHA5 (Phypa_234515), a plasma membrane H+ ATPase/
proton transporter (Garciadeblas et al., 2007; Okumura et al., 2012), is upregulated in the mid-sporophyte, but not early sporophyte. PpHA5 has 84.7% similarity to guard cell-associ-ated Arabidopsis OPEN STOMATA 2 (OST2) (Merlot et al., 2007) and 80% similarity to AtHA5, which is upregulated in guard cells in response to ABA and relative humidity change (Bauer et al., 2013). Phypa_136150, the only Physcomitrella homologue to Arabidopsis ENHANCED RESPONSE TO ABSCISIC ACID 1 (ERA1), a farnesyltransferase β subunit that negatively regulates guard cell ABA signalling (Pei et al., 1998; Allen et al., 2002), is significantly upregulated in both early and mid-sporophyte tissue. PpECA5 (Phypa_223041), a homologue to PIIA-type Ca2+-ATPases AtECA1 and
AtECA3 (Pedersen et al., 2012), is also significantly expressed in the capsule. AtECA1 and AtECA3 both show high expres-sion in guard cells (Li et al., 2008; Mills et al., 2008) and are likely to be involved in stomatal calcium-dependent ABA signalling. PpSUT4C (Phypa_194787) and PpSUT4A (Phypa_194644), moss sucrose transporters (Reinders et al., 2012), are both significantly upregulated in the sporophyte. Arabidopsis sucrose transporters AtSUC2 and AtSUC3 are expressed in guard cells (Meyer et al., 2004) and are puta-tively involved in the convergence of osmoregulatory and CO2 sensing pathways through carbohydrate metabolism
(Vavasseur and Raghavendra, 2005). Physcomitrella has five β carbonic anhydrases (Tanz et al, 2009), of which three are strongly downregulated in the sporophyte, while one, PpβCAII (Phypa_130288), is significantly upregulated in both the early and mid-sporophyte. β-Carbonic anhydrases are implicated in guard cell CO2 sensing and signal
transduc-tion in Arabidopsis (Hu et al., 2010). The sporophyte expres-sion of PpβCAII may indicate a guard cell specific role for this β carbonic anhydrase.
Taken together, the sporophyte expression profile of these Physcomitrella genes strongly suggests that both moss stoma-tal development and guard cell physiology share core genetic mechanisms with Arabidopsis. The possibility that these sig-nalling pathways are highly conserved supports the theory that stomata are monophyletic (Raven, 2002; Ligrone et al., 2012) and reinforces the pivotal role stomata have played in the evo-lution of land plants and terrestrial life (Beerling, 2007).
In conclusion, these data indicate that the transition from the gametophyte to sporophyte stage in a basal non-vascular land plant with a gametophyte dominant lifecycle (P. patens, moss) is accompanied by major changes in gene expression profile. They also provide an analysis of the gene expression changes that occur during the early stages of moss sporophyte development. The data support the idea that the moss sporo-phyte is highly dependent on the gametosporo-phyte for carbon and energy to fuel the process of sporogenesis. The sporophyte regulation of genes implicated in stomatal development and physiology, however, suggests that stomagenesis and the regu-lators of stomatal aperture are deeply conserved across land plants. These data provide a resource for the future identifi-cation and characterization of further genes involved in the acquisition of key traits linked with the evolutionary success of the sporophyte in the colonization of the land.
at Royal Hallamshire Hospital on September 29, 2015
http://jxb.oxfordjournals.org/
Supplementary material
Supplementary data are available at JXB online.
Supplementary Fig. S1. Plot densities of raw and normal-ized microarray data.
Supplementary Fig. S2. MA plots of raw and normalized
microarray data.
Supplementary Fig. S3. Stomatal development in the
expanding Physcomitrella sporophyte.
Supplementary Table S1. List of primers used in
semi-quantitative RT-PCR.
Supplementary Table S2. Number of genes in GO
categories.
Supplementary Table S3. List of significantly upregulated gene transcripts (G vs. ES comparison).
Supplementary Table S4. List of significantly downregu-lated gene transcripts (G vs. ES comparison).
Supplementary Table S5. List of significantly upregulated gene transcripts (G vs. MS comparison).
Supplementary Table S6. List of significantly downregu-lated gene transcripts (G vs. MS comparison).
Supplementary Table S7. List of significantly upregulated gene transcripts (ES vs. MS comparison).
Supplementary Table S8. List of significantly downregu-lated gene transcripts (ES vs. MS comparison).
Supplementary Table S9. Genes showing significantly
altered transcript level (G vs. ES comparison) listed by meta-bolic process.
Supplementary Table S10. Genes showing significantly
altered transcript level (G vs. MS comparison) listed by meta-bolic process.
Supplementary Table S11. Genes showing significantly
altered transcript level (ES vs. MS comparison) listed by met-abolic process.
Supplementary Table S12. The fold change of genes (G vs. ES comparison).
Supplementary Table S13. The fold change of genes (G vs. MS comparison).
Supplementary Table S14. The fold change of genes (ES vs. MS comparison).
Supplementary Table S15. Annotation of genes (G vs. ES comparison).
Supplementary Table S16. Annotation of genes (G vs. MS comparison).
Supplementary Table S17. Annotation of genes (ES vs. MS comparison).
Supplementary Table S18. Expression of moss homologues to stomata-associated Arabidopsis genes.
Acknowledgements
The authors thank Cheryl Fleming at the University of Sheffield for assistance with the microarray analysis and mem-bers of the Fleming, Gray, and Beerling groups for useful dis-cussions. They are extremely grateful to the Clay Foundation for a donation which enabled the microarray analysis. M-T O’D was supported by an EU grant (GIPS network), SW by a NERC studentship, and CC by a BBSRC studentship.
References
Abrash EB, Bergmann DC. 2010. Regional specification of stomatal
production by the putative ligand CHALLAH. Development137,
447–455.
Abrash EB, Davies KA, Bergmann DC. 2011. Generation of
signaling specificity in Arabidopsis by spatially restricted buffering of
ligand–receptor interactions. The Plant Cell23, 2864–2879.
Adamczyk BJ, Fernandez DE. 2009. MIKC* MADS domain heterodimers are required for pollen maturation and tube growth in Arabidopsis. Plant Physiology149, 1713–1723.
Allen GJ, Murata Y, Chu SP, Nafisi M, Schroeder JI. 2002. Hypersensitivity of abscisic acid-induced cytosolic calcium increases
in the Arabidopsis farnesyltransferase mutant era1-2. The Plant Cell
14, 1649–62.
Anterola A, Shanle E, Mansouri K, Schuette S, Renzaglia K.
2009. Gibberellin precursor is involved in spore germination in the
moss Physcomitrella patens. Planta229, 1003–1007.
Barany I, Fadon B, Risueno MC, Testillano PS. 2010. Cell wall components and pectin esterification levels as markers of proliferation and differentiation events during pollen development and pollen
embryogenesis in Capsicum annuum L. Journal of Experimental
Botany61, 1159–1175.
Bartels S, Gonzalez Besteiro MA, Lang D, Ulm R. 2010. Emerging
functions for plant MAP kinase phosphatases. Trends in Plant Science
15, 322–329.
Bauer H, Ache P, Wohlfart F, Al-Rasheid KAS, Sonnewald S, Sonnewald U, Kneitz S, Hetherington AM, Hedrich R. 2013. How do stomata sense reductions in atmospheric relative humidity? Molecular Plant (Epub ahead of print).
Beerling DJ. 2007. The emerald planet. How plants changed Earth’s history . Oxford, Oxford University Press.
Bennici A. 2008. Origin and early evolution of land plants: problems
and considerations. Communicative and Integrative Biology1,
212–218.
Benning C. 1998. Biosynthesis and function of the sulfolipid
sulfoquinovosyl diacylglycerol. Annual Review of Plant Physiology and
Plant Molecular Biology49, 53–75.
Berger D, Altmann T. 2000. A subtilisin-like protease involved in the
regulation of stomatal density and distribution in Arabidopsis thaliana.
Genes and Development14, 1119–1131.
Bergmann DC, Lukowitz W, Somerville C. 2004. Stomatal
development and pattern controlled by a MAPKK kinase. Science
304, 1494–1497.
Chaiwongsar S, Otegui MS, Jester PJ, Monson SS, Krysan PJ.
2006. The protein kinase genes MAP3K epsilon 1 and MAP3K epsilon
2 are required for pollen viability in Arabidopsis thaliana. The Plant
Journal48, 193–205.
Chater C, Kamisugi Y, Movahedi M, Fleming A, Cuming C, Gray JE, Beerling DJ. 2011. Regulatory mechanism controlling stomatal behaviour conserved across 400 million years of land plant evolution. Current Biology21, 1025–1029.
Conesa A, Gotz S. 2008. blast2go: a comprehensive suite for
functional analysis in plant genomics. International Journal of Plant
Genomics2008, 619832.
at Royal Hallamshire Hospital on September 29, 2015
http://jxb.oxfordjournals.org/
Conesa A, Gotz S, Garcia-Gomez JM, Terol J, Talon M, Robles M.
2005. blast2go: a universal tool for annotation, visualization and analysis
in functional genomics research. Bioinformatics21, 3674–3676.
de Azevedo Souza C, Kim SS, Koch S, Kienow L, Schneider K, McKim SM, Haughn GW, Kombrink E, Douglas CJ. 2009. A novel fatty acyl-CoA synthetase is required for pollen development and
sporopollenin biosynthesis in Arabidopsis. The Plant Cell21, 507–525.
Dong CH, Hu X, Tang W, Zheng X, Kim YS, Lee BH, Zhu JK.
2006. A putative Arabidopsis nucleoporin, AtNUP160, is critical for
RNA export and required for plant tolerance to cold stress. Molecular
and Cell Biology26, 9533–9543.
Freshour G, Bonin CP, Reiter WD, Albersheim P, Darvill AG, Hahn MG. 2003. Distribution of fucose-containing xyloglucans in
cell walls of the mur1 mutant of Arabidopsis. Plant Physiology131,
1602–1612.
Garciadeblas B, Barrero-Gil J, Benito B, Rodríguez-Navarro
A. 2007. Potassium transport systems in the moss Physcomitrella
patens, pphak1 plants reveal the complexity of potassium uptake. The Plant Journal52, 1080–1093.
Glime JM. 2007a. Life cycles: surviving change. In: Bryophyte ecology, volume 1 physiological ecology , ebook. Houghton: Michigan Technological University and the International Association of
Bryologists. Available at: http://www.bryoecol.mtu.edu.
Glime JM. 2007b. Ecophysiology of development. In: Bryophyte ecology, volume 1 physiological ecology , ebook. Houghton: Michigan Technological University and the International Association of
Bryologists. Available at: http://www.bryoecol.mtu.edu.
Gotz S, Garcia-Gomez JM, Terol J, Williams TD, Nagaraj SH, Nueda MJ, Robles M, Talon M, Dopazo J, Conesa A. 2008.
High-throughput functional annotation and data mining with the blast2go
suite. Nucleic Acids36, 3420–3435.
Graham LK, Wilcox LW. 2000. The origin of alternation of generations in land plants: a focus on matrotrophy and hexose
transport. Philosophical Transactions of the Royal Society of London B
355, 757–766.
Guilfoyle TJ, Hagen G. 2007. Auxin response factors. Current Opinion in Plant Biology10, 453–460.
Haig D, Wilczek A. 2006. Sexual conflict and the alternation of
haploid and diploid generations. Philosophical Transactions of the
Royal Society of London B361, 335–343.
Hara K, Kajita R, Torii KU, Bergmann DC, Kakimoto T. 2007. The secretory peptide gene EPF1 enforces the stomatal one-cell-spacing
rule. Genes and Development21, 1720–1725.
Hara K, Yokoo T, Kajita R, Onishi T, Yahata S, Peterson KM, Torii KU, Kakimoto T. 2009. Epidermal cell density is autoregulated via a secretory peptide, EPIDERMAL PATTERNING FACTOR 2 in Arabidopsis leaves. Plant Cell Physiology50, 1019–1031.
Hirano K, Nakajima M, Asano K, et al. 2007. The GID1-mediated gibberellin perception mechanism is conserved in the lycophyte Selaginella moellendorffii but not in the bryophyte Physcomitrella patens. The Plant Cell19, 3058–3079.
Hu H, Boisson-Dernier A, Israelsson-Nordstrom M, Bohmer M, Xue S, et al. 2010. Carbonic anhydrases are upstream regulators
of CO2-controlled stomatal movements in guard cells. Nature Cell
Biology12, 87–93.
Huang C-Y, Chung C-I, Lin Y-C, Hsing C, Huang AHC. 2009.
Oil bodies and oleosins in Physcomitrella possess characteristics
representative of early trends in evolution. Plant Physiology150,
1192–1203.
Hughes JS, Otto SP. 1999. Ecology and the evolution of biphasic life
cycles. American Naturalist154, 306–320.
Hunt L, Gray JE. 2009. The signaling peptide EPF2 controls
asymmetric cell divisions during stomatal development. Current
Biology19, 864–869.
Kasahara M, Hiwatashi Y, Ishikawa T, Suzuki Y, Kamisugi Y, Lang D, Cuming AC, Reski R, Hasebe M, Nishiyama T. 2011.
Genetic map of Physcomitrella patens based on SNP identification
with Illumina sequencing. In: S Rensing, ed, Conference Proceedings
of Moss 2011 . Germany: University of Freiburg.
Kanaoka MM, Pillitteri LJ, Fujii H, Yoshida Y, Bogenschutz NL, Takabayashi J, Zhu J-K, Torii KU. 2009. SCREAM/ICE1 and SCREAM2 specify three cell-state transitional steps leading to Arabidopsis stomatal differentiation. The Plant Cell20, 1775–1785.
Kenrick MK, Jiang L, Potts CL, Owen PJ, Shuey DJ, Econome JG, Anson JG, Quinet EM. 1997. A homogeneous method to quantify mRNA levels: a hybridization of RNase protection and
scintillation proximity assay technologies. Nucleic Acids Research25,
2947–2948.
Kenrick PC, Peter R. 1997. The origin and early evolution of plants
on land. Nature389, 33–39.
Knight CD, Cove DJ, Cuming AC, Quatrano RS. 2002. Moss gene
technology. In: PM Gilmarti, C Bowler, eds, Molecular plant biology – a
practical approach . Oxford: Oxford University Press, pp 285–302.
Koch KE. 1996. Carbohydrate-modulated gene expression in plants. Annual Review of Plant Physiology and Plant Molecular Biology47,
509–540.
Kofuji R, Sumikawa N, Yamasaki M, Kondo K, Ueda K, Ito M, Hasebe M. 2003. Evolution and divergence of the MADS-box gene
family based on genome-wide expression analyses. Molecular Biology
and Evolution20, 1963–1977.
Kranz HD, Miks D, Siegler ML, Capesius I, Sensen CW, Huss
VA. 1995. The origin of land plants: phylogenetic relationships among
charophytes, bryophytes, and vascular plants inferred from complete
small-subunit ribosomal RNA gene sequences. Journal of Molecular
Evolution41, 74–84.
Lampard GR, Lukowitz W, Ellis BE, Bergmann DC. 2009. Novel
and expanded roles for MAPK signaling in Arabidopsis stomatal cell
fate revealed by cell type-specific manipulations. The Plant Cell21,
3506–17.
Langdale JA. 2008. Evolution of developmental mechanisms in
plants. Current Opinion in Genetics and Development18, 368–373.
Lehti-Shiu MD, Adamczyk BJ, Fernandez DE. 2005. Expression
of MADS-box genes during the embryonic phase in Arabidopsis. Plant
Molecular Biology58, 89–107.
Li X, Chanroj S, Wu Z, Romanowsky SM, Harper JH, Sze H.
2008. A distinct endosomal Ca2+/Mn2+ pump affects root growth
through the secretory process. Plant Physiology147, 1675–1689.
Licausi F, Giorgi FM, Zenoni S, Osti F, Pezzotti M, Perata
P. 2010. Genomic and transcriptomic analysis of the AP2/ERF
superfamily in Vitis vinifera. BMC Genomics11, 719.
at Royal Hallamshire Hospital on September 29, 2015
http://jxb.oxfordjournals.org/