ATISTISKE DEPARTEMENT FOR DE EuROPAEISKE FAELtESSKA8ER ■ OPPICE STATiSTlOUE DES COMMUN. CAL OFFICE OP THE EUROPEAN COMMUNITIES - STATISTISCHES AMT DER EUROPÄISCHEN GEMEIN LE COMUNITJI EUROPEE - Β
UROPAEI5KE FAEILESS MMUNITIES - STATISTISCHE! VOOR DE STATISTIEK DER E J OFFICE STA*STIQUE DES CO' DER EUROPÄISCHEN GEM ESE GEMEENSCHAPPEN NAUTES EUROPEENNES
-EN ISTITUTO STATISTIC STISKE DEPARTEMENT ICAL OFFICE OF THE EUROPE^ LE COMUNITÀ EUROPEE
-UROPAEiSKE F A E L L E S S K A B * ¿UNITIES - STATTSTISCHES ^
OF THE EUROPEAN COMMUNITIES . ι EUROPAISC" " " " " · . - ISTITUTO | A E U R O P E E - B U R E A U V O O R D E S T A T I S T I E K D E R E U R O P E S E G E M E E N S C H A P P E N D E T S T A T I S T I S K E D E P ' E FAELLESSKABER - OFFICE STAT.STiQuÉ DES COMMUNAUTES EUROPEENNES STATISTICAL OFFICE OF STATISTISCHES AMT DER EUROPAISCHEN GEMEINSCHAFTEN - ISTITUTO STAT'STICO DELLE COMUNITÀ EU TiSTIEK DER EUROPESE GEMEENSCHAPPEN - OFT STATiSTiSKE DEPARTEMENT FOR DE EUROPAE'SKE f A[ IQUE DES COMMUNAUTES EUROPEENNES - STATISTICAL OFFiCE Of THE EUROPEAN COMMUNITIES - STA CHEN GEMEINSCHAFTEN ISTIT UTO STATISTICO DELL E COMUNITÀ EUROPEE - BURE Au VOOR DE STATISI HAPPEN - DET STATISTISKE ¡DEPARTEMENT FOR DE EUROPAEISKE F AELL ESSORER OFFICE STATISTIQUE C
LANDBRUGSPR1SER
AGRARPREISE
AGRICULTURAL PRICEY
PRIX AGRICOLES
PREZZI AGRICOLI
LANDBOUWPRIJZEN
EKSPRESINFORMATION
SCHNELLBERICHT
RAPIO INFORMATION
NOTE RAPIDE
NOTA RAPIDA
SPOEDBERICHT
Entwicklung d e r Erzeugerpreise landwirtschaftlicher Produkte 1977
Evolution of producer prices of agricultural products in 1977
Evolution des prix à la production des produits agricoles en 1977
Evoluzione dei prezzi alla produzione dei prodotti agricoli nel 1977
Auszug aus
: EGIndex der Erzeugerpreise landwirtschaftlicher
Produkte 19691977. Ausgabe : Mai 1978
Abstract from : ECIndex of producer prices of agricultural
products 19691977.
Issue : May 1978
Extrait de
: Indice CE des prix à la production des produits
agricoles 19691977. Sortie de p r e s s e : Mai 1978
Estratto da
Indice CE dei prezzi alla produzione dei prodotti
agricoli 19691977.
Stampato : Maggio 1978
Fassung Version Version Version«
D
E
F
I
EUROSTAT BP 1907 LUXEMBOURG TEL. 43011 - Redaktion afsluttet
- Veröffentlichung abgeschlossen
- Publication date 0 _ , Ο_ο
- Fin de rédaction Z o . 5 · 1 9 / 0 - Pubblicazione terminata
- Einde van de redactie
Landbrugs-, skovbrugs- og fiskeristatistik Statistik der Landwirtschaft, Forstwirtschaft und Fischerei Agriculture, forests and fisheries statistic» Statistiques de l'agriculture, des forets et de la pèche Statistiche dell'agricoltura, deile foreste e della pesca
Der EGIndex d e r E r z e u g e r p r e i s e landwirtschaftlicher Produkte erhöhte sich 1977 in d e r Gemeinschaft
im Durchschnitt um 8 , 5 % gegenüber dem Vorjahr. Diese Veränderungsrate liegt ganz wesentlich unter
denen d e r beiden Vorjahre (1976/1975: + 18,3 % und 1975/1974: + 13,7 %), wobei zu bemerken i s t , dass die extrem hohe Zuwachsrate im Jahr 1976 vor allem auf die Folgen d e r Trockenheit jenes Jahres zurück
zuführen i s t .
Innerhalb d e r Gemeinschaft weichen die Veränderurtgsraten d e r einzelnen Länder s t a r k von einander a b .
Wie Tabelle 1 zeigt, bewegen sie sich zwischen + 23,9 % (Italien)und 4,4%(BR Deutschland).
In Tabelle 2 werden die Veränderungsraten des EGIndexes d e r E r z e u g e r p r e i s e landwirtschaftlicher P r o
dukte nach Produktgruppen gezeigt. Daraus ergibt s i c h , dass die P r e i s e für pflanzliche E r z e u g n i s s e 1977 in EUR 9 verglichen mit 1976 um 1 % s t ä r k e r gestiegen sind a l s die P r e i s e für Tiere und t i e r i s c h e E r z e u g n i s s e , obwohl nach dem durch die Trockenheit bedingten hohen P r e i s n i v e a u des Jahres 1976 die E r z e u g e r p r e i s e für pflanzliche Produkte 1977 im Vergleich zu 1976 in allen L ä n d e r n , ausgenommen Italien, Irland
und Frankreich, sanken. Dagegen waren in allen Mitgliedstaaten weitere Erhöhungen d e r P r e i s e für t i e r i sche E r z e u g n i s s e zu v e r z e i c h n e n .
Hervorzuheben i s t u n t e r den Veränderungsraten d e r P r e i s e für pflanzliche E r z e u g n i s s e insbesondere d e r
P r e i s r ü c k g a n g bei Hackfrüchten (vor allem bei Speisekartoffeln). Auf d e r anderen S e i t e war in d e r Gemein
schaft die durchschnittliche Zuwachsrate d e r P r e i s e für Frischgemüse (+ 17,1 %), für Wein (+ 16,4 %) und für Blumen und Zierpflanzen (+17,9 %) ungefähr doppelt so hoch wie die Zuwachsrate d e r P r e i s e für pflanz liche E r z e u g n i s s e insgesamt. Auf Grund d e r schlechten Ernte stiegen die P r e i s e für F r i s c h o b s t in EUR 9 1977 gegenüber 1976 um 7 0 , 5 %, wobei d i e s e r Anstieg vor allem durch einen P r e i s a n s t i e g bei Tafeläpfeln und birnen um 90 % v e r u r s a c h t w u r d e .
Obwohl die E r z e u g e r p r e i s e für Tiere und t i e r i s c h e E r z e u g n i s s e 1977 im Vergleich zu 1976 im allgemeinen eine steigende Tendenz zeigten, waren sie doch s t a b i l e r a l s die P r e i s e für pflanzliche E r z e u g n i s s e . Be
sonders stabil w a r e n die Schweinepreise (ausgenommen in Irland). Bei den Geflügelpreisen war dagegen in d e r Gemeinschaft eine Steigerung von 14,5 % zu v e r z e i c h n e n .
Selbstverständlich können diese unterschiedlichen Tendenzen in der Agrarpreisentwicklung nicht i s o l i e r t
b e t r a c h t e t w e r d e n . F ü r eine abgewogene Beurteilung sind auch die Unterschiede in d e r Entwicklung d e r Kaufkraft d e r Währungen (Inflationsraten), die für die Landwirtschaft u . a . in d e r Entwicklung d e r
Einkaufspreise landwirtschaftlicher Betriebsmittel ihren Niederschlag finden, mit in die Ueberlegungen e i n zubeziehen. Zur Ergänzung d e r Statistiken über die E r z e u g e r p r e i s e landwirtschaftlicher Produkte hofft
EUROSTAT d a h e r , in a b s e h b a r e r Zeit die e r s t e n E r g e b n i s s e eines neu e r a r b e i t e t e n EGIndexes d e r Ein kaufspreise landwirtschaftlicher Betriebsmittel veröffentlichen zu können.
Anzumerken ist a u s s e r d e m noch, d a s s die durch die EGIndizes d e r E r z e u g e r p r e i s e aufgezeigten Tenden
zen jener P r o d u k t e , die einer gemeinsamen Marktordnung unterliegen, nicht nur das E r g e b n i s d e r EG
Agrarpreispolitik sind, sondern auch die normalen Marktkräfte widerspiegeln.
Tabelle l i Entwicklung des EGIndex der Erzeugerpreise landwirtschaftlicher Produkte 1977 gegenüber 1976, gegliedert nach Mitgliedstaaten
EUR 9 D Ρ I I B L UK IRL BK
Insgesamt 19771}
210,5 142,4 187,7 284,6 146,5 161,6 156,2 272,5 319,6 192,1
1977 Î976
+ 8,5 * - 4,4 * + 7,9 * + 23,9 * - 1.4 * + 0,1 * - 0,1 * + 1 , 4 * + 20,6 % + 4,0 *
Pflanzliche Erzeugnisse 19771J
239,2 145,6 202,5 306,3 154,8 193,9 180,9 300,2 306,3 200,1
1977 Ϊ976 + 9,0* - 17,8 * + 7,0 %
+ 31,0 %
- 8,3* - 1,9* - 8,6* - 13,0 * + 13,4 * - 1,5 *
Tiere und tierische Erzeugnisse
19771}
191,0 141,3 175,9 249,2 142,4 147,2 147,2 259,8 322,3 1189,7
1977 Ϊ976
+ 8,0 %
+ 1,6 * + 8,6 * + 11,9 * + 3,0 i
+ 1,4* + 4,2 * + 11,0 * + 22,0 %
+ 5,8 *
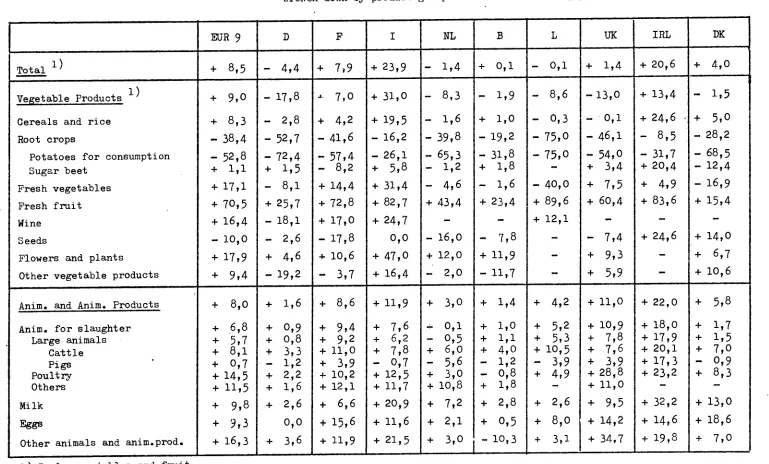
Tabelle 2: Veränderungsraten des EG-Index der Erzeugerpreise landwirtschaftlicher Produkte im Jahr 1977 gegenüber 1976,
gegliedert nach Produkt gruppen und Mitgliedstaaten (fo)
Insgesamt
Pflanzliche Erzeugnisse
Getreide und Reis
Hackfrüchte
Speisekartoffeln
Zuckerrüben
Frischgemüse
Frischobst
Wein
Saatgut
Blumen und Pflanzen
Sonst, pflanzl. Erzeugnisse
Tiere u. tier. Erzeugnisse
Schlachtvieh
Grossvieh
Rinder
Schweine
Geflügel
Sonstige
Milch
Eier
Sonst. Tiere u. tier. Erzeugn.
EUR 9
+ 8,5
+ 9,0
+ 8,3
- 38,4
- 52,8
+ 1,1
+ 17,1
+ 70,5
+ 16,4
- 10,0
+ 17,9
+ 9,4
+ 8,0
+ 6,8
+ 5,7
+ 8,1
+ 0,7
+ 14,5
+ 11,5
+ 9,8
+ 9,3
+ 16,3
D
- 4,4
- 17,8
- 2,8
- 52,7
- 72,4
+ 1,5
- 8,1
+ 25,7
- 18,1
- 2,6
+ 4,6
- 19,2
+ 1,6
+ 0,9
+ 0,8
+ 3,3
- 1,2
+ 2,2
+ 1,6
+ 2,6
0,0
+ 3,6
F
+ 7,9
+ 7,0
+ 4,2
- 41,6
- 57,4
- 8,2
+ 14,4
+ 72,8
+ 17,0
- 17,8
+ 10,6
- 3,7
+ 8,¿
+ 9,4
+ 9,2
+ 11,0
+ 3,9
+ 10,2
+ 12,1
+ 6,6
+ 15,6
+ 11,9
I
+ 23,9
+ 31,0
+ 19,5
- 16,2
- 26,1
+ 5,8
+ 31,4
+ 82,7
+ 24,7
0,0
+ 47,0
+ 16,4
+ 11,9
+ 7,6
+ 6,2
+ 7,8
- 0,7
+ 12,5
+ 11,7
+ 20,9
+ 11,6
+ 21,5
NL
- 1,4
- 8,3
- 1,6
- 39,8
- 65,3
- 1,2
- 4,6
+ 43,4
- 16,0
+ 12,0
- 2,0
+ 3,0
+ 0,1
- 0,5
+ 6,0
- 5,6
+ 3,0
+ 10,8
+ 7,2
+ 2,1
+ 3,0
B
+ 0,1
- 1,9
+ 1,0
- 19,2
- 31,8
+ 1,8
- 1,6
+ 23,4
- 7,8
+ 11,9
- 11,7
+ 1,4
+ 1,0
+ 1,1
+ 4,0
- 1,2
- 0,8
+ 1,8
+ 2,8
+ 0,5
- 10,3
L
- 0,1
- 8,6
- 0,3
- 75,0
- 75,0
- 40,0
+ 89,6
+ 12,1
+ 4,2
+ 5,2
+ 5,3
+ 10,5
- 3,9
+ 4,9
+ 2,6
+ 8,0
+ 3,1
UK
+ 1,4
- 13,0
- 0,1
- 46,1
- 54,0
+ 3,4
+ 7,5
+ 60,4
- 7,4
+ 9,3
+ 5,9
+ 11,0
+ 10,9
+ 7,8
+ 7,6
+ 3,9
+ 28,8
+ 11,0
+ 9,5
+ 14,2
+ 34,7
IRL
+ 20,6
+ 13,4
+ 24,6
- 8,5
- 31,7
+ 20,4
+ 4,9
+ 83,6
+ 24,6
+ 22,0
+ 18,0
+ 17,9
+ 20,1
+ 17,3
+ 23,2
+ 32,2
+ 14,6
+ 19,8
DK
+ 4,0
- 1,5
+ 5,0
- 28,2
- 68,5
- 12,4
- 16,9
+ 15,4
+ 14,0
+ 6,7
+ 10,6
+ 5,8
+ 1,7
+ 1,5
+ 7,0
- 0,9
+ 8,3
+ 13,0
+ 18,6
+ 7,0
The ECIndex of producer p r i c e s of all agricultural products r o s e on. average throughout the Community
by 8,5 % in 1977 as compared with the previous y e a r . This r a t e of change is considerably lower than
that of the two preceding y e a r s (1976/1975: + 18.3 % and 1975/1974: + 13.7 %), the extremely high figure in 1976 resulting above all from the consequences of the drought in that y e a r .
Within the Community, there a r e l a r g e discrepancies between the individual country r a t e s of change.
As Table 1 shows, these r a t e s range from + 23.9 % (Italy) to 4 . 4 % (FR Germany).
Table 2 shows the change r a t e s of the ECIndex of producer p r i c e s of agricultural products by p r o d
uct g r o u p s . It will be seen that the 1977 p r i c e s for vegetable products in EUR 9 r o s e compared with
1976 by 1 % more than the p r i c e s for animals and animal products even though, after the high price l e v
els of 1976 occasioned by the drought, producer p r i c e s of vegetable products in 1977 fell compared with
1976 in all countries except in Italy, Ireland und F r a n c e . On the other hand, all Member States e x p e r
ienced further i n c r e a s e s in the p r i c e s of animal p r o d u c t s .
Among the change r a t e s of the p r i c e s for vegetable p r o d u c t s , the reductions in the p r i c e s of root c r o p s (especially potatoes for human consumption), were p a r t i c u l a r l y significant. On the other hand, the
a v e r a g e Community i n c r e a s e s in p r i c e s of fresh vegetables (+ 17.1 %), wine (+ 16.4· %) and flowers and ornamental plants (+ 17.9 %) were approximately twice a s high a s for vegetable products a s a w h o l e . B e cause of the poor h a r v e s t , the EUR 9 p r i c e s of fresh fruit showed a 7 0 . 5 % i n c r e a s e in 1977 compared with 1976, a 9 0 % price r i s e in eating apples and p e a r s being mainly r e s p o n s i b l e .
Although tending, in g e n e r a l , to move upwards in 1977 compared with 1976, producer p r i c e s for animals
and animal products were r a t h e r more stable than those for vegetable p r o d u c t s . Pig p r i c e s , except in
I r e l a n d , were p a r t i c u l a r l y steady. Poultry p r i c e s , on the other hand, r e c o r d e d a 14.5 % i n c r e a s e o v e r
the Community a s a whole.
Naturally, these variations in the t r e n d s of a g r i c u l t u r a l producer p r i c e s cannot be considered in i s o lation. In o r d e r to obtain a c l e a r e r p i c t u r e , the differences in the evolution of the purchasing power of
national c u r r e n c i e s (inflation r a t e s ) which in agriculture a r e reflected, amongst other ways, in the
evolution of the purchase p r i c e s of the means of production must a l s o be taken into consideration. In o r d e r , t h e r e f o r e , to supplement a g r i c u l t u r a l producer price s t a t i s t i c s , EUROSTAT hopes to be able
to publish in the foreseeable future the first r e s u l t s of a newly compiled ECIndex of purchase p r i c e s of the means of production.
It should a l s o be noted that the t r e n d s revealed by the ECIndexes of p r o d u c e r p r i c e s of those a g r i c u l t u r a l products subject to Common Market regulations a r e not only the r e s u l t s of the EC agricultural
p r i c e policy but reflect a l s o normal market f o r c e s .
Table l i ECIndex of producer prices of agricultural produote in 1977 as compared with 1976, broken down by Member States
EUR 9 D Ρ I
κ
Β L UK IRL SK
Total
1977X)
210,5 142,4 187,7 284,6 146,5 161,6 156,2 272,5 319,6 192,1
1977 Ï976
+ 8 , 5 * - 4,4 * + 7,9 * + 23,9 *
- 1,4 * + 0,1 *
- 0,1 * + 1 , 4 * + 20,6 # + 4 , 0 *
Vegetable products
1977^
239,2 145,6 202,5 306,3 154,8 193,9 180,9 300,2 306,3 200,1
1977 Î976
+ 9 , 0 *
- 1 7 , 8 <%
+ 7,0 ^ + 31,0 56
-
8
'
3
2
- 1,9 * - 8,6 % - 13,0 i
+ 13,4 * - 1,5 *
Animals and animal product s
1977^
191,0 141,3 175,9 249,2 142,4 147,2 147,2 259,8 322,3 189,7
1977 T976
+ 8,0 $ + 1,6 $ + 8,6 % + 11,9 * + 3,0 <% + 1 , 4 * + 4,2 % + 11,0 % + 22,0 % + 5,8 *
Table 2: Change rates in the EC-Index of producer prices of agricultural products in 1977 as compared with 1976,
broken down by product groups and Member States (%)
Total
1^
Vegetable Products
Cereals and rice
Root crops
Potatoes for consumption
Sugar beet
Fresh vegetables
Fresh fruit
Wine
Seeds
Flowers and plants
Other vegetable products
Anim. and Anim. Products
Anim. for slaughter
Large animals
Cattle
Pigs
Poultry-Others
Milk
Eggs
Other animals and anim.prod.
EUR 9
+ 8,5
+ 9,0
+ 8,3
- 38,4
- 52,8
+ 1,1
+ 17,1
+ 70,5
+ 16,4
- 10,0
+ 17,9
+ 9,4
+ 8,0
+ 6,8
+ 5,7
+ 8,1
+ 0,7
+ 14,5
+ 11,5
+ 9,8
+ 9,3
+ 16,3
D
- 4,4
- 17,8
- 2,8
- 52,7
- 72,4
+ 1.5
- 8,1
+ 25,7
- 18,1
- 2,6
+ 4,6
- 19,2
+ 1,6
+ 0,9
+ 0,8
+ 3,3
- 1,2
+ 2,2
+ 1,6
+ 2,6
0,0
+ 3,6
F
+ 7,9
α- 7,0
+ 4,2
- 41,6
- 57,4
- 8,2
+ 14,4
+ 72,8
+ 17,0
- 17,8
+ 10,6
- 3,7
+ 8,6
+ 9,4
+ 9,2
+ 11,0
+ 3,9
+ 10,2
+ 12,1
+
6,6
+
15,6
+ 11,9
I
+ 23,9
+ 31,0
+ 19,5
- 16,2
- 26,1
+ 5,8
+ 31,4
+ 82,7
+ 24,7
0,0
+ 47,0
+ 16,4
+ 11,9
+ 7,6
+ 6,2
+ 7,8
- 0,7
+ 12,5
+ 11,7
+ 20,9
+ 11,6
+ 21,5
NL
- 1,4
- 8,3
- 1,6
- 39,8
- 65,3
- 1,2
- 4,6
+ 43,4
- 16,0
+ 12,0
- 2,0
+ 3,0
+ 0,1
- 0,5
+ 6,0
- 5,6
+ 3,0
+ 10,8
+ 7,2
+ 2,1
+ 3,0
Β
+ 0,1
- 1,9
+ 1,0
- 19,2
- 31,8
+ 1,8
- 1,6
+ 23,4
- 7,8
+ 11,9
- 11,7
+ 1,4
+ 1,0
+ 1,1
+ 4,0
- 1,2
- 0,8
+ 1,8
+ 2,8
+ 0,5
- 10,3
L
- 0,1
- 8,6
- 0,3
- 75,0
- 75,0
- 40,0
+ 89,6
+ 12,1
+ 4,2
+ 5,2
+ 5,3
+ 10,5
- 3,9
+ 4,9
+ 2,6
+ 8,0
+ 3,1
UK
+ 1,4
-13,0
- 0,1
- 46,1
- 54,0
+ 3,4
+ 7,5
+ 60,4
- 7,4
+ 9,3
+ 5,9
+ 11,0
+ 10,9
+ 7,8
+ 7,6
+ 3,9
+ 28,8
+ 11,0
+ 9,5
+ 14,2
+ 34,7
IRL
+ 20,6
+ 13,4
+ 24,6 ·
- 8,5
- 31,7
+ 20,4
+ 4,9
+ 83,6
+ 24,6
+ 22,0
+ 18,0
+ 17,9
+ 20,1
+ 17,3
+ 23,2
+ 32,2
+ 14,6
+ 19,8
DK
+ 4,0
- 1,5
+ 5,0
- 28,2
- 68,5
- 12,4
- 16,9
+ 15,4
+ 14,0
+ 6,7
+ 10,6
+ 5,8
+ 1,7
+ 1,5
+ 7,0
- 0,9
+ 8,3
+ 13,0
+ 18,6
+ 7,0
- 6
L ' i n d i c e C E d e s p r i x à l a p r o d u c t i o n p o u r t o u s l e s p r o d u i t s a g r i c o l e s a a u g m e n t é e n 1 9 7 7 , d a n s l ' e n s e m b l e
d e l a C o m m u n a u t é , d e 8 , 5 % p a r r a p p o r t à l ' a n n é e p r é c é d e n t e . C e t a u x d e v a r i a t i o n e s t c o n s i d é r a b l e m e n t
i n f é r i e u r à c e u x d e s d e u x a n n é e s a n t é r i e u r e s 0 9 7 6 / 1 9 7 5 : + 1 8 , 3 % e t 1975/1974 : + 1 3 , 7 %), m a i s on n o t e r a q u e l e t a u x d e c r o i s s a n c e e x t r ê m e m e n t é l e v é d e 1976 é t a i t s u r t o u t dû a u x c o n s é q u e n c e s d e l a s é c h e r e s s e d e
c e t t e a n n é e l à .
Au s e i n d e l a C o m m u n a u t é , l e s t a u x d e v a r i a t i o n d e l ' i n d i c e C E d i v e r g e n t f o r t e m e n t d ' u n p a y s à l ' a u t r e .
Comme l e m o n t r e l e t a b l e a u 1, c e s t a u x v a r i e n t d e + 2 3 , 9 % ( I t a l i e ) à 4 , 4 % ( R é p u b l i q u e f é d é r a l e d ' A l l e m a g n e ) .
L e t a b l e a u 2 p r é s e n t e l e s t a u x d e v a r i a t i o n d e l ' i n d i c e C E d e s p r i x à l a p r o d u c t i o n p o u r l e s p r o d u i t s a g r i
c o l e s p a r g r o u p e s d e p r o d u i t s . 11 e n r e s s o r t q u e , p a r r a p p o r t à 1 9 7 6 , l e s p r i x d e s p r o d u i t s v é g é t a u x p o u r
E U R 9 e n 1977 ont a u g m e n t é d e 1 % d e p l u s que l e s p r i x d e s a n i m a u x e t d e s p r o d u i t s a n i m a u x , m ê m e s i , a p r è s l e s
h a u t s n i v e a u x d e p r i x d e 1976 d u s à la s é c h e r e s s e , l e s p r i x à la p r o d u c t i o n p o u r l e s p r o d u i t s v é g é t a u x ont
d i m i n u é e n 1977 p a r r a p p o r t à 1976 d a n s t o u s l e s p a y s sauf e n I t a l i e , e n I r l a n d e e t e n F r a n c e . E n r e v a n c h e ,
l e s p r i x d e s p r o d u i t s a n i m a u x ont s u b i d e n o u v e l l e s h a u s s e s d a n s t o u s l e s p a y s m e m b r e s .
P a r m i l e s t a u x d e v a r i a t i o n d e s p r i x d e s p r o d u i t s v é g é t a u x , i l c o n v i e n t d e s o u l i g n e r e n p a r t i c u l i e r la b a i s
s e d e s p r i x d e s p l a n t e s s a r c l é e s ( n o t a m m e n t , d e s pommes d e t e r r e p o u r l a c o n s o m m a t i o n ) . P a r a i l l e u r s , l e s
t a u x m o y e n s d e h a u s s e a u n i v e a u c o m m u n a u t a i r e d e s p r i x d e s l é g u m e s f r a i s (+ 17,1 %), du v i n (+ 1 6 , 4 50 e t d e s fleurs e t p l a n t e s o r n e m e n t a l e s (+ 1 7 , 9 %) ont é t é e n v i r o n d e u x f o i s s u p é r i e u r s a u t a u x d e h a u s s e d e s p r i x d e l ' e n s e m b l e d e s p r o d u i t s v é g é t a u x . E n 1 9 7 7 , l e s p r i x E U R 9 d e s f r u i t s f r a i s ont a u g m e n t é d e 7 0 , 5 %
p a r r a p p o r t à 1976 e n r a i s o n d e l a m a i g r e r é c o l t e ; c e t t e h a u s s e a é t é s u r t o u t s e n s i b l e d a n s l ' é v o l u t i o n d e s
p r i x d e s p o m m e s e t d e s p o i r e s d e t a b l e (+ 9 0 %).
B i e n q u ' o r i e n t é s e n g é n é r a l à l a h a u s s e e n 1977 p a r r a p p o r t à 1 9 7 6 , l e s p r i x à l a p r o d u c t i o n d e s a n i m a u x e t
d e s p r o d u i t s a n i m a u x ont é t é p l u s s t a b l e s que c e u x d e s p r o d u i t s v é g é t a u x . A l ' e x c e p t i o n d e l ' I r l a n d e , l e p r i x
d e s p o r c s a é t é p a r t i c u l i è r e m e n t s t a b l e . E n r e v a n c h e , l e s p r i x d e la v o l a i l l e ont e n r e g i s t r é u n e h a u s s e d e
1 4 , 5 % d a n s l ' e n s e m b l e d e l a C o m m u n a u t é .
On n e p e u t n a t u r e l l e m e n t p a s a n a l y s e r i s o l é m e n t c e s d i f f é r e n c e s d ' é v o l u t i o n d e s p r i x a g r i c o l e s à la p r o
d u c t i o n . P o u r u n e v i s i o n p l u s c l a i r e , i l faut a u s s i p r e n d r e e n c o n s i d é r a t i o n l e s d i f f é r e n c e s d ' é v o l u t i o n du
p o u v o i r d ' a c h a t d e s m o n n a i e s ( t a u x d ' i n f l a t i o n ) q u i , d a n s l e s e c t e u r a g r i c o l e s e r e f l è t e n t n o t a m m e n t d a n s
l ' é v o l u t i o n d e s p r i x d ' a c h a t d e s m o y e n s de p r o d u c t i o n a g r i c o l e . E n c o n s é q u e n c e , p o u r c o m p l é t e r l a s t a t i
s t i q u e d e s p r i x a g r i c o l e s à la p r o d u c t i o n , E U R O S T A T e s p è r e p o u v o i r b i e n t ô t p r é s e n t e r l e s p r e m i e r s r é
s u l t a t s du n o u v e l i n d i c e C E d e s p r i x d ' a c h a t d e s m o y e n s d e p r o d u c t i o n .
Il y a l i e u d e n o t e r é g a l e m e n t que l e s é v o l u t i o n s q u e r e f l è t e n t l e s i n d i c e s C E d e s p r i x à l a p r o d u c t i o n d e s
p r o d u i t s a g r i c o l e s s o u m i s a u x r é g l e m e n t a t i o n s du m a r c h é commun n e s o n t p a s s e u l e m e n t l e r é s u l t a t d e l a
p o l i t i q u e c o m m u n a u t a i r e d e s p r i x a g r i c o l e s m a i s t r a d u i s e n t a u s s i l e s f o r c e s n o r m a l e s du m a r c h é .
Tableau l i E v o l u t i o n de l ' i n d i c e CE des p r i x à l a p r o d u c t i o n pour l e s p r o d u i t e a g r i c o l e s en 1977 p a r r a p p o r t à 1976 p a r E t a t s membres
EUR 9 D Ρ I I Β L UK IRL DK
T o t a l
1977X )
210,5 142,4 187,7 284,6 146,5 161,6 156,2 272,5 319,6 192,1
1977 Ï976
+ 8 , 5 * 4 , 4 * + 7,9 * + 2 3 , 9 * 1,4 * + 0 , 1 £ 0 , 1 * + 1,4 * + 20,6 * + 4 , 0 *
P r o d u i t s végétaux
I 9 7 71)
239,2 145,6 2 0 2 , 5 3 0 6 , 3 154,8 193,9 180,9 300,2 3 0 6 , 3 200,1
1977 Î976
+ 9 , 0 * 17,8 * + 7 , 0 * +
3l,o
i
- 8,3 * 1,9 * 8 , 6 * 1 3 , 0 i + 13,4 * 1,5 *
Animaux e t p r o d u i t s animaux
I 9 7 71)
191,0 141,3 175,9 249,2 142,4 147,2 147,2 259,8 322,3 189,7
1977 Ï976
+ 8 , 0 $
+ 1,6 * + 8 , 6 %
+ 11,9 * + 3,056 + 1 , 4 * + 4 , 2 * + 1 1 , 0 %
♦ 2 2 , 0 <%
+ 5,8 %
Tableau 2; Taux de variation de l'indice CE des prix à la production pour les produits agricoles en 1977 par rapport
à 1976, par groupes de produits et par Etats membres (>)
Total
X'
Produits Végétaux
Céréales et riz
Plantes sarclées
Pommes de terre de consom.
Betteraves sucrières
Légumes frais
Fruits frais
Vin
Semences
Fleurs et plants
Autres produits végétaux
Anim. et produits animaux
Anim. de boucherie
Gros animaux
Bovins
Porcs
Volailles
Autres
Lait
Oeufs
Autres animaux et prod. anim.
EUR 9
+ 8,5
+ 9,0
+ 8,3
- 38,4
- 52,8
+ 1,1
+ 17,1
+ 70,5
+ 16,4
- 10.0
+ 17,9
+ 9,4
+ 8,0
+ 6,8
+ 5,7
+ 8,1
+ 0,7
+ 14,5
+ 11,5
+ 9,8
+ 9,3
+ 16,3
D
- 4,4
- 17,8
- 2,8
- 52,7
- 72,4
+ 1,5
- 8,1
+ 25,7
- 18,1
- 2,6
+ 4,6
- 19,2
+ 1,6
+ 0,9
+ 0,8
+ 3,3
- 1,2
+ 2,2
+ 1,6
+ 2,6
0,0
+ 3,6
F
+ 7,9
+ 7,0
+ 4,2
- 41,6
- 57,4
- 8,2
+ 14,4
+ 72,8
+ 17,0
- 17,8
+ 10,6
- 3,7
+ 8,6
+ 9,4
+ 9,2
+ 11,0
+ 3,9
+ 10,2
+ 12,1
+
6,6
+
15,6
+ 11,9
I
+ 23,9
+ 31,0
+ 1 9 , 5
- 16,2
- 26,1
+ 5,8
+ 31,4
+ 82,7
+ 24,7
0,0
+ 47,0
+ 16,4
+ 11,9
+ 7,6
+ 6,2
+ 7,8
- 0,7
+ 12,5
+ 11,7
+ 20,9
+ 11,6
+ 21,5
NL
- 1,4
- 8,3
- 1,6
- 39,8
- 65,3
- 1,2
- 4,6
+ 43,4
- 16,0
+ 12,0
- 2,0
+ 3,0
-r 0,1
- 0,5
+ 6,0
- 5,6
+ 3,0
+ 10,8
+ 7,2
+ 2,1
+ 3,0
Β
+ 0,1
- 1,9
+ 1,0
- 19,2
- 31,8
+ 1,8
- 1,6
+ 23,4
- 7,8
+ 11,9
- 11,7
+ 1,4
+ 1,0
+ 1,1
+ 4,0
- 1,2
- 0,8
+ 1,8
+ 2,8
+ 0,5
- 10,3
L
- 0,1
- 8,6
- 0,3
- 75,0
- 75,0
- 40,0
+ 89,6
+ 12,1
+ 4,2
+ 5,2
+ 5,3
+ 10,5
- 3,9
+ 4,9
+ 2,6
+ 8,0
+ 3,1
UK
+ 1,4
- 13,0
- 0,1
- 4 6 , 1
- 54,0
+ 3,4
+ 7,5
+ 60,4
- 7,4
+ 9,3
+ 5,9
+ 11,0
+ 10,9
+ 7,8
+ 7,6
+ 3,9
+ 28,8
+ 11,0
+ 9,5
+ 14,2
+ 34,7
IRL
+ 20,6
+ 13,4
+ 24,6
- 8,5
- 31,7
+ 20,4
+ 4,9
+ 83,6
+ 24,6
+ 22,0
+ 18,0
+ 17,9
+ 20,1
+ 17,3
+ 23,2
+ 32,2
+ 14,6
+ 19,8
DK
+ 4,0
- 1,5
+ 5,0
- 28,2
- 68,5
- 12,4
- 16,9
+ 15,4
+ 14,0
+ 6,7
+ 10,6
+ 5,8
+ 1,7
+ 1,5
+ 7,0
- 0,9
+ 8,3
+ 13,0
+ 18,6
+ 7,0
Nel 1977 l'indice CE dei p r e z z i alla produzione dei prodotti agricoli considerati nel l o r o conplesso ha
r e g i s t r a t o un incremento medio nella Comunità dell' 8,5 % r i s p e t t o all'anno p r e c e d e n t e . Tale t a s s o è
notevolmente inferiore a quello o s s e r v a t o nei due anni precedenti (1976/1975: + 18,3 %, 1975/1974: +13,790, anche se non va dimenticato che il valore estremamente elevato del 1976 è dovuto soprattutto alle c o n s e
guenze della siccità c a r a t t e r i s t i c a di quell'anno.
Nell'ambito della Communità, i t a s s i di variazione dei p r e z z i a g r i c o l i p e r i singoli p a e s i si differenziano
notevolmente fra di l o r o . Come r i s u l t a dalla tabella 1, agli estremi s i trovano l'Italia (+ 23,9 50 e la R e
pubblica federale di Germania ( 4 , 4 %)·
La tabella 2 r i p o r t a i t a s s i di variazione dell'indice CE dei p r e z z i alla produzione dei prodotti a g r i c o l i
suddivisi p e r gruppi di prodotti. Ne r i s u l t a che t r a il 1976 e il 1977 l'aumento dei p r e z z i dei prodotti v e
getali nell'EUR 9 ha superato dell' 1 % l'aumento dei p r e z z i degli animali e dei prodotti animali s e b b e n e , dopo gli elevati livelli di p r e z z o dell'anno 1976, dovuti alla s i c c i t à , i p r e z z i alla produzione dei p r o
dotti vegetali siano diminuiti nel 1977 r i s p e t t o al 1976 in tutti i p a e s i , tranne in I t a l i a , in Irlanda ed in F r a n c i a . D'altra p a r t e , in tutti gli Statimembri si è r e g i s t r a t o u n u l t e r i o r e aumento dei prezzi dei p r o
dotti animali.
F r a i t a s s i di variazione dei p r e z z i p e r i prodotti vegetali, va r i l e v a t o in p a r t i c o l a r e un r i b a s s o dei p r e z
zi nel settore delle piante sarchiate (segnatamente p e r le patate da consumo). P e r c o n t r o , nella Comunità gli aumenti medi dei p r e z z i della v e r d u r a fresca (+ 17,1 %), del vino (+ 16,4 90, dei fiori e delle piante o r namentali ( + 1 7 , 9 %) sono stati a l l ' i n c i r c a il doppio r i s p e t t o all'aumento dei prodotti vegetali nel l o r o com p l e s s o . La s c a r s i t à del raccolto ha provocato nel 1977 un r i n c a r o p a r i al 7 0 , 5 % r i s p e t t o al 1976, dei p r e z zi della frutta fresca p e r l ' E U R 9 , dovuto principalmente all'evoluzione dei p r e z z i subita dalle mele e dalle p e r e da tavola (+ 9 0 %).
Nonostante la tendenza generale ad aumentare nel 1977 r i s p e t t o al 1976, i p r e z z i alla produzione degli
animali e dei prodotti animali si sono dimonstrati alquanto più stabili di quelli dei prodotti vegetali. T r a n
ne che in I r l a n d a , i p r e z z i dei suini si sono rivelati particolarmente s t a b i l i . I p r e z z i del pollame, p e r
c o n t r o , hanno fatto r e g i s t r a r e un aumento del 14,5 % nel complesso della Communità.
Ovviamente tali differenze nell'evoluzione dei p r e z z i agricoli non vanno considerate isolatamente. P e r una valutazione più p r e c i s a del fenomeno vanno p r e s e in considerazione anche le differenze che si r i s c o n
t r a n o nell' andamento del potere d'acquisto delle varie monete nazionali ( t a s s i d'inflazione), che nel s e t t o r e agricolo si ripercuotono in p a r t i c o l a r e sull'evoluzione dei p r e z z i d'acquisto dei mezzi di produzione.
Ad integrazione della statistica dei p r e z z i alla produzione dei prodotti a g r i c o l i , l'EUROSTAT si r i p r o p o ne di pubblicare, in un prossimo futuro, i primi r i s u l t a t i del nuovo indice CE calcolato p e r i p r e z z i d ' a c
quisto dei mezzi di produzione.
Va parimenti o s s e r v a t o che le evoluzioni r e g i s t r a t e dagli indici CE dei p r e z z i alla produzione dei prodotti agricoli soggetti ai regolamenti di organizzazione.comune di mercato non vanno unicamente viste come r i s u l t a t o della politica comunitaria dei prezzi a g r i c o l i , ma rispecchiano a l t r e s ì ' le norma li forze di mercato.
Tabella 1» Andamento d e l l ' i n d i c e CE 1977 dei prezzi a l l a produzione dei prodotti agricoli nel 1977 r i s p e t t o al 1976, r i p a r t i t o t r a i vari Stati membri
EUR 9 D Ρ I Ν
ε
L UK IRL DK
Totale
1977^
210,5 142,4 187,7 284,6 146,5 161,6 156,2 272,5 319,6 192,1
1977 Ï976
+ 8,5 * - 4,4 * + 7,9 * + 23,9 * - 1,4 * + 0,1 * - 0,1 * + 1,4 * + 20,6 <f> + 4,0 *
Prodotti vegetali
I9771)
239,2 145,6 202,5 306,3 154,8 193,9 180,9 300,2 306,3 200,1
1977 Ï976
+ 9,0 %
- 17,8 %
+ 7,0 JE + 31,0 %
- 8 , 3 *
- 1,9 * - 8,6 % - 13,0 % + 13,4 * - 1,5 *
Animali e prodotti animali
1977*'
191,0 141,3 175,9 249,2 142,4 147,2 147,2 259,8 322,3 189,7
1977 1976
+ 8,0 % + 1,6 % + 8,6 <% + 11,9 * + 3,0* + 1,4 * + 4,2 * + 11,0 io + 22,0 $ + 5,8 *