promoting access to White Rose research papers
White Rose Research Online
[email protected]
Universities of Leeds, Sheffield and York
http://eprints.whiterose.ac.uk/
This is an author produced version of a paper published in
GISRUK 2012
Proceedings
White Rose Research Online URL for this paper:
Published paper
Read, S., Bath, P.A., Willett, P and Maheswaran, R., 2012. A pilot inference
study for a beta-Bernoulli spatial scan statistic. Proceedings of the GIS Research
UK 20th Annual Conference (Eds. Duncan Whyatt and Barry Rowlingson).
Volume 1 - Presentations, pages 67-71. Published by The University of
A pilot inference study for a
beta-Bernoulli spatial scan statistic
Simon Read
1, Peter A. Bath
1, Peter Willett
1, Ravi Maheswaran
21
Information School, University of Sheffield,
Regents Court, 211 Portobello,
Sheffield, S1 4DP, UK.2
School of Health and Related Research, University of Sheffield,
Regents Court,
30 Regent Street, Sheffield, S1 4DA, UK.Tel: +44(0)114 222 2630
Summary: The Bernoulli spatial scan statistic is used to detect localised clusters in binary labelled
point data, such as that used in spatial or spatio-temporal case/control studies. We test the inferential capability of a recently developed beta-Bernoulli spatial scan statistic, which adds a beta prior to the original statistic. This pilot study, which includes two test scenarios with 6,000 data sets each, suggests a marked increase in power for a given false alert rate. We suggest a more extensive study would be worthwhile to corroborate the findings. We also speculate on an explanation for the observed improvement.
KEYWORDS: cluster detection, case control study, spatial scan statistic, beta, Bernoulli
1. Introduction
Building upon the multiple scan window procedure of Openshaw et al. (1987), the spatial scan statistic (hereafter SSS) (Kulldorff 1997) is a widely used cluster detection tool in spatial epidemiology, and other fields such as criminology and forestry. Different SSS versions are applicable to different data types: the Bernoulli version is suitable for binary labelled point data, making it ideal for case/control studies.
The SSS has utility in GIS as it identifies statistically significant clusters in spatial, or spatio-temporal data, which may not be obvious to a human observer.
As part of an ongoing Bayesian study we have added a beta prior to create a beta-Bernoulli SSS (hereafter BBSSS). We have also found the BBSSS to have greater spatial accuracy, when tested head-to-head against the Bernoulli SSS on benchmark data. However, due to the differences in the Bayesian and frequentist approaches, we did not directly compare the inferential1 capabilities of the two statistics.
This paper reports the initial findings of a separate study, using the beta-Binomial SSS in a frequentist manner which permits direct comparison between the two statistics using receiver operating characteristic (ROC) curves.
Section 2 outlines the scope of this research, Section 3 briefly outlines the BBSSS and gives details of our study. Section 4 presents results, Section 5 gives concluding thoughts.
2. Research background
1
Case/control studies have a useful role within spatial and spatio-temporal data analysis, a classic example being Diggle’s (1990) spatial analysis of larynx cancer (cases) and lung cancer (controls). A more recent example is Diggle, Rowlingson and Su’s (2005) analysis of emerging gastrointestinal symptom clusters, using historic incidents as controls, and recent incidents as cases.
Various statistical techniques are available for case/control studies, of which the above provide two novel examples. The Bernoulli SSS (Kulldorff 1997) can also be applied to case/control studies, and is freely available as SaTScan (www.satscan.org). However, the Bernoulli is under-researched, compared to other SSS versions (see bibliography in Kulldorff 2010). Developing a Bayesian SSS for areal data, Neill (2006) suggested adding a gamma prior, with parameters estimated from historical data. Investigating a Bayesian SSS for point data, we have added a beta prior to create the BBSSS, and found this to give improved spatial accuracy, using the new Ω measure (Read et al. 2011). This paper extends our study of the BBSSS.
3. Methodology
Section 3.1 describes the BBSSS, Section 3.2 describes the tests used.
3.1 A beta-Bernoulli spatial scan statistic
Study region R has N points, including C cases. Scan window set Z={Z1...Zk...ZK}, where Zk
(⊂
R) has
n points, including c cases. Each point p is an independent Bernoulli trial, where p is a case
with probability q
in(p
∈
Z
k) or q
out(p
∉
Z
k).
The null (no clustering) hypothesis is H0, where qin=qout. The composite alternate hypothesis is HA,
where HA(Zk) assumes Zk is a cluster location, hence qin > qout. If D is the particular distribution of
cases and controls amongst the points, and qin~beta(αin,βin) and qout~beta(αout,βout), then:
)
,
(
)
,
(
)
,
(
)
,
(
))
(
|
(
out out in in out out in in k AB
B
c
C
n
N
c
C
B
c
n
c
B
Z
H
D
P
β
α
β
α
β
α
β
α
+
+
−
+
−
+
−
−
+
=
(1)where B(*,*) is the beta function. The BBSSS is then the probability of the most likely Zk:
[
( | ( ))]
sup
A k Z Z H D P BBSSS k ∀ = (2)Although this was developed for a Bayesian approach, Type I error probability can be obtained using Monte Carlo simulation.
To use the BBSSS, one must find {αin,βin,αout,βout} specific to each Zk. Historic point data is likely to
be used as controls (e.g. Diggle et al. 2005), so historic fitting is inappropriate. Instead we take the odds ratio OR:
)
1
(
)
1
(
in out out inq
q
q
q
OR
−
−
=
(3)as having the same expectation E(OR) and variance V(OR), regardless of cluster size or location. Making a few assumptions, one can estimate {αin,βin,αout,βout} for any given {E(OR),V(OR),N,C,n}
using a one dimensional search over βin with a fairly tight lower bound, incurring little computational
3.2 Benchmark testing
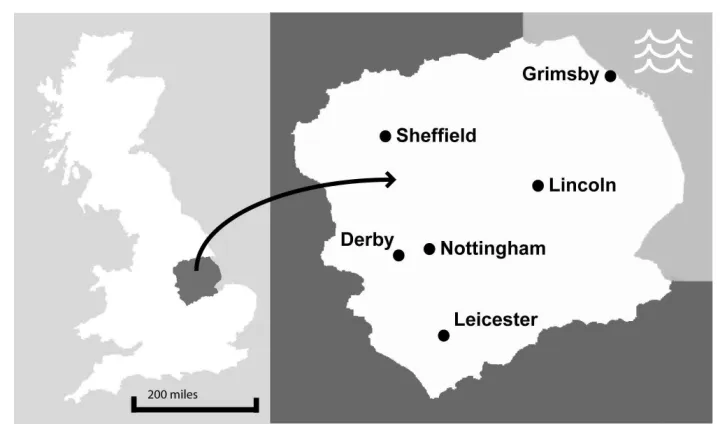
[image:4.595.83.511.214.293.2]Our benchmark data sets resemble those in Read et al. (2010). 12,000 data sets were organised in four batches, see Table 1. CSR (complete spatial randomness) indicates an homogeneous distribution of controls; TRENT an inhomogeneous distribution proportional to the 2001 census population of Trent (Figure 1). H0 batches contain no clusters. Data sets in HA batches contain one randomly located area
[image:4.595.116.477.337.551.2]of Gaussian-shaped multiplicative increased risk, MRR being the maximum relative risk at the cluster’s centre.
Table 1. Description of four batches of data set used in study
Batch code Data sets per batch
Cases per data set
Controls per data set
Injected clusters per dataset
Cluster strength (MRR)
CSR_H0 3000 200 800 None -
CSR_HA 3000 200 800 One 10
TRENT_H0 3000 200 800 None -
TRENT_HA 3000 200 800 One 10
Figure 1. Trent region of UK
Our C++ versions of the BBSSS and Bernoulli SSS were run on each dataset, together with the Bernoulli SSS in SaTScan (v7.0) as a quality check. Three {E(OR),V(OR)} pairings were used: {3.0,0.8}, {5.0,1.0}, {8.0,1.2}.
4. Results
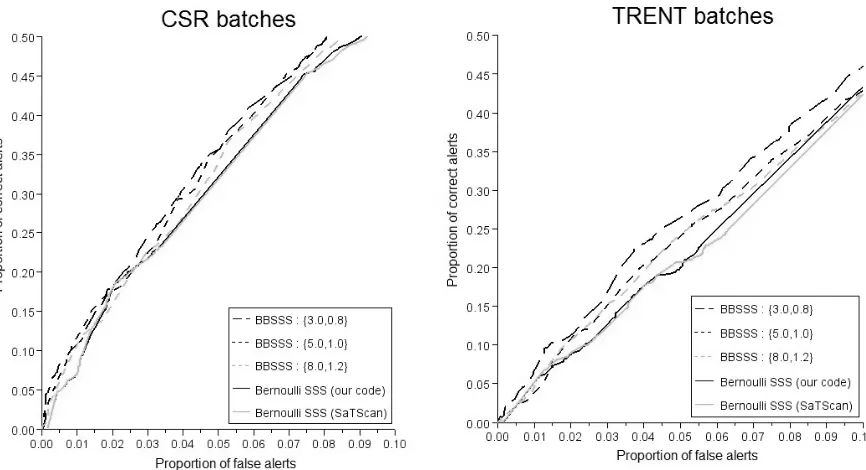
By calculating the proportion of H0 and HA datasets in which a given value of the statistic triggers an
Figure 2. ROC curves (within useful false alert range) for CSR and TRENT batches
Although there is some random noise in these curves, the same pattern is apparent for both CSR and TRENT: for a given false alert rate, the BBSSS appears to have substantially higher power than the Bernoulli SSS, even compared to the bona-fide SaTScan implementation.
5. Conclusion
The findings in Section 4 suggest the addition of a beta prior increases the power of the Bernoulli SSS. However, a more comprehensive set of benchmark tests, using different cluster strength/size, and multiple clusters, would add more weight to these findings; as would an examination of a wider range of values for E(OR) and V(OR). It may also be worth examining other versions of the SSS, to see if they benefit from a prior. This paper therefore represents a pilot study, which we hope to develop into a more authoritative set of benchmark tests.
Assuming these findings are correct, they raise an important question: why should adding a prior increase the detection capability of the SSS? A possible explanation is that the Bernoulli SSS maximises the likelihood of HA(Zk) by assuming qin=c/n, which may promote small artefacts where
c≈n, despite unrealistically high qin. In contrast, with sensible choices for E(OR) and V(OR), the
BBSSS constrains qin within a realistic range, giving less weight to such artefacts. We stress this is
entirely conjecture, and welcome all comments and suggestions on the matter.
6. References
Diggle PJ (1990) A point process modeling approach to raised incidence of a rare phenomenon in the vicinity of a prespecified point. Journal of the Royal Statistical Society, Series A, 153(3), 349-362
Diggle PJ, Rowlingson BS, and Su T-l (2005). Point process methodology for on-line spatio-temporal disease surveillance. Environmetrics, 16(5), 423-434.
Kulldorff M (1997). A Spatial Scan Statistic. Communications in Statistics - Theory and Methods, 26(6), 1481-1496.
Kulldorff M (2010). SaTScanTM user guide for version 9.0. [Online]
Neill DB, Moore AW & Cooper GF (2006). A Bayesian spatial scan statistic. In: Weiss, Y. (ed.),
Advances in Neural Information Processing Systems, pp 1003-1010. MIT Press, Cambridge, MA.
Openshaw S, Charlton M, Mymer C and Craft AW (1987). A mark 1 geographical analysis machine for the automated analysis of point data sets. International Journal of Geographical Information
Systems, 1(4), 335-358.
Read S, Bath PA, Willett P and Maheswaran R (2010). A power-enhanced algorithm for spatial anomaly detection in binary labelled point data using the spatial scan statistic In: Setchi R et al. (ed.)
Knowledge-based intelligent information and engineering systems, part II (Lecture Notes in Artificial Intelligence 6277), pp 163-172. Springer Verlag, Berlin.
Read S, Bath PA, Willett P & Maheswaran R (2011). Measuring the spatial accuracy of the spatial scan statistic. Spatial and Spatio-temporal Epidemiology, 2(2), 69-78.
7. Biographies
Dr. Simon Read is a recent PhD graduate from the Information School at the University of Sheffield.
He is interested in spatial data analysis, and is author of several refereed papers on the spatial scan statistic. Simon is the principal researcher and programmer on this project.
Dr. Peter Bath is a Reader in Health Informatics in the Information School at the University of
Sheffield. He is Director of the Centre for Health Information Management Research (CHIMR). His main research interests and publications are in data mining and analyzing health data, e-Health and information behaviours in health
.
Peter Willett is Professor of Information Science in the Information School at the University of
Sheffield, where he has published very extensively on information retrieval, chemoinformatics and bibliometrics. Current interests include ligand-based virtual screening and the citation-based analysis of academic research performance
.
Dr. Ravi Maheswaran is a Reader in Epidemiology and Public Health in the School of Health and