This is a repository copy of
Electromagnetic transition from the 4$^+$ to 2$^+$ resonance
in $^8$Be measured via the radiative capture in $^4$He+$^4$He
.
White Rose Research Online URL for this paper:
http://eprints.whiterose.ac.uk/75672/
Version: Submitted Version
Monograph:
M. Datar, V., R. Chakrabarty, D., Kumar, Suresh et al. (15 more authors) (2013)
Electromagnetic transition from the 4$^+$ to 2$^+$ resonance in $^8$Be measured via the
radiative capture in $^4$He+$^4$He. Working Paper. Arxiv (Cornell University)
eprints@whiterose.ac.uk https://eprints.whiterose.ac.uk/
Reuse
Items deposited in White Rose Research Online are protected by copyright, with all rights reserved unless indicated otherwise. They may be downloaded and/or printed for private study, or other acts as permitted by national copyright laws. The publisher or other rights holders may allow further reproduction and re-use of the full text version. This is indicated by the licence information on the White Rose Research Online record for the item.
Takedown
If you consider content in White Rose Research Online to be in breach of UK law, please notify us by
arXiv:1305.1094v1 [nucl-ex] 6 May 2013
radiative capture in
4He+
4He
V. M. Datar1,2, D. R. Chakrabarty1
, Suresh Kumar1,2, V. Nanal3
, S. Pastore4
, R. B. Wiringa5
, S. P. Behera1, A. Chatterjee1, D. Jenkins6, C. J. Lister5, E. T. Mirgule1, A. Mitra1, R. G.
Pillay3, K. Ramachandran1, O. J. Roberts6, P. C. Rout1,2, A. Shrivastava1, and P. Sugathan7 1
Nuclear Physics Division, Bhabha Atomic Research Centre, Mumbai 400 085, India
2
Homi Bhabha National Institute, Anushaktinagar, Mumbai 400 094, India
3
Tata Institute of Fundamental Research, Mumbai 400 005, India
4
Department of Physics and Astronomy, University of South Carolina, Columbia, SC 29208, USA
5
Physics Division, Argonne National Laboratory, Argonne, IL 60439, USA
6
Department of Physics, University of York, Heslington, York, Y010 5DD, UK and
7
Inter University Accelerator Centre, New Delhi-110064, India
(Dated: May 7, 2013)
An earlier measurement on the 4+ to 2+
radiative transition in 8
Be provided the first electro-magnetic signature of its dumbbell-like shape. However, the large uncertainty in the measured cross section does not allow a stringent test of nuclear structure models. The present paper reports a more elaborate and precise measurement for this transition, via the radiative capture in the4
He+4 He re-action, improving the accuracy by about a factor of three. Theab initiocalculations of the radiative transition strength with improved three-nucleon forces are also presented. The experimental results are compared with the predictions of the alpha cluster model andab initiocalculations.
PACS numbers: 21.60.De, 23.20.Js, 24.30.Gd, 25.55.-e, 27.20.+n
The nucleus8Be is a classic example of the occurrence
of alpha clustering [1] in nuclei. Its formation from two alpha particles provides an intermediate step in the syn-thesis of 12C [2] from the fusion of three alpha particles
inside the stars. The nucleus is also the stepping stone to understand alpha-clustering in heavier self-conjugate 4n nuclei. The dumbbell-shaped nucleus exhibits rotational states manifested as resonances in the alpha-alpha scat-tering system. The electromagnetic transition between the excited resonant states in 8Be, with spin-parities of
4+ and 2+, was reported earlier [3] in order to provide
a test for its alpha cluster structure. The measurements were made at two beam energies, on and off the 4+
res-onance, by detecting the transition gamma rays in co-incidence with the two alpha particles arising from the decay of the 2+final state. However, the measured cross
section (with an uncertainty of∼33%) and the inferred
reduced electromagnetic transition rate were not precise enough to provide a stringent test for various models like the cluster model [4] andab initioquantum Monte Carlo
model [5]. The uncertainty arose mainly due to the large background of 4.44 MeV gamma rays originating from the interaction of the incident beam with the window of the chamber holding the helium gas target. The present work, using essentially the same method, is aimed at a more accurate measurement and also at more beam en-ergies straddling the 4+resonance. The essential aspects
in this improved measurement are a better pixelisation of the alpha particle detectors, a more efficient and seg-mented gamma ray detector and a better shielding of the gamma rays from the beam-window interaction men-tioned above.
The experiment was carried out using beams of 4He
from the BARC-TIFR Pelletron Linac Facility at TIFR,
FIG. 1: (Color online) Schematic of experimental setup.
Mumbai at energies of 19−29 MeV. The beam current
was about 1 pnA on the target. The schematic of the experimental setup is shown in Fig. 1. Theγ-rays were detected in a BGO detector array with a photopeak effi-ciency of about 23% at Eγ=8 MeV. The array consisted of
38 hexagonal cross section detectors, of length 76 mm and a face to face distance of 56 and 58 mm (in two groups), encased in thin aluminum housing. These were mounted in close packed groups of 19 each placed at∼70 mm above
and below the target. Alpha particles were detected in a 500µm thick, annular, and double sided silicon strip de-tector (SiSD), with 2×16θrings (in left and right halves)
[image:2.612.344.526.329.473.2]2
Eα (MeV)
14 16 18 20
C
o
u
n
ts
0 1000 2000 3000 4000
αααα0 0 0 0 ((((16161616O)
αααα0 0 0 0 ((((12121212C)
αααα1111((((16161616O)
[image:3.612.66.287.49.205.2]αααα1111((((12121212C)
FIG. 2: Alpha particle spectra from the scattering on the mylar target at Ebeam=22.4 MeV for a particular ring of the SiSD. Elastic and inelastic peaks (from the first excited states) from the12
C and16
O targets are indicated.
side were separated by 0.4 mm.
A chamber was designed to mount the strip detector at
∼70 mm from its centre in the forward direction and to
hold the target helium gas (purity>99.9%) at∼0.8 bar
pressure. The gas was isolated from the beam line vac-uum using ∼1 mg/cm2 Kapton foils at the entry and
the exit. The helium gas was filled using a gas handling setup similar to that used earlier [3]. Conical heavymet shields surrounded the Kapton windows in order to shield the BGO detector array from the copious 4.44 MeV γ -rays produced in the excitation of 12
C in the windows. The chamber had the provision to mount a ladder for holding a thick aluminum aperture plate with a hole of 24 mm diameter as well as thin mylar and carbon foils. The aperture plate, when placed at the centre of the tar-get chamber, shielded theα-particles scattered from the Kapton entrance window and limited the effective beam-target interaction zone seen by the SiSD. The aperture diameter and the SiSD distance were decided on the basis of a Monte Carlo simulation [7] to get a reasonable effi-ciency for the detection of two α-particles following the radiative capture and subsequent decay of the final state in 8Be. The typical effective target length was about
20 mm and the efficiency for the 2-αdetection from the final state was about 35%, after including the effect of the various dead zones in the SiSD.
The energy and timing signals of the SiSD were gener-ated from each of the 32θ-rings (divided into two groups of the left and right halves) and 16φ-sectors. The energy signals were sent to voltage sensitive analog-to-digital converters. Each timing signal was fanned out into two paths one being used to generate the overall particle event trigger for left rings, right rings and the sectors using a logical OR condition among the corresponding signals. In the other path the signals were fed to time to digital converters (TDCs) for measuring timing with re-spect to theγ-ray detector array. The anode signal from the photomultiplier of each of the 38 BGO detectors was
also fanned out for measuring the energy deposited by a charge-to-digital converter and for the timing measure-ment with respect to the SiSD using TDCs. A logical OR condition among the 38 signals produced the γ-ray event trigger. The grand event trigger was generated by requiring a fast coincidence between event triggers from the left and right halves of the SiSD θ-rings and that from the BGO-detector array. The data were collected in an event by event mode using a CAMAC based data acquisition (DAQ) system [8]. A 10 Hz pulser signal was fanned out and given to the test input of the three SiSD preamplifiers for estimating the dead time of the DAQ system.
The energy calibration of the SiSD detector was done using elastic and inelastic scattering ofα-particles on12C
and 16O using thin carbon and mylar targets. A
typi-calα-particle energy spectrum is shown in Fig. 2. The energy calibration was performed over the 256 (16×16)
θ−φ pixels. The 4.44 MeV and 6.13 MeV γ-rays from
excited states in12C and16O populated through the
in-elastic α-particle scattering were used to calibrate the BGO detectors. These measurements were made period-ically throughout the experiment in order to track the possible change in the calibrations of theα-particle and
γ-ray detectors. A stability within ∼1% was witnessed
over the period of the experiment.
The data were collected at four beam energies of 19.2, 22.4, 24.7, 28.9 MeV, spanning the 4+
resonance in8
Be, for the integrated beam charges of 81, 90, 125 and 58 pnC, respectively. The data was analyzed to extract the events corresponding to the γ-ray transition to the 2+
-final state in 8Be and the subsequent
2-α decay of the final state. The first condition imposed was the prompt concidence among theγ-ray detector, at least one of the left rings and at least one of the right rings. This en-sured a prompt coincidence also between the left and the right halves of the SiSD. The sector timing was also demanded to be in prompt coincidence with the γ-ray detector with two opposite sectors being simultaneously in coincidence. These conditions emphasized on the re-quired events because the twoα-particles from the decay of the final state are emitted at the azimuthal angles dif-fering by ∼180◦, neglecting the small momentum kick
due to the transition γ-ray. Fig. 3 shows an example of the time spectrum between the BGO detector array and the SiSD at a beam energy of 22.4 MeV showing the prompt time peak. The hit-multiplicities of the left and the right rings were constrained to one for each and the energy deposited in the left and right halves (ELand ER)
were constructed from the energy calibrations of the cor-responding rings. For getting the γ-ray energy Eγ, the
Time (ns)
260 280 300 320 340 360 380 400
C
o
u
n
ts
[image:4.612.348.532.48.245.2]0 20 40 60 80 100
FIG. 3: Example of the time spectrum between the BGO detector array and the SiSD detector rings at Ebeam=22.4 MeV.
both EL and ER being within a lower and a upper limit
(∼1−13 MeV) and (b) the reconstructed total energy and
the total momentum of the twoα-particles being within a proper two dimensional gate. These conditions were guided by the Monte Carlo simulations described below. Fig.4 shows a two dimensional plot of Esum vs Eγ at
the beam energy of 22.4 MeV. A band of events around an Esumof 13 MeV and Eγ of 8 MeV can be clearly
iden-tified. These events arise from the radiative capture of the twoα-particles to the 2+resonance in8Be. A one
di-mensional spectrum of Etot= Esum+ Eγ is generated by
putting one dimensional gates on Esum of 8.8−15.0 MeV
and Eγ of 3.4−10.5 MeV as suggested by simulation
re-sults. Similar Etotspectra were generated at other beam
energies by putting appropriate gates on these quanti-ties. Fig.5 shows the Etot spectra at all the four beam
energies. The peaks in the spectra (not apparent at the highest beam energy which is beyond the extent of the 4+
-resonance), corresponding to theγ-ray transition be-tween the resonances, were used in the calculation of the capture cross sections.
The extraction of radiative capture cross sections re-quires a simulation of the experimental set up using a Monte Carlo code. Such a simulation was done in two parts - one for the detection of the two α-particles and the other for the response of the BGO array to the in-cident γ-rays. The simulation for α-particle detection took into account the extended gas target, the aperture, the angular distribution of the α-particles emitted after the γ-decay and the geometry of the SiSD. The energy losses of the beam and decay α-particles, and the an-gular straggling, were calculated for each event using the SRIM code [9]. The inefficiencies of the SiSD due to gaps between rings and sectors were included. The γ-ray re-sponse was simulated using GEANT3 [10] with the angu-lar distribution from the aligned 4+to the 2+final state
included. For each event, theγ-ray energy was Doppler corrected. The simulated event by event data was writ-ten in a file for analysis by the same program that was used to sort the actual data. The simulated data were
EL + ER (MeV)
8 10 12 14 16 18 20 Eγ
(M
eV
)
[image:4.612.80.274.50.192.2]0 2 4 6 8 10 12
FIG. 4: Two dimensional spectrum between Esum =EL+ER (see text) and Eγ, generated with proper cuts as discussed in the text, at Ebeam=22.4 MeV.
sorted to create the Etot spectrum with the same
condi-tions as used in the case of the actual data. Starting from the N0 events corresponding to the 4+ to 2+ transition
and the subsequent 2-αdecay, the counts N in the same peak regions as shown in Fig.5 were calculated from the simulated spectra to get the overall detection efficiency (N/N0) of the experimental set up. The simulation also
provided the effective target thickness. The capture cross sections were extracted using the integrated beam charge, the target thickness and the detection efficiency. The ef-fectiveα-particle energy<Eα>at each beam energy was
also extracted from the simulation after knowing the in-teraction region and the energy loss of the incident beam in the entrance window and in the target gas up to the interaction region. The spread in the effective energy due to the finite extent of the interaction region was less than 0.14 MeV. The extracted cross sections at the four beam energies and the corresponding effectiveα-particle energies are tabulated in Table I.
TABLE I: Effectiveα-particle energies<Eα>and the radia-tive capture cross sectionsσγextracted from the data at four beam energies (Ebeam).
Ebeam <Eα> σγ
(MeV) (MeV) (nb)
19.2 18.44 102±12
22.4 21.80 149±16
24.7 24.08 131±13
28.9 28.40 <15
The extracted cross sections are plotted against the ef-fectiveα-particle energies in Fig.6. The cross section at the resonance energy is consistent with the earlier mea-surement [3], but with an error of ∼10% as compared
[image:4.612.316.562.580.652.2]4
Etot (MeV)
C
o
u
n
ts 0 5 10 15 20 0 5 10 15 20
0 5 10 15 20
12 14 16 18 20 22 24 26 0
5 10 15 20
Ebeam=19.2 MeV
[image:5.612.93.265.47.368.2]Ebeam=28.9 MeV Ebeam=24.7 MeV Ebeam=22.4 MeV
FIG. 5: One dimensional spectra of Etot =Esum+ Eγ gener-ated with proper cuts at four beam energies.
sections from the cluster model calculation of [4]. The contribution from the partial waves ofl=0, 2, 4 are added incoherently in this plot. The comparison with experi-mental data is good in the rising part of the cross section profile but deviates at higher energies. Whether a differ-ent choice of the α−αpotential along with a coherent
summing over the various partial waves will improve the comparison remains to be seen. It may be mentioned that there is some ambiguity in the choice of the poten-tials giving similar values for the energies and widths of the resonant states of8Be.
Ab initio calculations of the radiative transition
strengths in 8
Be, using realistic two- and three-nucleon interactions, were first reported in [5]. These varia-tional Monte Carlo (VMC) calculations of the electric quadrupole momentQandB(E2) values indicated that the low-lying spectrum of8
Be is well-described by the ro-tation of a common deformed two-αstructure. Recently it has become possible to evaluate electroweak transitions with the more accurate Green’s function Monte Carlo (GFMC) method [11], while improvements in the three-nucleon forces have also been made. We report here new GFMC calculations using the Argonne v18 (AV18)
two-nucleon [12] and Illinois-7 (IL7) three-two-nucleon [13] poten-tials, which give a very nice reproduction of the energy spectrum and other properties of light nuclei in this mass
Eα (MeV)
0 5 10 15 20 25 30
σ γ
(
n
b
)
0 50 100 150
200 Present data
Old data: Ref. 3 Theory: Ref. 4
FIG. 6: (Color online) Extracted capture cross sections plot-ted against the effectiveα-particle energy (see text). The last point indicates the upper bound of the cross section. The continuous line shows the result of a model calculation.
0 0.1 0.2 0.3
-60 -56 -52 -48 -44 -40 -36
E (MeV)
0+
2+
4+
(a)
(b)
0 0.1 0.2 0.3
2.4 2.5 2.6
rp
(fm)
0+
2+ 4+
(c)
0 0.1 0.2 0.3
8 10 12 14 16 18
τ (MeV-1)
〈
E2
〉
(e fm
2)
(2+→ 0+)
(4+→ 2+)
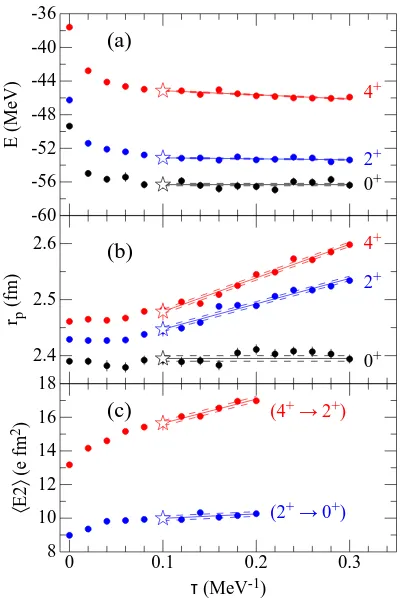
FIG. 7: (Color online) GFMC propagation with imaginary timeτ of the (a) energy, (b) point proton radius, and (c)E2 matrix element; open stars denote the values extracted from the calculation.
range [14].
[image:5.612.322.559.51.216.2] [image:5.612.341.542.289.588.2]challenging because they tend to break up into two sepa-rateα-particles asτincreases. Figure 7 shows the propa-gation with imaginary time of the energies, radii, andE2 matrix elements. In Fig. 7(a), the energies of the states are seen to drop rapidly from the initial VMC energies at τ = 0. The 0+
ground state energy stabilizes and is well-fit by a constant averaged overτ= 0.1−0.3 MeV−1.
The 2+state shows a very subtle decrease over the same
range, while the 4+ state drifts significantly lower; the
energies quoted below are obtained from a linear fit us-ing the value atτ = 0.1 MeV−1, with the Monte Carlo
statistical error augmented by the range of values from
τ = 0.08−0.12 MeV−1. This choice of
τ should encom-pass the bulk of the improvement in the wave functions provided by the GFMC algorithm, before the tendency to dissolve into twoα-particles sets in.
This tendency to dissolution is seen more strongly in the evolution of the point proton radii shown in Fig. 7(b). The 0+ground state radius is flat as a function of
τ, while the 2+ and 4+ states both increase steadily from about
τ= 0.1 MeV−1. The associated electric quadrupole
mo-ments, which are not shown, also increase steadily. Fi-nally, the E2 matrix elements, shown in Fig. 7(c), also increase withτ, the effect being particularly pronounced with the (4+→2+) transition.
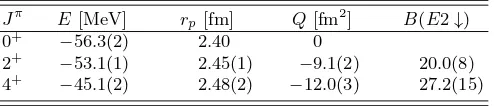
Results for the energies E, point proton radii rp,
electric quadrupole moments Q, and B(E2) transition strengths are given in Table II. The absolute energies of the states are in excellent agreement with experiment. The quadrupole moments andB(E2) values are consis-tent with an intrinsic quadrupole moment Q0 of 32±1
fm2
, which is about∼20% bigger than the original VMC
[image:6.612.318.565.65.118.2]calculation of [5].
TABLE II: GFMC results
Jπ E[MeV] rp[fm] Q[fm2] B(E2↓)
0+
−56.3(2) 2.40 0
2+
−53.1(1) 2.45(1) −9.1(2) 20.0(8)
4+
−45.1(2) 2.48(2) −12.0(3) 27.2(15)
A comparison with theab initiocalculation needs the
present experimental result to be expressed in terms of the B(E2) value for the 4+ to 2+ transition. Whereas
this is not straightforward, an approximate value can be calculated assuming a Breit Wigner form factor for the 4+
resonance and using the experimental cross section at the resonance energy. This gives a partial gamma width Γγ=(0.48±0.05) eV and a B(E2) value of 21±2.3e2f m4.
This is somewhat lower than the calculated value. How-ever, a better comparison will be possible after perform-ing the ab initio calculation as a function of the alpha
particle energy. The present experimental results, be-sides putting the α-cluster structure of 8Be on a firmer
footing, will provide data for testing the future calcula-tions incorporating the reaction and the structure aspects in a seamless manner.
I. ACKNOWLEDGEMENT
We thank the Pelletron crew for delivering the 4He
beam and R. Kujur and M. Pose for their help during the experiment. SP and RBW wish to thank S. C. Pieper for valuable discussions. The work of CJL and RBW is supported by the US DOE Office of Nuclear Physics under Contract No. DE-AC02-06CH11357; the work of SP is supported by the US NSF under Grant No. PHY-1068305.
[1] A. Bohr and B. R. Mottelson, Nuclear Structure, Vol. 2, Benjamin, New York (1975).
[2] F. Hoyle, Astrophys. J. Suppl.1, 121 (1954).
[3] V. M. Datar, Suresh Kumar, D. R. Chakrabarty, V. Nanal, E. T. Mirgule, A. Mitra, and H. H. Oza, Phys. Rev. Lett.94, 122502 (2005).
[4] K. Langanke and C. Rolfs, Zeit. Phys.A324, 307 (1986).
[5] R. B. Wiringa, S. C. Pieper, J. Carlson, and V. R. Pand-haripande, Phys. Rev. C62, 014001 (2000).
[6] obtained from Micron Semiconductor Ltd., United King-dom.
[7] V. M. Datar and Suresh Kumar, Proc. of Int. Symp. on
Nucl. Phys. (Mumbai, 8-12 Dec. 2009)54, 704.
[8] A. Chatterjee, http://www.tifr.res.in/∼pell/lamps [9] J. F. Ziegler, http://www.srim.org
[10] GEANT, version 3.21, CERN program library.
[11] M. Pervin, S. C. Pieper, and R. B. Wiringa, Phys. Rev. C76, 064319 (2007).
[12] R. B. Wiringa, V. G. J. Stoks, and R. Schiavilla, Phys. Rev. C51, 38 (1995).
[13] Steven C. Pieper, AIP Conf. Proc.1011, 143 (2008). [14] S. Pastore, S. C. Pieper, R. Schiavilla, and R. B. Wiringa,