Volume 2011, Article ID 615624,8pages doi:10.1155/2011/615624
Research Article
Low Fat Loss Response after Medium-Term Supervised Exercise in
Obese Is Associated with Exercise-Induced Increase in Food
Reward
Graham Finlayson,
1Phillipa Caudwell,
1Catherine Gibbons,
1Mark Hopkins,
2Neil King,
3and John Blundell
11Biopsychology Group, Institute of Psychological Sciences, University of Leeds, Leeds, UK 2Sport, Health, and Nutrition, Leeds Trinity University College, Leeds, UK
3Institute of Health and Biomedical Innovation, Queensland University of Technology, Brisbane, Australia
Correspondence should be addressed to Graham Finlayson,[email protected]
Received 25 April 2010; Revised 29 June 2010; Accepted 20 August 2010 Academic Editor: Eric Doucet
Copyright © 2011 Graham Finlayson et al. This is an open access article distributed under the Creative Commons Attribution License, which permits unrestricted use, distribution, and reproduction in any medium, provided the original work is properly cited.
Objective. To examine exercise-induced changes in the reward value of food during medium-term supervised exercise in obese
individuals. Subjects/Methods. The study was a 12-week supervised exercise intervention prescribed to expend 500 kcal/day, 5 d/week. 34 sedentary obese males and females were identified as responders (R) or non-responders (NR) to the intervention according to changes in body composition relative to measured energy expended during exercise. Food reward (ratings of liking and wanting, and relative preference by forced choice pairs) for an array of food images was assessed before and after an acute exercise bout. Results. 20 responders and 14 non-responders were identified. R lost 5.2 kg±2.4 of total fat mass and NR lost 1.7 kg±1.4. After acute exercise, liking for all foods increased in NR compared to no change in R. Furthermore, NR showed an increase in wanting and relative preference for high-fat sweet foods. These differences were independent of 12-weeks regular exercise and weight loss. Conclusion. Individuals who showed an immediate post-exercise increase in liking and increased wanting and preference for high-fat sweet foods displayed a smaller reduction in fat mass with exercise. For some individuals, exercise increases the reward value of food and diminishes the impact of exercise on fat loss.
1. Introduction
The capacity for exercise to reduce overweight varies consid-erably between individuals [1–4]. It has been demonstrated that some individuals experience a lower than predicted fat
loss despite >90% adherence to 12 weeks of daily
super-vised exercise [3]. Characterising the determinants of this variability–particularly for the less successful individuals– could help to design more appropriate and effective weight loss strategies. Previously, we reported that weight loss during a program of regular moderate intensity exercise was partly determined by differences in hunger levels experienced during the day [5]. One additional cause of the variability in weight loss could be exercise-induced alterations in the reward value of foods with particular sensory and/or
macronutrient profiles [6]. The extent that changes in food reward go on to influence food choice may then determine
the degree of compensatory eating [7,8]. This relationship
could depend in part on eating behaviour traits of the popu-lation studied such as restrained or disinhibited eating styles [9–12], or it could be influenced by metabolic processes such as substrate oxidation or secretion of gastrointestinal hormones [13–16]. It has been hypothesised that exercise causes a neurochemical response that has a sensitizing action on brain reward systems (e.g., [17]). Another possibility is the deliberate choice of highly palatable, energy-dense foods (e.g., fatty or sweet tasting “treats”) to reward virtuous behavior or regulate changes in mood [18] or stress [19].
predict those who also increased their food intake compared to those whose food intake did not change [20]. However, insufficient data are available on the extent to which exercise-induced changes in food reward influence energy intake through macronutrient selection [6], and there are no data
on the effect of exercise on food reward when exercise is
continued over many weeks. Furthermore, it is unknown
whether the reward value of food has a role in the effect
of medium-term exercise on energy balance and weight loss in overweight and obese individuals. Therefore, the aim of this study was to examine exercise-induced changes in the reward value of food during a medium term (12 weeks), fixed volume schedule of supervised exercise in sedentary overweight and obese individuals. Participants were assessed
using a validated computerised procedure [21, 22] that
measured components of reward (liking, wanting, and food preference) for an array of photographic food images that varied in taste and fat content, before and after an acute bout of exercise. This procedure was repeated at baseline and week 12 of the intervention.
We predicted that acute exercise would cause an increase in liking, wanting, and preference for high-fat food at the beginning of the intervention. Furthermore, we predicted that after 12 weeks of regular exercise, these effects would be attenuated in those who met or exceeded the predicted reduction in fat mass (Responders) compared to those who compensated for the exercise and experienced a lower than predicted reduction in fat mass (Nonresponders).
2. Methods
2.1. Subjects and Recruitment. Forty sedentary overweight and obese but otherwise healthy volunteers (13 males) with
mean body mass index=31.3 (±3.8 kg/m2) and age=39.6
(±10.5 years) participated in this study. Participants were
recruited from those who enrolled on a 12-week exercise programme conducted at the Human Appetite Research Unit, University of Leeds [23]. Therefore, these participants formed a subset of individuals who were taking part in a larger study. The data reported in this study have not been published previously. Participants gave their written consent to take part in the study, and ethical approval was obtained from the Institute of Psychological Sciences Ethics committee.
2.2. Experimental Design. The study examined the acute effects of a bout of exercise on the reward value of food at two time points immediately before and following a 12-week schedule of regular supervised exercise. Participants provided reward measures for 20 photographic images of food presented via computer immediately before and then immediately following a supervised exercise session. The food images varied in taste and macronutrient properties and were categorised according to sensory domain (sweet/non-sweet) and fat/carbohydrate content (high or low). Partici-pants were identified as “responders” or “Nonresponders” to the 12-week intervention according to their final net energy balance which was based on their actual measured changes
in body composition relative to the gross exercise-induced energy expenditure.
2.3. Exercise Protocol. The exercise protocol used in this
study has been described in detail elsewhere [5, 23].
Par-ticipants underwent a 12-week exercise programme that was individually prescribed to expend 500 kcal per session, 5 days per week. Therefore, a total volume of 30,000 kcal energy expenditure was prescribed. All exercise sessions were supervised in the research unit and participants wore a heart rate monitor during each session. The exercise prescription was adjusted for each participant every 4 weeks using
submaximal VO2 maxtests during which indirect calorimetry
was performed. This allowed the exercise prescription to be modified to account for changes in cardiovascular fitness and body weight. The acute exercise bout fixed was intensity submaximal exercise (70% heart rate max) conducted on a stationary exercise bike (Sapilo, Italy). Water was provided at the beginning and end of the session. Energy expenditure of each exercise bout was calculated by comparing heart rate and duration of the session against expenditure values from indirect calorimetry.
2.4. Body Composition. Body weight and body composition (lean and fat mass) were measured using air displacement plethysmography (BodPod, Life Measurement Incorporated, Concord, CA). ADP has been validated against dual energy X-ray absorptiometry (DXA) and is more suitable for frequent repeated measures research [24–27]. Height was measured using a stadiometer (Seca, Leicester, UK).
2.5. Measurement of Reward Value of Food. The reward value of food was measured using a computer-based behavioural procedure called the Leeds Food Preference Questionnaire
(LFPQ) [21, 22]. The LFPQ has demonstrated good
test-retest reliability, both on immediate repetition and after one
week (typicalr=.61–.95). The procedure has proven sensitive
to acute dietary manipulations [28, 29] and single bouts
of exercise in nonobese women [20]. Concurrent validity of the LFPQ with other behavioural paradigms of food reward (i.e., using progressive ratio schedules of reinforce-ment) is satisfactory [30]. In this measure, an array of 20 photographic food images was used within two behavioural tasks administered using experiment generator software (E-prime v.1.2, Psychology Software Tools, ND). The foods were chosen to vary along the dimensions of sensory domain (sweet/non-sweet taste) and fat/carbohydrate content (high
or low by percentage). Half the foods contained >45%
energy as fat while the other half comprised<20%. These
foods were further divided into sweet tasting (i.e., dessert foods) and non-sweet tasting (i.e., salty foods). The foods were controlled between categories for energy and protein content. All foods had been validated in a previous study and rated using 7-point scales on their perceived familiarity, typicality of presentation (most to least typically encoun-tered), and perceived macronutrient and taste properties
[22]. SeeTable 1for details of the food images used in the
Table 1: Photographic food images and food categories used in the procedure.
High-fat non-sweet (HFNS)
Low-fat non-sweet
(LFNS)
High-fat sweet (HFSW)
Low-fat sweet (LFSW)
Salted peanuts Boiled
potatoes Cream cake Fruit salad Potato chips Bread roll Jelly doughnut Fruit candies Mixed olives Pilau rice Milk chocolate Marshmallows French fries Pasta in sauce Shortbread Jelly babies Swiss cheese Crackers Cream slice Rich tea
biscuits
on a 17monitor and measured 150×100 mm2. Participants
responses to the foods in the array were pooled according to categories of high-fat sweet (HFNS), low-fat sweet (LFNS), high-fat sweet (HFSW), and low-fat non-sweet (LFNS). Three separate measures were derived from participants’ evaluation of the foods.
2.6. Expected Liking. Participants were prompted with the question “How pleasant would it be to taste this food now?”. Expected liking measured the conscious feeling of pleasure expected from tasting each food. Foods were rated individually according to a 100 mm visual analogue scale anchored at each end by the statements “not at all” and “extremely”. Scores for each food category were aggregated from the individual ratings with a possible range of 0–100.
2.7. Explicit Wanting. Using the same response format as expected liking, participants responded to the question “How much do you want some of this food now?”. Explicit
wanting measures the conscious desire for each food [21,31].
Scores for each food category ranged from 0 to 100.
2.8. Food Preference. Relative preference for each food cat-egory was measured by a series of “forced choice” pairings of each food image with every alternative food in the array. Participants were presented with 150 such pairs and followed the written instruction in each trial to select the food they “most want to eat now”. Foods were randomly presented on the left or right side of the screen and participants could choose between each pair by pressing the corresponding buttons. The number of choices made in each food category (possible range 0–75) was recorded.
2.9. Statistics. Data were prepared using Microsoft Excel and analysed using SPSS v.16 for Windows. Response to the intervention was assessed by calculating net energy balance from measured energy expenditure during the exercise compared to estimated energy flux from measured changes in body composition. We used the estimation that 1 kg loss of fat mass is equivalent to 9,540 kcal, and 1 kg loss of lean mass is equivalent to 1,100 kcal [32]. Therefore, participants who achieved a negative energy balance which matched or
−75
−50
−25 0 25 50
N
et
energ
y
b
alanc
e
Figure 1: Individual variability in net energy balance after a prescribed volume of 12-week exercise (N = 34).A value below zero (i.e., “Responder”) indicates reduced body mass exceeding measured energy expenditure from the intervention. Values shown are for kcal in “000s”.
exceeded predicted changes in body composition were iden-tified as “Responders”, while those whose actual weight loss was lower than the predicted were identified as
“Nonrespon-ders” (indicating a degree of energy compensation). 2∗2
mixed ANOVA were used to compare anthropometric values at baseline and week 12, within- and between-responder and non-responder groups. Changes in the reward value of food were analysed by separate 3-way mixed ANCOVA
(Responder group∗intervention week∗food category) with
baseline BMI as covariate. Interactions between intervention week, food category, and Responder group were verified by
t-tests with Bonferroni correction to control for type I error.
3. Results
3.1. Identification of Responders and Nonresponders. Thirty six out of 40 participants successfully adhered to the 12-week intervention. Two participants had incomplete LFPQ data. Therefore, data for 34 participants were included in the analyses. The individual variability in energy balance at
week 12 is shown inFigure 1. Based on these participants’ net
energy balance, we identified 20 Responders (6 males) and 14 Nonresponders (7 males) to the intervention. Measured
energy expenditure from exercise did not differ significantly
between groups (P=.40).There was a trend for Responders
to have a greater BMI at baseline compared to
Nonrespon-ders (P < .06).Mean duration of the acute exercise bout was
greater at baseline compared to week 12 (P < .001) and mean
verified expenditure of the bout was less at baseline than
week 12 (P < .01).There were no differences in duration or
expenditure between Responders and Nonresponders. The
characteristics of these groups are presented inTable 2.
−20
−15
−10
−5 0 5 10 15 20
Δ
liking
(mm)
HFNS LFNS HFSW LFSW
Wk 0
(a)
−20 −15 −10 −5 0 5 10 15 20
Δ
liking
(mm)
HFNS LFNS HFSW LFSW
Wk 12
[image:4.600.72.532.70.290.2](b)
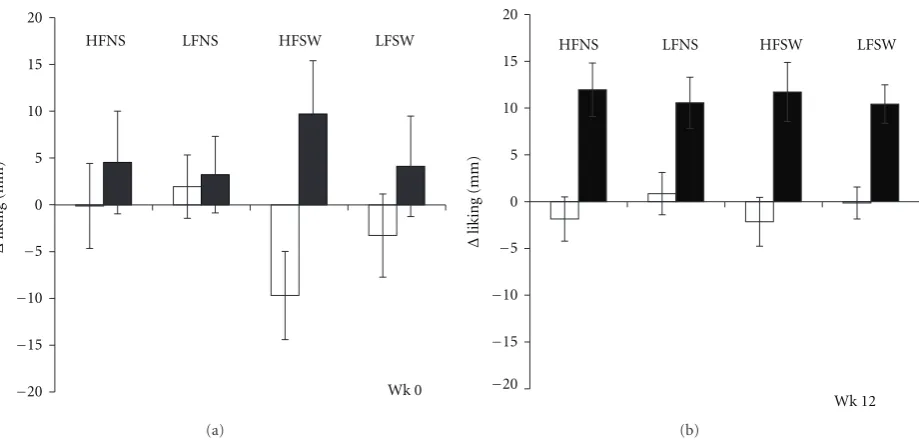
Figure 2: Acute changes in liking for food categories measured before and after a single bout of exercise in Responders () and Nonresponders (). HF: high fat, LF: low fat, NS: non-sweet, SW: sweet.
−20 −15 −10 −5 0 5 10 15 20
Δ
wanting
(mm)
HFNS LFNS HFSW LFSW
Wk 0
(a)
−20 −15 −10 −5 0 5 10 15 20
Δ
wanting
(mm)
HFNS LFNS HFSW LFSW
Wk 12
[image:4.600.66.534.341.541.2](b)
Figure 3: Acute changes in explicit wanting for food categories measured before and after a single bout of exercise in Responders () and Nonresponders (). HF: high fat, LF: low fat, NS: non-sweet, SW: sweet.
3.2. Hedonic Evaluation of Food Images (Leeds Food Pref-erence Questionnaire). Exercise induced changes on the LFPQ are shown for Responders and Nonresponders in Table 3. ANCOVA revealed no effects of baseline BMI or
BMI∗food category interactions on liking, wanting, or food
preference.
3.3. Expected Liking. There was a significant main effect
of Responder group on changes in liking [F(1,31)= 12.2,
P < .001]. Ratings of liking increased after exercise in NR compared to R. This finding was similar across all food categories and at weeks 0 and 12. That is, the increased liking
was independent of food category and after 12 weeks of exercise-induced increase in EE.
3.4. Explicit Wanting. Similar to liking, there was a main
effect of Responder group on explicit wanting [F(1,31) =
6.6,P < .05]. In addition, there was a significant interaction between responder group and food category on changes in
explicit wanting [F(3,93) =6.9,P < .0001]. NR showed a
specific increase in explicit wanting for high-fat sweet foods (P < .01).This effect appeared more pronounced at week
0 (seeFigure 3), however, the three-way interaction did not
−12 −8 −4 0 4 8 12
Δ
pr
efer
enc
e
(fr
eq)
HFNS LFNS HFSW LFSW
Wk 0
(a)
−12 −8 −4 0 4 8 12
Δ
pr
efer
enc
e
(fr
eq)
HFNS LFNS HFSW LFSW
Wk 12
(b)
Figure 4: Acute changes in relative preference for food categories measured before and after a single bout of exercise in Responders () and Nonresponders (). HF: high fat, LF: low fat, NS: non-sweet, SW: sweet.
Table 2: Participant characteristics and changes after medium-term exercise intervention for responders and Nonresponders.
Wk Responder Non-responder P Gender
(male : female) — 6 : 14 7 : 7 .25 Age (years) — 41.4 (8.8) 36.5 (12.3) .19 Weight (kg) 0 91.5 (11.8) 87.4 (10.1) .30 12 85.9 (11.6) 86.5 (10.6) .88 BMI (kg/m2) 0 32.3 (4.3) 29.7 (2.2) .06
12 30.9 (4.25) 29.3 (2.5) .23 VO2 max(mL/kg/min) 0 30.3 (4.1) 29.4 (2.6) .52
12 37.5 (8.7) 35.9 (2.7) .63 Fat mass (kg) 0 32.9 (9.7) 27.4 (5.3) .06 12 27.6 (5.3) 26.0 (6.3) .60 Lean mass (kg) 0 58.5 (9.3) 60.2 (10.2) .63 12 58.4 (9.8) 60.7 (11.0) .54 Duration of exercise
bout (min)
0 58.2 (2.5) 62.7 (2.9) .25 12 53.2 (3.4) 56.5 (4.0) .53 Measured energy
expenditure from exercise bout (kcal)
0 527.0 (29.6) 531.0 (44.9) .89 12 619.1 (33.0) 616.6 (50.1) .94
ΔFat mass (kg) — −5.3 (2.4) −1.4 (1.6) <.0001
ΔLean mass (kg) — −0.2 (2.6) 0.5 (1.8) .45
an increase in wanting for high-fat non-sweet foods was nonsignificant after Bonferroni corrections were applied.
3.5. Food Preference. A significant interaction between Responder group and food category on relative preference
was revealed [F(3,93) = 6.1, P < .0001]. Post hoc tests
confirmed that NR showed an increased preference for
high-fat sweet food (P < .05). Interestingly, these differences
were less pronounced at week 12 compared to week 0. There
was no main effect of responder group on food preference
[F(1,31)=1.6,P=.2].
4. Discussion
The aim of this study was to examine the acute effect of exercise on the reward value of food before and after medium-term regular exercise in overweight and obese
volunteers. In accordance with previous research [23, 33,
34], there was a large individual variability in net energy balance, indicating some degree of compensation for the 12-week exercise-induced energy expenditure in 14 out of 34 participants. This variability were specifically associated with
differences in fat mass. We hypothesised that acute exercise
would increase the reward value of food measured at the outset of the intervention, and that after 12 weeks of regular
supervised exercise these effects would be dependent on
the degree of energy compensation identified by classifying participants as Responders or Nonresponders based on changes in body composition. We found that rather than differences in food reward emerging at week 12, liking and wanting only increased at baseline in the Nonresponders, while the Responders did not change. Furthermore, this pattern of behaviour in both groups was stable over time. These data provide evidence that compensation associated with lower fat loss is associated with the acute effects of exercise on components of food reward involved in appetite regulation and food choice.
Table 3: Acute changes in hedonic evaluation of food measured before and after a single bout of exercise at week 0 and week 12 of a supervised daily exercise intervention.
Responder Non-Responder
Variable Wk HFNS LFNS HFSW LFSW HFNS LFNS HFSW LFSW
ΔLiking 0 −1.2 (4.5) 1.9 (3.4) −9.7 (4.7) −3.3 (4.4) 4.5 (5.4) 3.2 (4.1) 9.7 (5.7) 4.1 (5.4) 12 −1.9 (2.4) 0.9 (2.3) −2.2 (2.6) −0.1 (1.7) 12.0 (2.9) 10.6 (2.7) 11.7 (3.2) 10.4 (2.1)
ΔWanting 0 1.2 (5.2) 6.7 (3.6) −5.4 (3.8) −1.5 (4.1) 8.6 (6.3) 0.1 (4.4) 15.5 (4.6) 7.7 (4.9) 12 −2.0 (2.2) 2.8 (1.9) 1.4 (2.5) 3.1 (1.9) 10.2 (2.7) 3.7 (2.3) 11.4 (3.0) 4.4 (2.3)
ΔPreference 0 −0.8 (1.6) 4.4 (1.6) −5.2 (2.5) 1.4 (2.3) −0.8 (2.0) −1.5 (1.9) 6.3 (3.0) 1.4 (2.8) 12 −1.6 (0.7) 3.2 (1.1) −3.2 (1.1) 1.6 (1.0) −0.1 (2.0) −0.5 (1.3) 0.4 (0.9) 0.2 (1.3)
exception [18]. In a recent review, Elder and Roberts [6]
identified 9 studies investigating the acute effect of exercise
on palatability [8,10,35–41]. The findings from these studies
are not consistent but are generally suggestive of an increase in the perceived pleasantness of foods with a range of sensory and macronutrient profiles. None of the studies found a devaluing effect of exercise on food reward. However, Elder and Roberts concluded that “insufficient data are available on whether changes in food preferences and taste perception influence energy balance through macronutrient selection” (page 1). In the present study, we found that those who did not respond to the exercise intervention as predicted were characterised by differences in the reward value of food after an acute bout of exercise. In addition to increases in expected liking for all food categories independent of taste or fat content, explicit wanting and relative preference for high fat sweet foods were accentuated. These findings are consistent with our previous research on exercise-induced compensatory eating in lean women. Individuals who increased their food intake immediately after 50 minutes of moderate intensity exercise responded faster to images of food, reported greater liking for the food, and had an increased preference toward high-fat sweet food [20].
What mechanisms could account for the differences observed in the reward value of food? One hypothesis can be generated by research proposing that short bouts of exercise may stimulate dopamine release in the nucleus accumbens and striatum [17] or in the ventral tegmental area in response to CRF and cortisol [42]. In rats, it was shown that an acute bout of exercise can exert an enhancing effect on reward (similar to a low dose of an addictive drug) via a sensitizing action [17]. Such neural sensitization is thought to involve changes in levels of delta FosB and dopamine transmission
in the mesolimbic pathway [43,44]. It is possible therefore
that some individuals experience a form of sensitization to food (and visual food cues) induced by exercise. This could be due to repeated associations between exercise and food seeking behavior that have developed into habit.
Exercise-induced changes in food reward could be an
important consideration in the efficacy of exercise as a
means to reduce overweight. In particular, an enhanced motivational drive or wanting for food after exercise may help to explain why some people overcompensate during acute eating episodes [20]. The findings of the present study suggest that some individuals have a predisposition to
com-pensate for exercise-induced energy expenditure as a result of changes in food reward. However, they also demonstrate that exercise does not increase the reward value of food in all individuals and may differ according to the characteristics (e.g., macronutrient and sensory profiles) of the food being assessed. This could explain certain discrepancies in the literature on exercise and food palatability [6].
The effects of exercise on food preference can be linked to both the metabolic and cognitive consequences of engaging in physical activity. Furthermore, these domains interact and their impact on appetite regulation will depend on individual predispositions and susceptibility [45]. Future research should aim to identify the characteristics of those individuals who are most likely to respond to regular exercise
(see, e.g., [46, 47]). Contrary to our expectations, the
differences in liking and wanting immediately after exercise
observed between Responders and Nonresponders were present at baseline and remained after 12 weeks of regular supervised exercise. This suggests that hedonic response after exercise may be an enduring predisposition and one
that could moderate the effect of exercise on fat loss. In
contrast, we observed at week 0 that Nonresponders showed a strong preference for high-fat sweet foods after exercise, but at week 12 the exercise bout had no such effect. With caution, we propose that regular moderate intensity exercise may have a role in correcting the initial preference for high palatability, high-energy food brought about by acute exercise. This interpretation is supported by other 12-week exercise interventions that demonstrate a correcting effect of exercise training on satiety [5] and energy compensation [48].
Some limitations should be noted in the present study. The restricted sample size limited the opportunity to control for numerous background variables or test more complex hypotheses involving combinations of factors. Although water was provided during exercise, we did not measure total consumption; and similarly we did not measure sensations of appetite during the exercise session. Therefore, it was not possible to test whether our results were mediated by
hunger, thirst, or differences in water intake. The study
set of measures regardless of performing exercise. There is evidence to suggest that prior exposure to the sight and smell of food can increase motivation to eat in the short term [49]. Nevertheless, we argue that 500 kcal of moderate intensity exercise is more likely having a greater
modulating effect on food reward in Nonresponders than
mere exposure to food cues. Moreover, we only assessed the reward value of food once before and after exercise at week 0 and week 12. Although the immediate and one-week test-retest reliability of the LFPQ is acceptable, further
verification of the effects we observed would strengthen our
interpretation. Another issue is the use of visual food stimuli to assess hedonic evaluation of food. It is unknown whether we would have demonstrated similar effects if we measured liking or wanting and preference for food using more potent sensory cues such as smell, taste, or ingestion. It is possible that Nonresponders would be more able to inhibit their spontaneous responses to food images compared to smelling or tasting the food presented. Similarly, the exercise-induced reduction in liking and wanting for high-fat sweet food in the responders might be accentuated due to greater aversion to stronger sensory cues.
5. Conclusion
To conclude, overweight and obese individuals who showed an immediate postexercise increase in expected liking for food and more specifically an increased wanting and prefer-ence for high-fat sweet foods displayed a smaller reduction in fat mass with exercise. Increased liking for foods can promote higher compensation of energy intake in response to exercise. This enhanced liking was not attenuated by prolonged exercise (or change in body composition) suggesting that it is a strong habitual trait. This maintenance of a strong positive rating of liking for foods can, apparently, offset subtle changes in preferences among food groups which tend towards a more healthy eating style. For some individuals, exercise increases the reward value of high palatability, high energy food and diminishes the impact of exercise on fat loss. Early identification of this predisposition could help to optimise weight control strategies by augmenting the health benefits of exercise with dietary modification or pharmacotherapy.
Acknowledgment
This research was supported by funding from the Biotech-nology and Biological Sciences Research Council (Grant nos. BBS/B/05079 and BB/G530141/1).
References
[1] S. H. Boutcher and S. L. Dunn, “Factors that may impede the weight loss response to exercise-based interventions,” Obesity
Reviews, vol. 10, no. 6, pp. 671–680, 2009.
[2] J. O. Hill, C. Melby, S. L. Johnson, and J. C. Peters, “Physical activity and energy requirements,” American Journal of Clinical
Nutrition, vol. 62, no. 5, supplement, pp. 1059S–1066S, 1995.
[3] N. A. King, M. Hopkins, P. Caudwell, R. J. Stubbs, and J. E. Blundell, “Individual variability following 12 weeks of supervised exercise: identification and characterization of compensation for exercise-induced weight loss,” International
Journal of Obesity, vol. 32, no. 1, pp. 177–184, 2008.
[4] E. G. Trapp, D. J. Chisholm, J. Freund, and S. H. Boutcher, “The effects of high-intensity intermittent exercise training on fat loss and fasting insulin levels of young women,”
International Journal of Obesity, vol. 32, no. 4, pp. 684–691,
2008.
[5] N. A. King, P. P. Caudwell, M. Hopkins, J. R. Stubbs, E. Naslund, and J. E. Blundell, “Dual-process action of exercise on appetite control: increase in orexigenic drive but improvement in meal-induced satiety,” American Journal of
Clinical Nutrition, vol. 90, no. 4, pp. 921–927, 2009.
[6] S. J. Elder and S. B. Roberts, “The effects of exercise on food intake and body fatness: a summary of published studies,”
Nutrition Reviews, vol. 65, no. 1, pp. 1–19, 2007.
[7] F. Bellisle, “Food choice, appetite and physical activity,” Public
Health Nutrition, vol. 2, no. 3A, pp. 357–361, 1999.
[8] M. Leshem, “The excess salt appetite of humans is not due to sodium loss in adulthood,” Physiology and Behavior, vol. 98, no. 3, pp. 331–337, 2009.
[9] E. Bryant et al., “Psycho-markers of weight loss; the influence of TFEQ Disinhibition and Restraint on the role of exercise in effective weight management,” International Journal of
Obesity, vol. 32, p. S105, 2008.
[10] N. A. King, L. Snell, R. D. Smith, and J. E. Blundell, “Effects of short-term exercise on appetite responses in unrestrained females,” European Journal of Clinical Nutrition, vol. 50, no. 10, pp. 663–667, 1996.
[11] A. Lluch, N. A. King, and J. E. Blundell, “No energy compen-sation at the meal following exercise in dietary restrained and unrestrained women,” British Journal of Nutrition, vol. 84, no. 2, pp. 219–225, 2000.
[12] P. J. Teixeira, S. B. Going, L. B. Sardinha, and T. G. Lohman, “A review of psychosocial pre-treatment predictors of weight control,” Obesity Reviews, vol. 6, no. 1, pp. 43–65, 2005. [13] N. Alm´eras, N. Lavall´ee, J.-P. Despr´es, C. Bouchard, and
A. Tremblay, “Exercise and energy intake: effect of substrate oxidation,” Physiology and Behavior, vol. 57, no. 5, pp. 995– 1000, 1995.
[14] D. R. Broom, R. L. Batterham, J. A. King, and D. J. Stensel, “Influence of resistance and aerobic exercise on hunger, circulating levels of acylated ghrelin, and peptide YY in healthy males,” American Journal of Physiology, vol. 296, no. 1, pp. R29–R35, 2009.
[15] N. A. King, V. J. Burley, and J. E. Blundell, “Exercise-induced suppression of appetite: effects on food intake and implications for energy balance,” European Journal of Clinical
Nutrition, vol. 48, no. 10, pp. 715–724, 1994.
[16] M. S. Westerterp-Plantenga, C. R. T. Verwegen, M. J. W. Ijedema, N. E. G. Wijckmans, and W. H. M. Saris, “Acute effects of exercise or sauna on appetite in obese and nonobese men,” Physiology and Behavior, vol. 62, no. 6, pp. 1345–1354, 1997.
[17] B. L. Lett, V. L. Grant, and L. L. Gaborko, “A small amount of wheel running facilitates eating in nondeprived rats,”
Behavioral Neuroscience, vol. 110, no. 6, pp. 1492–1495, 1996.
[18] K. L. Schneider, B. Spring, and S. L. Pagoto, “Exercise and energy intake in overweight, sedentary individuals,” Eating
Behaviors, vol. 10, no. 1, pp. 29–35, 2009.
chocolate cue. An experimental study,” Appetite, vol. 52, no. 1, pp. 155–160, 2009.
[20] G. Finlayson, E. Bryant, J. E. Blundell, and N. A. King, “Acute compensatory eating following exercise is associated with implicit hedonic wanting for food,” Physiology and Behavior, vol. 97, no. 1, pp. 62–67, 2009.
[21] G. Finlayson, N. King, and J. Blundell, “The role of implicit wanting in relation to explicit liking and wanting for food: implications for appetite control,” Appetite, vol. 50, no. 1, pp. 120–127, 2008.
[22] G. Finlayson, N. King, and J. E. Blundell, “Is it possible to dissociate ’liking’ and ’wanting’ for foods in humans? A novel experimental procedure,” Physiology and Behavior, vol. 90, no. 1, pp. 36–42, 2007.
[23] N. A. King, M. Hopkins, P. Caudwell, R. J. Stubbs, and J. E. Blundell, “Individual variability following 12 weeks of supervised exercise: identification and characterization of compensation for exercise-induced weight loss,” International
Journal of Obesity, vol. 32, no. 1, pp. 177–184, 2008.
[24] S. D. Ball and T. S. Altena, “Comparison of the Bod Pod and dual energy X-ray absorptiometry in men,” Physiological
Measurement, vol. 25, no. 3, pp. 671–678, 2004.
[25] G. F. Maddalozzo, B. J. Cardinal, and C. M. Snow, “Concurrent validity of the BOD POD and dual energy X-ray absorp-tiometry techniques for assessing body composition in young women,” Journal of the American Dietetic Association, vol. 102, no. 11, pp. 1677–1679, 2002.
[26] G. Harris et al., “BodPod approximates corrected DEXA values more closely than BIA in overweight and obese adults,” FASEB
Journal, vol. 21, no. 5, p. 679.2, 2007.
[27] T. P. Ballard, L. Fafara, and M. D. Vukovich, “Comparison of Bod Podand DXA in female collegiate athletes,” Medicine
and Science in Sports and Exercise, vol. 36, no. 4, pp. 731–735,
2004.
[28] E. Verschoor et al., “Effects of an acute alpha-lactalbumin manipulation on mood and food hedonics in high- and low-trait anxiety individuals,” British Journal of Nutrition, vol. 104, no. 4, pp. 595–602, 2010.
[29] S. Griffioen-Roose, M. Mars, G. Finlayson, J. E. Blundell, and C. De Graaf, “Satiation due to equally palatable sweet and savory meals does not differ in normal weight young adults,”
Journal of Nutrition, vol. 139, no. 11, pp. 2093–2098, 2009.
[30] S. Griffioen-Roose et al., “Measuring food reward and the transfer effect of sensory specific satiety,” in Proceedings of the
the British Feeding and Drinking Group Annual Conference, R.
C. Havermans, Ed., Appetite, Maastricht, The Netherlands, 2010.
[31] K. C. Berridge, T. E. Robinson, and J. W. Aldridge, “Dissecting components of reward: ‘liking’, ‘wanting’, and learning,”
Current Opinion in Pharmacology, vol. 9, no. 1, pp. 65–73,
2009.
[32] M. Elia, “Energy expenditure in the whole body,” in Energy
Metabolism, Tissue Determinants and Cellular Collaries, J. M.
T. Kinney, Ed., pp. 19–49, Ravens Press, New York, NY, USA, 1992.
[33] N. D. Barwell, D. Malkova, M. Leggate, and J. M. R. Gill, “Individual responsiveness to exercise-induced fat loss is associated with change in resting substrate utilization,”
Metabolism, vol. 58, no. 9, pp. 1320–1328, 2009.
[34] J. E. Donnelly, E. P. Kirk, D. J. Jacobsen, J. O. Hill, D. K. Sullivan, and S. L. Johnson, “Effects of 16 mo of verified, supervised aerobic exercise on macronutrient intake in over-weight men and women: the Midwest Exercise Trial,” American
Journal of Clinical Nutrition, vol. 78, no. 5, pp. 950–956, 2003.
[35] K. M. Appleton, “Changes in the perceived pleasantness of fluids before and after fluid loss through exercise: a demon-stration of the association between perceived pleasantness and physiological usefulness in everyday life 188,” Physiology &
Behavior, vol. 83, no. 5, pp. 813–819, 2005.
[36] T. Horio, “Effect of physical exercise on human preference for solutions of various sweet substances,” Perceptual and Motor
Skills, vol. 99, no. 3, part 1, pp. 1061–1070, 2004.
[37] T. Horio and Y. Kawamura, “Influence of physical exercise on human preferences for various taste solutions,” Chemical
Senses, vol. 23, no. 4, pp. 417–421, 1998.
[38] N. A. King, K. Appleton, P. J. Rogers, and J. E. Blundell, “Effects of sweetness and energy in drinks on food intake following exercise,” Physiology and Behavior, vol. 66, no. 2, pp. 375–379, 1999.
[39] A. Lluch, N. A. King, and J. E. Blundell, “Exercise in dietary restrained women: no effect on energy intake but change in hedonic ratings,” European Journal of Clinical Nutrition, vol. 52, no. 4, pp. 300–307, 1998.
[40] A. Takamata, G. W. Mack, C. M. Gillen, and E. R. Nadel, “Sodium appetite, thirst, and body fluid regulation in humans during rehydration without sodium replacement,” American
Journal of Physiology, vol. 266, no. 5, part 2, pp. R1493–R1502,
1994.
[41] D. A. Thompson, L. A. Wolfe, and R. Eikelboom, “Acute effects of exercise intensity on appetite in young men,” Medicine and
Science in Sports and Exercise, vol. 20, no. 3, pp. 222–227, 1988.
[42] C. Bergh and P. S¨odersten, “Anorexia nervosa, self-starvation and the reward of stress,” Nature Medicine, vol. 2, no. 1, pp. 21–22, 1996.
[43] M. Werme, C. Messer, L. Olson et al., “ΔFosB regulates wheel running,” Journal of Neuroscience, vol. 22, no. 18, pp. 8133– 8138, 2002.
[44] T. E. Robinson and K. C. Berridge, “The neural basis of drug craving: an incentive-sensitization theory of addiction,” Brain
Research Reviews, vol. 18, no. 3, pp. 247–291, 1993.
[45] N. R. Lenard and H.-R. Berthoud, “Central and peripheral regulation of food intake and physical activity: pathways and genes,” Obesity, vol. 16, supplement 3, pp. S11–S22, 2008. [46] E. Bryant et al., “Psycho-markers of weight loss; the roles of
TFEQ disinhibition and restraint in exercise-induced weight management,” International Journal of Eating and Weight
Disorders. under review.
[47] P. J. Teixeira, S. B. Going, L. B. Houtkooper et al., “Pretreat-ment predictors of attrition and successful weight manage-ment in women,” International Journal of Obesity, vol. 28, no. 9, pp. 1124–1133, 2004.
[48] C. Martins, B. Kulseng, N. A. King, J. J. Holst, and J. E. Blundell, “The effects of exercise-induced weight loss on appetite-related peptides and motivation to eat,” Journal of
Clinical Endocrinology and Metabolism, vol. 95, no. 4, pp.
1609–1616, 2010.