Alcohol Consumption, Mediating
Biomarkers, and Risk of Type 2
Diabetes Among Middle-Aged Women
The Harvard community has made this
article openly available.
Please share
how
this access benefits you. Your story matters
Citation
Beulens, Joline W. J., Eric B. Rimm, Frank B. Hu, Henk F. J.
Hendriks, and Kenneth J. Mukamal. 2008. Alcohol Consumption,
Mediating Biomarkers, and Risk of Type 2 Diabetes Among
Middle-Aged Women. Diabetes Care 31(10): 2050-2055.
Published Version
doi:10.2337/dc08-0814
Citable link
http://nrs.harvard.edu/urn-3:HUL.InstRepos:4889578
Terms of Use
This article was downloaded from Harvard University’s DASH
repository, and is made available under the terms and conditions
applicable to Other Posted Material, as set forth at
http://
Alcohol Consumption, Mediating
Biomarkers, and Risk of Type 2 Diabetes
Among Middle-Aged Women
JOLINEW.J. BEULENS,PHD1,2 ERICB. RIMM,SCD2,3,4 FRANKB. HU,PHD2,3,4
HENKF.J. HENDRIKS,PHD5 KENNETHJ. MUKAMAL,MD2,6
OBJECTIVE— The purpose of this study was to investigate whether adiponectin concentra-tions and biomarkers of inflammation, endothelial dysfunction, and insulin resistance mediate the association between alcohol consumption and diabetes.
RESEARCH DESIGN AND METHODS— In a nested case-control study of 705 women with incident diabetes and 787 matched control subjects, we examined the adjusted relationship between baseline alcohol consumption and risk of diabetes before and after adjustment for markers of inflammation/endothelial dysfunction (C-reactive protein, vascular cell adhesion molecule-1, intercellular adhesion molecule-1, E-selectin, tumor necrosis factor-␣receptor 2, and interleukin-6), fasting insulin, and adiponectin concentrations.
RESULTS— Alcohol consumption was associated with a decreased risk of diabetes (odds ratio per 12.5 g/day increment in alcohol use 0.58; 95% CI 0.49 – 0.69;P⬍0.001). Adjustment for BMI attenuated the association by 25%. None of the markers of inflammation or fasting insulin appeared to account for⬎2% of the observed relationship. Without adjustment for BMI, these biomarkers individually explained slightly more of the association, but⬍10% in all cases. Adiponectin accounted for 25% in a fully adjusted model and for 29% without adjustment for BMI.
CONCLUSIONS— In this population of women, alcohol consumption was inversely asso-ciated with risk of type 2 diabetes. Adiponectin appeared to be a mediator of this association, but circulating biomarkers of inflammation, endothelial dysfunction, and fasting insulin did not explain this association. These results suggest that further research is needed into the potentially mediating roles of other biomarkers affected by alcohol consumption.
Diabetes Care31:2050–2055, 2008
M
oderate alcohol consumption is associated with a decreased risk of both coronary heart disease and type 2 diabetes compared with abstaining and heavier drinking (1,2). Approxi-mately 50% of the association with coro-nary heart disease (CHD) appears to be attributable to an increase in HDL choles-terol (3), and fibrinogen and glycemia may account for a large part of the remain-der (4).The underlying mechanism for the lower risk of type 2 diabetes among mod-erate drinkers is not entirely clear, but several factors may be involved. First, high concentrations of markers of both inflammation and endothelial dysfunc-tion are directly related to risk of type 2 diabetes (5,6), and moderate alcohol con-sumption is associated with lower levels of markers of inflammation and endothe-lial dysfunction in both cross-sectional
and intervention studies (7,8). Second, a randomized controlled trial (9) and cross-sectional studies (10) have shown im-proved insulin sensitivity with moderate alcohol consumption, but results of stud-ies are not entirely consistent (11). These changes in insulin sensitivity could be mediated by an increase in adiponectin concentrations that has been consistently shown in several observational and ran-domized studies (11,12). Finally, BMI is the most important predictor of type 2 diabetes, particularly among women (13). Cross-sectional studies and a recent prospective study suggest that moderate alcohol consumption may be associated with lower BMI and less weight gain over time among women but not men (14,15). Whether and to what extent markers of inflammation, endothelial dysfunction, fasting insulin, and adiponectin concen-trations explain the inverse association between moderate alcohol consumption and type 2 diabetes has not been investi-gated to date. To address these questions, we investigated these relations in a nested case-control study from the Nurses’ Health Study. Previous reports from this study have shown that moderate alcohol consumption, BMI, markers of inflamma-tion and endothelial dysfuncinflamma-tion, and fasting insulin are all associated with the risk of type 2 diabetes (5,6) in expected directions.
RESEARCH DESIGN AND METHODS— The Nurses’ Health Study began in 1976, when 121,700 fe-male nurses aged 30 –55 years responded to a questionnaire of health-related infor-mation. Questionnaires have been ad-ministered biennially to update health information and identify new cases of dis-ease. During 1989 –1990, 32,826 women free of diagnosed diabetes, coronary heart disease, stroke, or cancer provided blood samples. Women providing blood sam-ples had a higher prevalence of obesity and family history of diabetes and a lower prevalence of current smoking but were otherwise similar to women not providing blood. By 2000, 714 of these women had a confirmed diagnosis of type 2 diabetes. ● ● ● ● ● ● ● ● ● ● ● ● ● ● ● ● ● ● ● ● ● ● ● ● ● ● ● ● ● ● ● ● ● ● ● ● ● ● ● ● ● ● ● ● ● ● ● ● ●
From the1Julius Center for Health Sciences and Primary Care, University Medical Center Utrecht, Utrecht, the
Netherlands; the2
Department of Nutrition, Harvard School of Public Health, Boston, Massachusetts; the
3Department of Epidemiology, Harvard School of Public Health, Boston, Massachusetts; the4Channing
Lab-oratory, Department of Medicine, Brigham and Women’s Hospital, and Harvard Medical School, Boston, Massachusetts;5Business Unit Biosciences, TNO Quality of Life, Zeist, the Netherlands; and the6Division of
General Medicine and Primary Care, Beth Israel Deaconess Medical Center, Boston, Massachusetts. Corresponding author: Joline W.J. Beulens, j.beulens@umcutrecht.nl.
Received 29 April 2008 and accepted 10 July 2008.
Published ahead of print at http://care.diabetesjournals.org on 15 July 2008. DOI: 10.2337/dc08-0814. © 2008 by the American Diabetes Association. Readers may use this article as long as the work is properly
cited, the use is educational and not for profit, and the work is not altered. See http://creativecommons. org/licenses/by-nc-nd/3.0/ for details.
The costs of publication of this article were defrayed in part by the payment of page charges. This article must therefore be hereby marked “advertisement” in accordance with 18 U.S.C. Section 1734 solely to indicate this fact.
Control subjects providing blood samples were matched to diabetes case patients by year of birth, date of blood draw, race, and fasting status at blood draw. From 1990 until 1996, two control subjects were matched to each case patient on the basis of the above factors. One of the two control subjects was also matched accord-ing to BMI within 1 kg/m2. After 1996, one control subject was matched to each case patient on the basis of the same char-acteristics, and another control subject was matched on these characteristics and BMI to each of the case patients in the top decile of the BMI distribution. Women with missing information for alcohol con-sumption and markers of inflammation and endothelial dysfunction were ex-cluded, leaving 787 control subjects and 705 case patients for analysis.
Subjects provided written informed consent. The studies were approved by the institutional review board of Partners HealthCare System, Boston, MA.
Ascertainment of diabetes
Incident cases of type 2 diabetes were identified by self-report and confirmed by a validated supplementary questionnaire detailing symptoms, diagnostic labora-tory test results, and diabetes treatment. The diagnosis was confirmed if partici-pants reported at least one of the follow-ing on the questionnaire: treatment with either insulin or an oral hypoglycemic agent, at least one classic symptom of di-abetes (for instance, polyuria, polydipsia, or weight loss) plus an elevated plasma glucose level, or an elevated plasma glu-cose level on at least two occasions in the absence of symptoms. Elevated plasma glucose was defined as at least 140 mg/dl (ⱖ7.8 mmol/l) fasting, or at least 200 mg/dl (ⱖ11.1 mmol/l) nonfasting, or at least 200 mg/dl (ⱖ11.1 mmol/l) atⱖ2 h after an oral glucose tolerance test for cases diagnosed before 1998; for cases di-agnosed in 1998 and later, the fasting plasma glucose threshold was lowered to
ⱖ126 mg/dl (ⱖ7.0 mmol/l). The validity of self-reported diabetes has been con-firmed with medical record review in a sample of 62 participants.
Assessment of alcohol consumption
We assessed average alcohol consump-tion within a semiquantitative food fre-quency questionnaire including separate items for beer, white wine, red wine, and liquor (16). We specified standard por-tions as a glass, bottle, or can of beer; a
4-ounce glass of wine; and a shot of li-quor. For each beverage participants were asked to estimate their average consump-tion over the past year. We calculated eth-anol intake by multiplying the frequency of consumption of each beverage by the alcohol content of the specified portion size (12.8 g for beer, 11.0 g for wine, and 14.0 g for liquor) and summing across beverages. We used alcohol consumption reported on the food frequency question-naire in 1990 and replaced information with data from 1986 onward when miss-ing data occurred.
We previously assessed the validity of alcohol consumption estimated with the food frequency questionnaire against in-take from two 1-week dietary records col-lected ⬃6 months apart among 173 women residing in eastern Massachusetts; the Spearman correlation coefficient be-tween these two measures was 0.90. Esti-mated average alcohol intake was also correlated with HDL cholesterol to an expected degree (r ⫽ 0.40), and HDL cholesterol levels among drinkers were
⬃15–20% higher than those among nondrinkers (17).
Assessment of lifestyle factors
Lifestyle factors were assessed using ques-tionnaires, including smoking, body weight, physical activity, family history of diabetes, menopausal status, and use or nonuse of postmenopausal hormone therapy. Reported weights have been shown to correlate well with measured weights (r⫽0.96), and the assessment of physical activity was previously validated. We obtained energy intake, glycemic load, coffee consumption, and energy-adjusted intakes of saturated fat, trans fatty acids, polyunsaturated fatty acids, and dietary fiber from the semiquantita-tive food frequency questionnaire (16).
Laboratory procedures
Women were sent a phlebotomy kit with instructions to return the sample by over-night mail with a frozen water bottle. On arrival, samples were processed and fro-zen in liquid nitrogen until analysis; 97% arrived within 26 h of phlebotomy. Qual-ity control samples were routinely frozen with study samples; the long-term stabil-ity of plasma samples collected and stored under this protocol has been docu-mented. Study samples were analyzed in randomly ordered case-control pairs to further reduce systematic bias and inter-assay variation.
Levels of E-selectin, intercellular ad-hesion molecule-1 (ICAM-1), and vascu-lar cell adhesion molecule-1 (VCAM-1) were measured by a commercial enzyme-linked immunosorbent assay (ELISA) (R&D Systems, Minneapolis, MN). These biomarkers are released during endothe-lial cell activation and correlate (r ⫽ 0.04 – 0.58) with endothelial dysfunction assessed directly by brachial artery flow-mediated vasodilatation or microcircula-tion iontophoresis methods (18). C-reactive protein (CRP) levels were mea-sured via a high-sensitivity latex-enhanced immunonephelometric assay (Dade Behring, Newark, DE). Interleu-kin-6 (IL-6) was measured by a quantita-tive sandwich enzyme immunoassay technique (Quantikine HS Immunoassay kit), and tumor necrosis factor-␣receptor 2 (TNF-R2) levels were measured by an ELISA kit using immobilized monoclonal antibody to human TNF-R2 (Genzyme, Cambridge, MA). Insulin levels were measured using a double antibody system with⬍0.2% cross-reactivity between in-sulin and its precursors (Linco Research, St. Louis, MO). C-peptide was measured using antiserum M1230 in an alcohol pre-cipitation nonequilibrium assay. In the C-peptide assay, proinsulin has 10% cross-reactivity, but its contribution to C-peptide immunoreactivity is⬍0.5%. Pro-insulin-like material was measured using antiserum 11E in a nonequilibrium assay with second-antibody precipitation. In the proinsulin assay, human proinsulin cross-reacts 100%, des-31,32 proinsulin cross-reacts 38%, and des-64,65 proinsu-lin cross reacts 10%, whereas insuproinsu-lin and C-peptide each cross-react ⬍0.001%. The coefficients of variation were 3.8% for CRP, 5.9% for IL-6, 6.2% for TNF-R2, 6.6% for E-selectin, 3.6% for ICAM-1, 8.5–9.8% for VCAM-1, 3.5–11.7% for fasting insulin, 1.9 –3.0% for A1C, 2–7% for C-peptide, and 6 –9% for proinsulin. Adiponectin was determined by ELISA (ALPCO Diagnostics, Salem, NH). The sensitivity of this assay is 0.04 ng/ml, and the recovery rate was 99 –103%.
Statistical analysis
Analyses were performed in three sepa-rate groups that had valid information on a specific set of potential mediating bio-markers: the main dataset for markers of inflammation and endothelial dysfunc-tion (case patients 705; control subjects 787) and three additional sets for fasting insulin (case patients 476; control
jects 732) and adiponectin concentra-tions (case patients 694; control subjects 982). In the main dataset individual markers of inflammation and endothelial dysfunction were missing for no more than 4% of the sample. To maintain con-sistent sample sizes across markers, these missing values were imputed using the median of the sample. An inflammation score was created by summing the quar-tiles of CRP, IL-6, E-selectin, and TNF-R2 to assess their combined effect.
We examined the relationships of al-cohol consumption, biomarkers, and risk of type 2 diabetes with a three-step pro-cess. First, we estimated the independent association of alcohol consumption with risk using multivariable unconditional lo-gistic regression models. In these models, we adjusted for matching and confound-ing factors, includconfound-ing BMI (quintiles), and for smoking (never, former, or current smokers of 1–14, 15–34, or ⱖ35 ciga-rettes/day), family history of diabetes in a first-degree relative (present or not),
physical activity (five categories), post-menopausal hormone therapy (premeno-pausal, never, past, or current user), energy intake, coffee consumption, and energy-adjusted intakes of saturated fat, transfatty acids, polyunsaturated fatty ac-ids, glycemic load, and dietary fiber (each in quintiles).
Second, we added biomarkers to the model (as linear terms) to assess the per-cent change of the-coefficient (the log of the odds ratio [OR]) for alcohol con-sumption; these coefficients are scaled linearly. Inclusion of a mediating factor would be expected to attenuate the
-coefficient related to alcohol intake. Third, because BMI could act as both a confounder and a mediator of the effects of alcohol on diabetes (i.e., obesity could affect alcohol consumption and vice versa), we repeated our analyses without BMI in the model and examined the me-diating contributions of both BMI and in-dividual biomarkers.
In all analyses, we modeled alcohol consumption as a linear term in incre-ments of 12.5 g (⬃1 drink) per day. In-clusion of a quadratic term revealed no evidence of a nonlinear relation. We also modeled alcohol consumption on the log scale, which had maximum model fit, with similar results; for ease of interpretation, those results are not shown. Analyses were performed using the SAS statistical package (version 8.2; SAS Institute, Cary, NC).
RESULTS— Baseline characteristics of the case patients and control subjects are shown in Table 1. Women who devel-oped type 2 diabetes had higher BMI, family history of diabetes, and intake of saturated andtransfatty acids and mark-ers of inflammation, endothelial dysfunc-tion, and fasting insulin than control subjects. Alcohol and coffee consump-tion, physical activity, and adiponectin concentrations were lower among women who developed type 2 diabetes than among control subjects. Of our study population, 640 women did not consume alcohol, 706 consumed 0 –12.5 g/day, 88 consumed 12.5–25 g/day, 45 consumed 25–37.5 g/day, 7 consumed 37.5–50 g/day, 1 consumed 50 – 62.5 g/day, 4 con-sumed 62.5–75 g/day, and 1 concon-sumed
⬎100 g/day. All mediating biomarkers were significantly correlated with alcohol consumption in expected directions (Ta-ble 2).
Mediating biomarkers
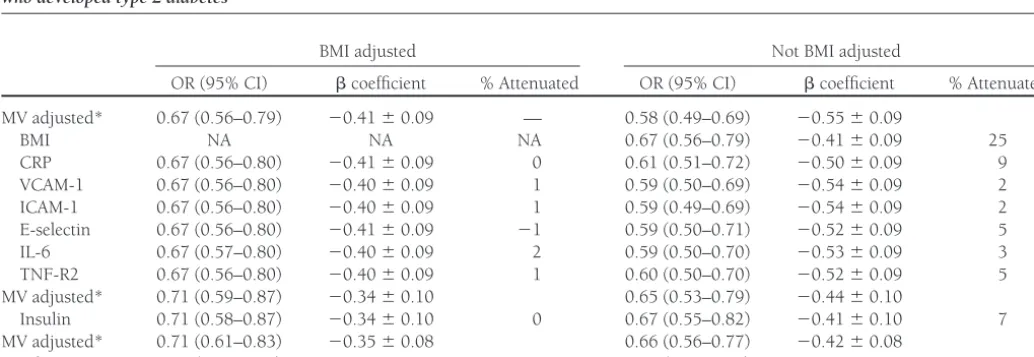
Table 3 shows the association between al-cohol consumption (modeled per 12.5-g increment) and risk of type 2 diabetes and the extent to which mediating biomarkers explained this association. Alcohol con-sumption was associated with a decreased risk of type 2 diabetes in this sample of women with an OR of 0.58 (95% CI 0.49 – 0.69) per 12.5-g increment of alco-hol intake (P ⬍ 0.001), adjusted for matching and confounding factors. Fur-ther adjusting this estimate for BMI atten-uated the-coefficient for alcohol intake by 25%.
None of the markers of inflammation and endothelial dysfunction appeared to explain⬎2% of the association of alcohol consumption with diabetes. Without ad-justment for BMI, these percentages in-creased but were never⬎10%, although inclusion of CRP attenuated the risk esti-mate by 9%. Combining CRP, IL-6, E-selectin, and TNF-R2 in an inflammation score, they accounted for 8% of the
asso-Table 1—Descriptive characteristics of control women and women who developed type 2 diabetes
Control subjects Case patients P
n 787 705
Age (years) 56.7⫾6.9 56.8⫾6.8 NS
BMI (kg/m2) 26.4⫾6.1 30.4⫾5.6 ⬍0.001
Physical activity (METs/week) 15.6⫾27.1 12.1⫾14.7 0.002 Alcohol consumption (g/day) 1.8 (0–6.9) 0 (0–2.7) ⬍0.001 Smoking (%)
Never 46.0 43.7 NS
Past 41.4 42.8 NS
Current 12.6 13.5 NS
Family history of diabetes (%) 20.1 44.8 ⬍0.001
Postmenopausal (%) 78.5 81.1 NS
Nutrients*
Energy (kcal) 1769⫾512 1817⫾561 NS Saturated fatty acids (g) 20.9⫾8.4 22.4⫾9.3 0.002
Transfatty acids (g) 3.0⫾1.5 3.2⫾1.6 0.005 Polyunsaturated fatty acids (g) 11.7⫾5.1 12.1⫾5.0 NS
Fiber (g) 19.9⫾8.0 20.0⫾8.3 NS
Glycemic load 117.4⫾41.9 120.8⫾44.8 NS Coffee consumption (cups/day) 2.2⫾1.8 2.0⫾1.7 0.03 Biomarkers
Insulin (U/ml) 7.5 (4.2–11.0) 11.2 (7.1–17.1) ⬍0.001 CRP (mg/dl) 0.16 (0.07–0.35) 0.37 (0.20–0.63) ⬍0.001 VCAM-1 (ng/ml) 526.0 (444.0–614.2) 545.1 (458.8–646.8) 0.003 ICAM-1 (ng/ml) 247.3 (218.1–277.4) 264.5 (233.2–316.9) ⬍0.001 E-selectin (ng/ml) 45.4 (33.8–60.1) 61.5 (45.4–80.6) ⬍0.001 TNF-R2 (pg/ml) 2396 (2,013–2,861) 2638 (2,209–3,158) ⬍0.001 IL-6 (ng/ml) 1.8 (1.2–2.7) 2.4 (1.7–3.5) ⬍0.001 Adiponectin (g/ml) 17.7 (12.2–22.6) 10.1 (6.8–15.1) ⬍0.001
[image:4.603.42.380.80.419.2]ciation in a fully adjusted model and for 17% without adjustment for BMI. Ex-cluding women with clinically relevant el-evations of CRP (n ⫽ 128) did not essentially change our results but only slightly increased the percentage ex-plained for some markers. For example, CRP now explained 12% in a model un-adjusted for BMI.
Adiponectin explained the associa-tion between alcohol consumpassocia-tion and type 2 diabetes by 25% in a fully adjusted model and by 29% without adjustment for BMI. Fasting insulin did not appear to explain the association between alcohol consumption and type 2 diabetes. With-out adjustment for BMI, inclusion of fast-ing insulin attenuated the observed estimate for alcohol by 7%. In sensitivity analyses, fasting concentrations of proin-sulin and C-peptide did not attenuate the association either (data not shown).
Including BMI as a continuous vari-able in our models did not alter the results of this study (data not shown). Excluding women consuming ⬎50 g alcohol/day did not affect our results.
CONCLUSIONS— In this study, we aimed to quantify the extent to which markers of inflammation, endothelial dysfunction, fasting insulin, and adi-ponectin could explain the lower risk of type 2 diabetes associated with moderate alcohol consumption. Only adiponectin explained this relation by ⬃25–30%. None of the other markers, however, ap-peared to explain this association to any large extent. This finding suggests that, apart from adiponectin, other pathways may be less important.
It is surprising that markers of inflam-mation and endothelial dysfunction did not seem to play a role in the relationship of alcohol consumption with risk of dia-betes. This contrasts with our previous re-sults for CHD, for which inflammatory markers appeared to explain⬃20% of the association (4). Two other studies, how-ever, showed no substantially mediating effect of inflammation on the association of alcohol consumption with CHD (19,20). Our results suggest that inflam-mation and endothelial dysfunction may have little role in the association between
alcohol consumption and type 2 diabetes. Rather, inflammation and endothelial dysfunction may be indirectly related to type 2 diabetes via associations with BMI (21). Indeed, they were stronger interme-diates in this study when BMI was not included as a covariate.
The effect of moderate alcohol con-sumption on insulin sensitivity is not completely understood. Randomized controlled trials and cross-sectional stud-ies have not always reported consistent results (9 –11). Of note, the longest and largest study did find a dose-dependent effect of alcohol consumption on insulin sensitivity and fasting insulin in post-menopausal women similar to our study population. However, our findings sug-gest that the risk reduction of type 2 diabetes with moderate alcohol con-sumption is not simply due to improved insulin sensitivity, at least as captured by fasting insulin.
Recent studies have shown that mod-erate alcohol consumption increases adi-ponectin concentrations and its oli-gomers (11), a finding confirmed in observational studies (12). Adiponectin directly improves insulin sensitivity in an-imal models. Indeed, we show here that adiponectin is an important mediator of the relation between alcohol consump-tion and type 2 diabetes. However, as adi-ponectin only explained⬃25–30% of the association, other mechanisms apart from those described here need to be further explored.
[image:5.603.39.382.71.187.2]It is difficult to assess whether the at-tenuation of the alcohol-diabetes relation-ship by BMI reflects confounding by BMI
Table 2—Spearman correlations between alcohol consumption and mediating biomarkers
Biomarker n Spearman correlation (P)
CRP 1,467 ⫺0.14 (⬍0.001)
VCAM-1 1,491 ⫺0.09 (⬍0.001)
ICAM-1 1,489 ⫺0.09 (0.001)
E-selectin 1,490 ⫺0.10 (⬍0.001)
IL-6 1,442 ⫺0.07 (0.005)
TNF-R2 1,477 ⫺0.13 (⬍0.001)
Insulin 1,055 ⫺0.11 (⬍0.001)
Adiponectin 1,677 0.18 (⬍0.001)
Table 3—Alcohol consumption (per 12.5 g/day), mediating biomarkers, and risk of type 2 diabetes among 787 control women and 705 women who developed type 2 diabetes
BMI adjusted Not BMI adjusted
OR (95% CI) coefficient % Attenuated OR (95% CI) coefficient % Attenuated MV adjusted* 0.67 (0.56–0.79) ⫺0.41⫾0.09 — 0.58 (0.49–0.69) ⫺0.55⫾0.09
BMI NA NA NA 0.67 (0.56–0.79) ⫺0.41⫾0.09 25
CRP 0.67 (0.56–0.80) ⫺0.41⫾0.09 0 0.61 (0.51–0.72) ⫺0.50⫾0.09 9 VCAM-1 0.67 (0.56–0.80) ⫺0.40⫾0.09 1 0.59 (0.50–0.69) ⫺0.54⫾0.09 2 ICAM-1 0.67 (0.56–0.80) ⫺0.40⫾0.09 1 0.59 (0.49–0.69) ⫺0.54⫾0.09 2 E-selectin 0.67 (0.56–0.80) ⫺0.41⫾0.09 ⫺1 0.59 (0.50–0.71) ⫺0.52⫾0.09 5 IL-6 0.67 (0.57–0.80) ⫺0.40⫾0.09 2 0.59 (0.50–0.70) ⫺0.53⫾0.09 3 TNF-R2 0.67 (0.56–0.80) ⫺0.40⫾0.09 1 0.60 (0.50–0.70) ⫺0.52⫾0.09 5 MV adjusted* 0.71 (0.59–0.87) ⫺0.34⫾0.10 0.65 (0.53–0.79) ⫺0.44⫾0.10
Insulin 0.71 (0.58–0.87) ⫺0.34⫾0.10 0 0.67 (0.55–0.82) ⫺0.41⫾0.10 7 MV adjusted* 0.71 (0.61–0.83) ⫺0.35⫾0.08 0.66 (0.56–0.77) ⫺0.42⫾0.08
Adiponectin 0.77 (0.65–0.91) ⫺0.27⫾0.08 24 0.74 (0.63–0.87) ⫺0.30⫾0.08 29
*Multivariate (MV) models are adjusted for BMI, physical activity, smoking, family history of diabetes, postmenopausal hormone replacement therapy, energy intake, and energy-adjusted intake of saturated fat,transfatty acids, polyunsaturated fat, dietary fiber, glycemic load, and coffee consumption. NA, not applicable.
[image:5.603.40.557.540.718.2]or whether alcohol truly acts by minimiz-ing weight gain in women. A recent study among 49,324 women showed that mod-erate alcohol consumption was prospec-tively associated with a decreased 8-year weight gain, whereas heavier drinkers had an increased risk for weight gain (14). Other studies among women have con-firmed these results, whereas no or even a positive association with body weight is reported for men (15). To date, few pro-spective randomized interventions exam-ined the effect of moderate alcohol consumption on body weight (9), but these have not been long enough to ex-clude such an effect conclusively.
The mechanisms underlying the pro-tective effect of light to moderate alcohol consumption are complex and not com-pletely understood. Our results suggest that other mechanisms apart from adi-ponectin explain the association between alcohol consumption and type 2 diabetes. Lipotoxicity, excess release of free fatty acids from adipose tissue, is thought to be an important cause of insulin resistance. In the liver, free fatty acids increase glu-cose production, triglycerides, and secre-tion of VLDL. Associated lipoprotein abnormalities include reductions in HDL and increased LDL. Alcohol consumption strongly affects lipid metabolism (22) and could thereby possibly also influence in-sulin resistance and risk of type 2 diabe-tes. Another possibility is that the effects of moderate drinking are not related to ethanol itself but to acetate, the end prod-uct of ethanol oxidation (23). Acetate may affect fat oxidation and decrease lipolysis and free fatty acids and indirectly improve insulin sensitivity (24).
The strengths of this study include its prospective design; detailed assessment of alcohol consumption, diet, and life-style; and inclusion of a variety of markers previously related to risk of diabetes. Nonetheless, certain limitations need to be addressed. Because insulin was only assessed for those with fasting blood sam-ples, we used slightly different subgroups for each group of biomarkers, which may have introduced some selection bias. However, within each subgroup, moder-ate alcohol consumption was associmoder-ated with a similar decreased risk of diabetes as in the entire case-control study. In addi-tion, we could only include women pro-viding blood samples in this study, which could also be subject to selection. In com-paring those women with women not providing blood samples, they had higher prevalences of obesity and family history
of diabetes, which could lead to increased diabetes risk in this sample. However, be-cause we only included incident cases of diabetes, selection of these women is not related to the occurrence of disease and therefore does not lead to selection bias. It could limit generalizability of our results to women with a slightly lower diabetes risk.
We were restricted to fasting insulin as a measure of insulin sensitivity, but it only correlates modestly to the hyperin-sulinemic-euglycemic clamp technique. Other studies using more robust markers of insulin sensitivity such as homeostasis model assessment are needed to deter-mine the full degree to which insulin sen-sitivity mediates the association between alcohol consumption and diabetes. Other biomarkers such as adiponectin, which could potentially mediate a substantial part of the association, should be in-cluded in such studies as well.
In summary, adiponectin explains about 25–30% of the relation between al-cohol consumption and type 2 diabetes. Markers of inflammation, endothelial dys-function, and fasting insulin did not appear to play an important role. These results cast some doubt on the physiological im-portance of the effects of alcohol on inflam-mation and endothelial function, at least for glucose metabolism, and suggest that fur-ther research is needed into the potentially mediating roles of other biomarkers af-fected by alcohol consumption.
Acknowledgments— This work was sup-ported by National Institutes of Health grants R01AA011181 and DK58845, a travel grant from the Dutch Heart Association, and a re-search exchange award from European Re-search Advisory Board (J.W.J.B.).
References
1. Koppes LL, Dekker JM, Hendriks HF, Bouter LM, Heine RJ: Moderate alcohol consumption lowers the risk of type 2 di-abetes: a meta-analysis of prospective ob-servational studies.Diabetes Care28:719 – 725, 2005
2. Maclure M: Demonstration of deductive meta-analysis: ethanol intake and risk of myocardial infarction.Epidemiol Rev15: 328 –351, 1993
3. Gaziano JM, Buring JE, Breslow JL, Gold-haber SZ, Rosner B, VanDenburgh M, Willett W, Hennekens CH: Moderate al-cohol intake, increased levels of high-density lipoprotein and its subfractions,
and decreased risk of myocardial infarc-tion.N Engl J Med329:1829 –1834, 1993 4. Mukamal KJ, Jensen MK, Gronbaek M, Stampfer MJ, Manson JE, Pischon T, Rimm EB: Drinking frequency, mediating biomarkers, and risk of myocardial infarc-tion in women and men.Circulation11 2:1406 –1413, 2005
5. Hu FB, Meigs JB, Li TY, Rifai N, Manson JE: Inflammatory markers and risk of de-veloping type 2 diabetes in women. Dia-betes53:693–700, 2004
6. Meigs JB, Hu FB, Rifai N, Manson JE: Bio-markers of endothelial dysfunction and risk of type 2 diabetes mellitus. JAMA 291: 1978 –1986, 2004
7. Imhof A, Froehlich M, Brenner H, Boeing H, Pepys MB, Koenig W: Effect of alcohol consumption on systemic markers of in-flammation.Lancet357:763–767, 2001 8. Sierksma A, van der Gaag MS, Kluft C,
Hendriks HF: Moderate alcohol con-sumption reduces plasma C-reactive pro-tein and fibrinogen levels: a randomized, diet-controlled intervention study. Eur J Clin Nutr56:1130 –1136, 2002 9. Davies MJ, Baer DJ, Judd JT, Brown ED,
Campbell WS, Taylor PR: Effects of mod-erate alcohol intake on fasting insulin and glucose concentrations and insulin sensi-tivity in postmenopausal women: a ran-domized controlled trial. JAMA 287: 2559 –2562, 2002
10. Bell RA, Mayer-Davis EJ, Martin MA, D’Agostino RB Jr, Haffner SM: Associa-tions between alcohol consumption and insulin sensitivity and cardiovascular dis-ease risk factors: the Insulin Resistance and Atherosclerosis Study.Diabetes Care
23:1630 –1636, 2000
11. Beulens JW, van Loon LJ, Kok FJ, Pelsers M, Bobbert T, Spranger J, Helander A, Hen-driks HF: The effect of moderate alcohol consumption on adiponectin oligomers and muscle oxidative capacity: a human inter-vention study.Diabetologia50:1388 –1392, 2007
12. Pischon T, Girman CJ, Rifai N, Hotamis-ligil GS, Rimm EB: Association between dietary factors and plasma adiponectin concentrations in men.Am J Clin Nutr81: 780 –786, 2005
13. Hu FB, Manson JE, Stampfer MJ, Colditz G, Liu S, Solomon CG, Willett WC: Diet, lifestyle, and the risk of type 2 diabetes mellitus in women.N Engl J Med345:790 – 797, 2001
14. Wannamethee SG, Field AE, Colditz GA, Rimm EB: Alcohol intake and 8-year weight gain in women: a prospective study.Obes Res12:1386 –1396, 2004 15. Westerterp KR, Prentice AM, Jequier E:
Al-cohol and body weight. InHealth Issues Re-lated to Alcohol Consumption. 2nd ed. Macdonald I, Ed. Bodmin, U.K., Blackwell Science, 1999, p. 103–123
WC: Reproducibility and validity of food intake measurements from a semiquanti-tative food frequency questionnaire.J Am Diet Assoc93:790 –796, 1993
17. Giovannucci E, Colditz G, Stampfer MJ, Rimm EB, Litin L, Sampson L, Willett WC: The assessment of alcohol consump-tion by a simple self-administered ques-tionnaire.Am J Epidemiol133:810 –817, 1991
18. Brevetti G, Martone VD, de CT, Corrado S, Silvestro A, Di Donato AM, Bucur R, Scopacasa F: High levels of adhesion molecules are associated with impaired endothelium-dependent vasodilation in patients with peripheral arterial disease.
Thromb Haemost85:63–66, 2001 19. Maraldi C, Volpato S, Kritchevsky SB,
Ce-sari M, Andresen E, Leeuwenburgh C, Harris TB, Newman AB, Kanaya A, John-son KC, Rodondi N, Pahor M: Impact of inflammation on the relationship among alcohol consumption, mortality, and car-diac events: the health, aging, and body composition study.Arch Intern Med166: 1490 –1497, 2006
20. Mukamal KJ, Chung H, Jenny NS, Kuller LH, Longstreth WT Jr, Mittleman MA, Burke GL, Cushman M, Psaty BM, Sisco-vick DS: Alcohol consumption and risk of coronary heart disease in older adults: the Cardiovascular Health Study.J Am Geriatr Soc54:30 –37, 2006
21. Wexler DJ, Hu FB, Manson JE, Rifai N, Meigs JB: Mediating effects of inflamma-tory biomarkers on insulin resistance
as-sociated with obesity.Obes Res13:1772– 1783, 2005
22. Rimm EB, Williams P, Fosher K, Criqui M, Stampfer MJ: Moderate alcohol intake and lower risk of coronary heart disease: meta-analysis of effects on lipids and haemostatic factors.BMJ319:1523–1528, 1999 23. Beulens JW, Rimm EB, Hendriks HF, Hu
FB, Manson JE, Hunter DJ, Mukamal KJ: Alcohol consumption and type 2 diabe-tes: influence of genetic variation in alco-hol dehydrogenase. Diabetes 56:2388 – 2394, 2007
24. Johnston CS, Kim CM, Buller AJ: Vinegar improves insulin sensitivity to a high-carbohydrate meal in subjects with insu-lin resistance or type 2 diabetes.Diabetes Care27:281–282, 2004