TERIFLUNOMIDE BY RP- HPLC
A dissertation submitted to
THE TAMILNADU Dr.M.G.R MEDICAL UNIVERSITY
CHENNAI- 600 032.
In partial fulfillment of the requirements for the award of Degree of
MASTER OF PHARMACY IN
PHARMACEUTICAL ANALYSIS Submitted
By
K.DINESH BABU (Reg. No: 261530952) Under the guidance of
Prof., Dr.D.Babu Ananth, M.Pharm.,Ph.D.,
DEPARTMENT OF PHARMACEUTICAL ANALYSIS
EDAYATHANGUDY.G.S PILLAY COLLEGE OF PHARMACY
NAGAPATTINAM- 611002Principal cum Professor,
Department of Pharmaceutical Analysis,
Edayathangudy.G.S.Pillay College of Pharmacy,
Nagapattinam – 611 002.
CERTIFICATE
This is to certify that the dissertation entitled “ANALYTICAL METHOD
DEVELOPMENT AND VALIDATION OF TERIFLUNOMIDE BY RP-HPLC”
submitted by K.DINESH BABU(Reg. No: 261530952) in partial fulfillment for
the award of degree of Master of Pharmacy to the Tamilnadu Dr. M.G.R
Medical University, Chennai is an independent bonafide work of the candidate
carried out under my guidance in the Department of Pharmaceutical analysis,
Edayathangudy.G.S Pillay College of Pharmacy during the academic year
2016-2017.
Place: Nagapattinam (Prof., Dr.D.Babu Ananth,M.Pharm.,Ph.D.,)
ACKNOWLEDGEMENT
I would like to express profound gratitude to Mrs.Jothimani G.S.Pillay,
Chairman, E.G.S.Pillay College of Pharmacy, and Thiru. S.Paramesvaran, M.Com., FCCA., Secretary, E.G.S.Pillay College of Pharmacy.
I express my sincere and deep sense of gratitude to my Guide
Prof.Dr.D.Babu Ananth, M.Pharm., Ph.D., Principal, Head, Department of Pharmaceutical Analysis E.G.S.Pillay College of Pharmacy, for his invaluable
and extreme support, encouragement, and co-operation throughout the
course of my work.
I express my sincere gratitude to Prof. Dr.M.Murugan, M.Pharm., Ph.D., Director cum Professor, Head, Department of Pharmaceutics. E.G.S.Pillay College of Pharmacy, for his encouragement
throughout the course of my work.
I express my sincere gratitude to Prof., K.Shahul Hameed Maraicar, M.Pharm., (Ph.D)., Director cum Professor, Department of Pharmaceutics. E.G.S.Pillay College of Pharmacy, for his encouragement throughout the
course of my work.
I would like to extend my thanks to all the Teaching Staff and Non Teaching Staff, who are all supported me for the successful completion of my project work.
Last but not least, I express my deep sense of gratitude to my parents,
family members and friends for their constant valuable blessings and
Dept of Pharmaceutical Analysis 1 EGS Pillay College of Pharmacy
1.0
INTRODUCTION
1.1 High-Performance Liquid Chromatography (HPLC)
High-performance liquid chromatography, is a chromatographic technique used to
separate the components in a mixture, to identify each component, and to quantify
each component. The method involves a liquid sample being passed over a solid
adsorbent material packed into a column using a flow of liquid solvent. Each analyte
in the sample interacts slightly differently with the adsorbent material, thus retarding
the flow of the analytes. If the interaction is weak, the analytes flow off the column in
a short amount of time, and if the interaction is strong, then the elution time is long.
(Sharma B.K, 1994).
Chromatography may be defined as a method of separating a mixture of
components into individual components through equilibrium distribution between two
phases. (Chatwal G.R, 1998)
The HPLC method was considered the choice of estimation, since this method
is the most powerful of all chromatographic and other separative methods. The HPLC
method has enabled analytical chemist to attain great success in solving his analytical
problems. The HPLC is the method of choice in the field of analytical chemistry,
since this method is specific, robust, linear, precise, and accurate and the limit of
detection is low and also it offers the following advantages. (Beckett, 2002)
The schematic representation of an HPLC instrument typically includes a
sampler, pumps, and a detector. The sampler brings the sample mixture into the
mobile phase stream which carries it into the column. The pumps deliver the desired
Dept of Pharmaceutical Analysis 2 EGS Pillay College of Pharmacy a signal proportional to the amount of sample component emerging from the column,
hence allowing for quantitative analysis of the sample components. A digital
microprocessor and user software control the HPLC instrument and provide data
analysis. Some models of mechanical pumps in a HPLC instrument can mix multiple
solvents together in ratios changing in time, generating a composition gradient in the
mobile phase. Various detectors are in common use, such as UV/Vis, photodiode
array (PDA) or Refractive Index (RI).
Dept of Pharmaceutical Analysis 3 EGS Pillay College of Pharmacy 1.2 Components Of HPLC System
1.2.1 Pump
Pump generates a flow of eluent from the solvent reservoir to the system. Most
pumps used in current LC systems generate the flow by back-and-forth motion of a
motor-driven piston (reciprocating pumps). Because of this piston motion, it produces
“pulses”. There have been large system improvements to reduce this pulsation and the
recent pumps create much less pulse compared to the older ones. Recent analysis
requires very high sensitivity to quantify a small amount of analytes, and thus even a
minor change in the flow rate can influence the analysis. Therefore, the pumps
required for the high sensitivity analysis needs to be highly precise.
1.2.2 Injector
An injector is placed next to the pump. The simplest method is to use a syringe, and
the sample is introduced to the flow of eluent. Since the precision of LC measurement
is largely affected by the reproducibility of sample injection, the design of injector is
an important factor. The most widely used injection method is based on sampling
loops. The use of autosampler (auto-injector) system is also widely used that allows
repeated injections in a set scheduled-timing.
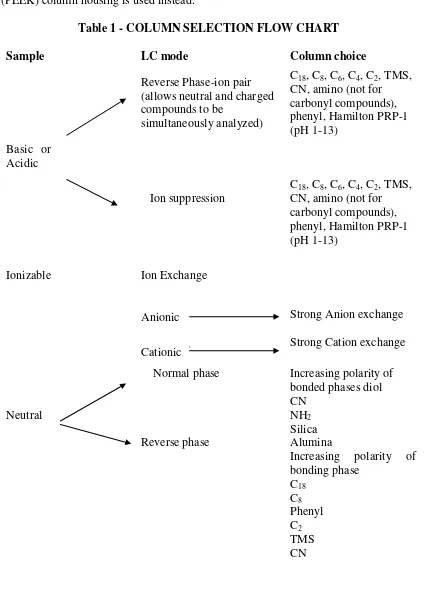
1.2.3 Column
The separation is performed inside the column; therefore, it can be said that the
column is the heart of an LC system. The packing material generally used is silica or
polymer gels. The eluent used for LC varies from acidic to basic solvents. Most
column housing is made of stainless steel, since stainless is tolerant towards a large
Dept of Pharmaceutical Analysis 4 EGS Pillay College of Pharmacy and ionic compounds, contact with metal is not desired, thus polyether ether ketone
[image:7.595.107.532.106.711.2](PEEK) column housing is used instead.
Table 1 - COLUMN SELECTION FLOW CHART
Sample LC mode Column choice
Reverse Phase-ion pair (allows neutral and charged compounds to be
simultaneously analyzed)
C18, C8, C6, C4, C2, TMS, CN, amino (not for carbonyl compounds), phenyl, Hamilton PRP-1 (pH 1-13)
Basic or Acidic
Ion suppression
C18, C8, C6, C4, C2, TMS, CN, amino (not for carbonyl compounds), phenyl, Hamilton PRP-1 (pH 1-13)
Ionizable Ion Exchange
Anionic Strong Anion exchange
Cationic Strong Cation exchange
Normal phase Increasing polarity of
bonded phases diol CN
Neutral NH2
Silica
Reverse phase Alumina
Dept of Pharmaceutical Analysis 5 EGS Pillay College of Pharmacy 1.2.4 Detector
Separation of analytes is performed inside the column, whereas a detector is used to
observe the obtained separation. The composition of the eluent is consistent when no
analyte is present. While the presence of analyte changes the composition of the
eluent. What detector does is to measure these differences. This difference is
monitored as a form of electronic signal. (Snyder L.R, Kirkland J.J 1983)
1.2.5 On-line detectors: Refractive index
UV/Vis Fixed wavelength
UV/Vis Variable wavelength
UV/Vis Diode array
Fluorescence
Conductivity
Mass-spectrometric (LC/MS)
Evaporative light scattering
1.2.6 Off-line detector:
FTIR spiral disk monitor; requires sample transfer on the germanium disk and
the following scanning in FTIR instrument.
1.2.7 Recorder
The change in eluent detected by a detector is in the form of electronic signal, and
thus it is still not visible to our eyes. Nowadays, computer based data processor
(integrator) is more common. There are software that are specifically designed for LC
system. It provides not only data acquisition, but features like peak-fitting, base line
Dept of Pharmaceutical Analysis 6 EGS Pillay College of Pharmacy 1.2.8 Degasser
The eluent used for LC analysis may contain gases such as oxygen that are
non-visible to our eyes. When gas is present in the eluent, this is detected as a noise and
causes unstable baseline. Generally used method includes sparging (bubbling of inert
gas), use of aspirator, distillation system, and/or heating and stirring. However, the
method is not convenient and also when the solvent is left for a certain time period
(e.g., during the long analysis), gas will dissolve back gradually. Degasser uses
special polymer membrane tubing to remove gases. The numerous very small pores
on the surface of the polymer tube allow the air to go through while preventing any
liquid to go through the pore. By placing this tubing under low pressure container, it
created pressure differences inside and outside the tubing (higher inside the tubing).
This difference let the dissolved gas to move through the pores and remove the gas.
Compared to classical batch type degassing, the degasser can be used on-line, it is
more convenient and efficient.
1.2.9 Column Heater
The LC separation is often largely influenced by the column temperature. Also for
some analysis, such as sugar and organic acid, better resolutions can be obtained at
elevated temperature (50~80°C). It is also important to keep stable temperature to
obtain repeatable results even it is analyzed at around room temperature. There are
possibilities that small different of temperature causes different separation results.
Dept of Pharmaceutical Analysis 7 EGS Pillay College of Pharmacy 1.3 Introduction To HPLC Method Development
Method development has following steps: (Willard H.H, Merritt L.L, Dean J.A. and settle F.A,7th Edn)
A good method development strategy should require only as many experimental runs
as are necessary to achieve the desired final result. Finally method development
should be as simple as possible, and it should allow the use of sophisticated tools such
as computer modelling. (Synder K.L, Krikland J.J and Glajch J.L, 1983). Collect information on sample, define separation goals
Need for special HPLC procedure, sample pretreatment, etc.
Choose detector and detector settings
Choose LC method, preliminary run, select best separation conditions
Optimize separation conditions
Check for problems
Quantitative calibration
Recover purified material Qualitative method
Dept of Pharmaceutical Analysis 8 EGS Pillay College of Pharmacy 1.4 Important factors to obtain reliable method
The important factors, which are to be taken into account to obtain reliable
quantitative analysis, are:
1. Careful sampling and sample preparation.
2. Appropriate choice of the column.
3. Choice of the operating conditions to obtain the adequate resolution of the
mixture.
4. Reliable performance of the recording and data handling systems.
5. Suitable integration/peak height measurement technique.
6. The mode of calculation best suited for the purpose
7. Validation of the developed method.
1.4.1 Careful Sampling And Sample Preparation
Before beginning method development, it is need to review what is known about the
sample in order to define the goals of separation. The sample related information that
[image:11.595.110.481.490.751.2]is important is summarized in following Table 2
Table: 2
Number of compounds present
Chemical structures
Molecular weights of compounds
pKa values of compounds
UV spectra of compounds
Concentration range of compounds in samples of interest
Dept of Pharmaceutical Analysis 9 EGS Pillay College of Pharmacy The chemical composition of the sample can provide valuable clues for the best
choice of initial conditions for an HPLC separation.
1.4.2 Separation Goals (Snyder et al., 1997, Sharma B.K., 1980) The goals of HPLC separation need to be specified clearly, which include:
The use of HPLC to isolate purified sample components for spectral
identification or quantitative analysis.
It may be necessary to separate all degradants or impurities from a product for
reliable content assay.
In quantitative analysis, the required levels of accuracy and precision should be
known (a precision of 1 to 2% is usually achievable).
Whether a single HPLC procedure is sufficient for raw material or one or more
different procedures are desired for formulations.
When the number of samples for analysis at one time is greater than 10, a run
time of less than 20 minutes often will be important.
1.4.3 Sample preparation
Samples come in various forms:
Solutions ready for injection
Solutions that require dilution, buffering, addition of an internal standard or
other volumetric manipulation
Solids must be dissolved or extracted
Samples that require pretreatment to remove interferences and/or protect the
column or equipment from damage.
Most samples for HPLC analysis require weighing and /or volumetric dilution before
Dept of Pharmaceutical Analysis 10 EGS Pillay College of Pharmacy is close to that of the mobile phase since this minimizes baseline upset and other
problems. Some samples require a partial separation (pretreatment) prior to HPLC,
because of need to remove interferences, concentrate sample analytes or eliminate
“column killers”.
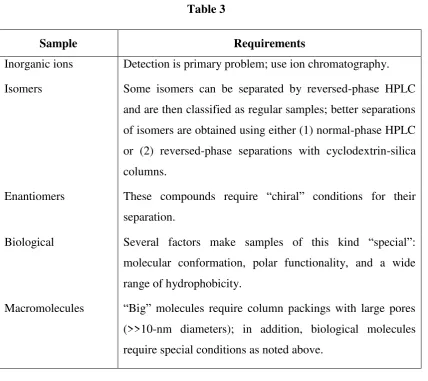
The samples may be of two types, regular or special. The regular samples are typical
mixtures of small molecules (<2000Da) that can be separated by normal starting
conditions. Whereas special samples are better separated under customized conditions
[image:13.595.109.538.291.672.2]given in Table: 3
Table 3
Sample Requirements
Inorganic ions Detection is primary problem; use ion chromatography.
Isomers Some isomers can be separated by reversed-phase HPLC
and are then classified as regular samples; better separations
of isomers are obtained using either (1) normal-phase HPLC
or (2) reversed-phase separations with cyclodextrin-silica
columns.
Enantiomers These compounds require “chiral” conditions for their
separation.
Biological Several factors make samples of this kind “special”:
molecular conformation, polar functionality, and a wide
range of hydrophobicity.
Macromolecules “Big” molecules require column packings with large pores
(>>10-nm diameters); in addition, biological molecules
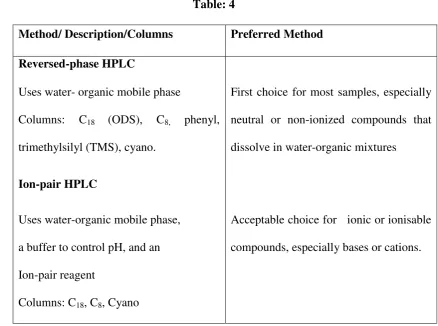
Dept of Pharmaceutical Analysis 11 EGS Pillay College of Pharmacy 1.4.4 Choice of the Column
The selection of the column in HPLC is somewhat similar to the selection of
columns in G.C, in the sense that, in the adsorption and partition modes, the
separation mechanism is based on inductive forces, dipole-dipole interactions and
hydrogen bond formation. In case of ion-exchange chromatography, the separation is
based on the differences in the charge, size of the ions generated by the sample
molecules and the nature of ionisable group on the stationary phase. In the case of
size-exclusion chromatography the selection of the column is based on the molecular
weight and size of the sample components. Selection of columns based on the method
is briefly summarized in Table 4.
Table: 4
Method/ Description/Columns Preferred Method Reversed-phase HPLC
Uses water- organic mobile phase
Columns: C18 (ODS), C8, phenyl,
trimethylsilyl (TMS), cyano.
First choice for most samples, especially
neutral or non-ionized compounds that
dissolve in water-organic mixtures
Ion-pair HPLC
Uses water-organic mobile phase,
a buffer to control pH, and an
Ion-pair reagent
Columns: C18, C8, Cyano
Acceptable choice for ionic or ionisable
[image:14.595.95.534.351.677.2]Dept of Pharmaceutical Analysis 12 EGS Pillay College of Pharmacy Method/ Description/Columns Preferred Method
Normal-phase HPLC
Uses mixtures of organic solvents as
mobile phase Columns: cyano, diol,
amino, silica
Good second choice when
reversed-phase or ion-pair HPLC is ineffective;
first choice for lipophilic samples that do
not dissolve well in water-organic
mixtures; first choice for mixtures of
isomers and for preparative HPLC
1.4.5 Operating conditions to obtain the adequate resolution of the mixture Most of the drugs come under the category of regular samples. Regular samples mean
typical mixtures of small molecules (<2000Da) that can be separated using more or
less standardized starting conditions. Regular samples can be further classified as
neutral or ionic. Samples classified as ionic include acids, bases, amphoteric
compounds and organic salts. If the sample is neutral, buffers or additives are
generally not required in the mobile phase.
Acids or bases usually require the addition of a buffer to the mobile phase. For basic
or cationic samples, less acidic reverse phase columns are recommended. Based on
recommendations of the conditions, the first exploratory run is carried and then
improved systematically. On the basis of the initial exploratory run isocratic or
gradient elution can be selected as most suitable. If typical reverse-phase conditions
provided inadequate sample retention, it suggests the use of either ion-pair or normal
Dept of Pharmaceutical Analysis 13 EGS Pillay College of Pharmacy mobile phase suggesting the use of non-aqueous reverse phase chromatography or
normal phase HPLC.
1.4.6 Method Development
One approach is to use an isocratic mobile phase of some average organic solvent
strength (50%). A better alternative is to use a very strong mobile phase first
(80-100%) then reduce %B as necessary. The initial separation with 100% B results in
rapid elution of the entire sample, but few groups will separate. Decreasing the
solvent strength shows the rapid separation of all components with a much longer run
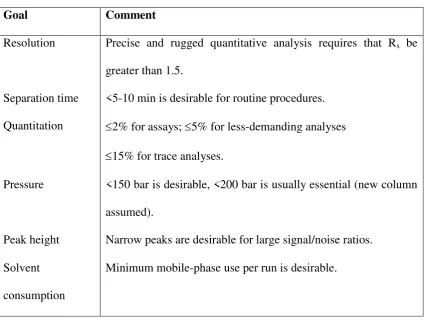
time, with a broadening of latter bands and reduced retention sensitivity. Goals that
[image:16.595.110.536.376.698.2]are to be achieved in method development are briefly summarized in Table 5.
Table: 5
Goal Comment
Resolution Precise and rugged quantitative analysis requires that Rs be
greater than 1.5.
Separation time <5-10 min is desirable for routine procedures.
Quantitation 2% for assays; 5% for less-demanding analyses
15% for trace analyses.
Pressure <150 bar is desirable, <200 bar is usually essential (new column
assumed).
Peak height Narrow peaks are desirable for large signal/noise ratios.
Solvent
consumption
Dept of Pharmaceutical Analysis 14 EGS Pillay College of Pharmacy Separation or resolution is a primary requirement in quantitative HPLC. The
resolution (Rs) value should be maximum (Rs > 1.5) favors maximum precision.
Resolution usually degrades during the life of the column and can vary from day to
day with minor fluctuations in separation conditions. Therefore, values of Rs=2 or
greater should be the goal during method development for sample mixtures. Such
resolution will favor both improved assay precision and greater method ruggedness.
Some HPLC assays do not require base line separation of the compounds of
interest (qualitative analysis). In such cases only enough separation of individual
components is required to provide characteristic retention times for peak
identification.
The time required for a separation (runtime = retention time for base band)
should be as short as possible and the total time spent on method development is
reasonable (runtimes 5 to 10 minutes are desirable).
Conditions for the final HPLC method should be selected so that the operating
pressure with a new column does not exceed 170 bar (2500 psi) and an upper pressure
limit below 2000 psi is desirable. There are two reasons for this pressure limit, despite
the fact that most HPLC equipment can be operated at much higher pressures. First,
during the life of a column, the backpressure may rise by a factor of as much as 2 due
to the gradual plugging of the column by particulate matter. Second, at lower
pressures (<170 bars) pumps, sample valves and especially auto samplers operate
much better, seals last longer, columns tend to plug less and system reliability is
significantly improved. For these reasons, a target pressure of less than 50 % of the
Dept of Pharmaceutical Analysis 15 EGS Pillay College of Pharmacy samples or if the goals of separation are particularly stringent, a large number of
method development runs may be required to achieve acceptable separation.
1.4.7 Repeatable Separation
As the experimental runs described above are being carried out, it is important to
confirm that each chromatogram can be repeated. When we change conditions
(mobile phase, column, and temperature) between method development experiments,
enough time must elapse for the column to come into equilibrium with the new
mobile phase and temperature.
Usually column equilibration is achieved after passage of 10 to 20 volumes of the new
mobile phase through the column. However, this should be confirmed by repeating
the experiment under the same conditions. When constant retention times are
observed in two such back-to-back repeat experiments (± 0.5% or better), it can be
assumed that the column is equilibrated and the experiments are repeatable.
1.4.8 Optimization of HPLC Method
During the optimization stage, the initial sets of conditions that have evolved from the
first stages of development are improved or maximized in terms of resolution and
peak shape, plate counts, asymmetry, capacity factor, elution time, detection limits,
limit of quantitation and overall ability to quantify the specific analyte of interest.
Optimization of a method can follow either of two general approaches:
Manual
Computer driven
The manual approach involves varying one experimental variable at a time, while
holding all other constant and recording changes in response. The variables might
Dept of Pharmaceutical Analysis 16 EGS Pillay College of Pharmacy wavelength and PH. This approach to system is slow, time consuming and potentially
expensive. However, it may provide a much better understanding of the principles and
theory involved and of interactions of the variables.
In the second approach, computer driven automated method development,
efficiency is optimized while experimental input is minimized. This approach reduce
the time, energy and cost of all instrumental method development.
The various parameters that include to be optimized during method development are
A.Selection of mode of separation.
B.Selection of stationary phase.
C.Selection of mobile phase.
D.Selection of detector.
1.4.8.1Selection Of Mode Of Separation
In reverse phase mode, the mobile phase is comparatively more polar than the
stationary phase. For the separation of polar or moderately polar compounds, the most
preferred mode is reverse phase. The nature of the analyte is the primary factor in the
selection of the mode of separation .A second factor is the nature of the matrix.
1.4.8.2Selection of stationary phase
Selection of the column is the first and the most important step in method
development. The appropriate choice of separation column indicates three different
approaches.
Selection of separation
The particle size and nature of the column packing
Dept of Pharmaceutical Analysis 17 EGS Pillay College of Pharmacy Some of the important parameters considered while selecting chromatographic
columns are
Length and diameter of the column
Packing material
Shape of the particles
Size of the particles
% of Carbon loading
Pore volume
Surface area
Reproducibility and reliability
End capping
In this case, the column selected had a particle size of 5µm and an internal diameter of
4.6mm.The column is selected depending on the nature of the solute and the
information about the analyte. Reversed phase mode of chromatography facilities a
wide range of columns like dimethyl silane (C2), butysilane (C4), octysilane(C8),
octadecylsane (C18),base deactivated silane (C18), BDS phenyl, cyanoproply (CN),
nitro, amino etc. Silica based columns with different cross linking’s in the increasing
order of Polarity are as follows:
<…………. Non-polar ……… moderately polar…………. Polar. ……>
C18 < C8 < C6 < Phenyl < Amino < Cyano < Silica
C18 was chosen for this study since it is most retentive one. The sample
Dept of Pharmaceutical Analysis 18 EGS Pillay College of Pharmacy provide better separation due to higher theoretical plate numbers. Columns with 5µm
particle size give the best compromise of efficiency.
Peak shape is equally important in method development. Columns that provide
symmetrical peaks are always preferred while peaks with poor asymmetry can result
in,
Inaccurate plate number and resolution measurement
Imprecise quantitation
Degraded and undetected minor bands in the peaks tail
Poor retention reproducibility
A useful and practical measurement of peak shape is peak asymmetry factor
and peak tailing factor. Peak asymmetry is measured at 10% of full peak height and
peak tailing factor at 5%. Reproducibility of retention times and capacity factor is
important for developing a rugged and repeatable method.
A column which gives separation of all the impurities and degradants from
each other and from analyte peak and which is rugged for variation in mobile phase
shall be selected.
1.4.8.3Selection Of Mobile Phase
The primary objective in selection and optimization of mobile phase is to achieve
optimum separation of all the individual impurities and degradants from each other
and from analyte peak.
In liquid chromatography, the solute retention is governed by the solute
distribution factor, which reflects the different interactions of the solute-stationary
phase, solute-mobile phase, and mobile phase-stationary phase. For a given stationary
Dept of Pharmaceutical Analysis 19 EGS Pillay College of Pharmacy to get appropriate and required solute retention. The mobile phase has to be adapted in
terms of elution strength (solute retention) and solvent selectivity (solute separation).
Solvent polarity is the key word in chromatographic separations since a polar mobile
phase will give rise to low solute retention in normal phase and high solute retention
in reverse phase LC. The selectivity will be particularly altered if the buffer pH is
close to the pKa of the analytes. The following are the parameters, which shall be
taken into consideration while selecting and optimizing the mobile phase.
Buffer
pH of the buffer
Mobile phase composition
1.4.8.4Buffers if any and its strength:
Buffer and its strength play an important role in deciding the peak symmetries and
separations. Some of the most commonly employed buffers are
Phosphate buffers prepared using salts like KH2PO4, K2HPO4, NaH2PO4,
Na2HPO4.
Phosphoric acid buffers prepared using H3PO4.
Acetate buffers-Ammonium acetate, Sodium acetate etc.
Acetic acid buffers prepared using CH2COOH.
The retention also depends on the molar strengths of the buffer-Molar strength is
increasingly proportional to retention times. The strength of the buffer can be
increased, if necessary to achieve the required separations. The solvent strength is a
measure of its ability to pull analyte from the column. It is generally controlled by the
Dept of Pharmaceutical Analysis 20 EGS Pillay College of Pharmacy columns is 2 to 8, since siloxane linkages are cleaved below pH-2 while at pH values
above eight, silica may dissolve.
1.4.8.5Mobile phase composition:
Most chromatographic separations can be achieved by choosing the optimum mobile
phase composition. This is due to the fact that fairly large amount of selectivity can be
achieved by choosing the qualitative and quantitative composition of aqueous and
organic portions. Most widely used solvents in reverse phase chromatography are
Methanol and Acetonitrile. Experiments should be conducted with mobile phases
having buffers with different pH and different organic phases to check for the best
separations of analyte peak. A mobile phase which gives separation of analyte peak
and which is rugged for variation of both aqueous and organic phase by at least ±
0.2% of the selected mobile phase composition should be used.
1.4.8.6Selection Of Detector
The detector was chosen depending upon some characteristic property of the analyte
like UV absorbance, florescence, conductance, oxidation, reduction etc. The
characteristics that are to be fulfilled by a detector to be used in HPLC determination
are,
High sensitivity facilitating trace analysis.
Negligible baseline noise to facilitate lower detection.
Large linear dynamic range.
Low dead volume.
Inexpensive to purchase and operate.
Pharmaceutical ingredients do not absorb all UV light equally, so that selection of
Dept of Pharmaceutical Analysis 21 EGS Pillay College of Pharmacy properties of the organic impurities and the active pharmaceutical ingredient is very
helpful. For the greatest sensitivity λmax should be used. Ultra violet wavelengths
below 200nm should be avoided because detector noise increases in this region.
Higher wavelengths give greater selectivity.
1.4.8.7Performance Calculations
Carrying out system suitability experiment does the performance calculations.
System suitability experiments can be defined as tests to ensure that the method can
generate results of acceptable accuracy and precision. The requirements for system
suitability are usually developed after method development and validations have been
completed. The criteria selected will be based on the actual performance of the
method as determined during its validation. For example, if sample retention times
form part of the system suitability criteria, their variation SD can be determined
during validation.
System suitability might then require that retention times fall within a ±3 SD
range during routine performance of the method.
The USP (2000) defines parameters that can be used to determine system
suitability prior to analysis include plate number (n), tailing factor (T), resolution (RS)
and relative standard deviation (RSD) of peak height or peak area for respective
injections.
The RSD of peak height or area of five injections of a standard solution is
normally accepted as one of the standard criteria. For assay method of a major
component, the RSD should typically be less than 1% for these five respective
Dept of Pharmaceutical Analysis 22 EGS Pillay College of Pharmacy The plate number and/ or tailing factor are used if the run contains only one
peak. For chromatographic separations with more than one peak, such as an internal
standard assay or an impurity method expected to contain many peaks, some measure
of separations such as RS is recommended. Reproducibility of tR or k value for a
specific compound also defines system performance.
The column performance can be defined in terms of column plate number. As
the plate count is more the column is more efficient.
1.4.9 METHOD VALIDATION
The word “Validation” means “Assessment” of validity or action of proving
effectiveness.
1.4.9.1Definition
ICH defines validation as “establish the documented evidence which provides a high degree of assurance that a specific process will consistently produce a product of
predetermined specifications and quantity attributes”.
Method validation is the process to confirm that the analytical procedure
employed for a specific test is suitable for its intended use. Methods need to be
validated or revalidated.
Before their introduction into routine use
Whenever the conditions change for which the method has been validated, e.g.,
instrument with different characteristics
Whenever the method is changed, and the change is outside the original scope of
Dept of Pharmaceutical Analysis 23 EGS Pillay College of Pharmacy 1.4.9.2Purpose Of Validation
Enable the scientists to communicate scientifically and effectively on technical
matter.
Setting the standards of evaluation procedures for checking compliance and taking
remedial action.
Economic: Reduction in cost associated with process sampling and testing.
As quality of the product cannot always be assured by routine quality control
because of testing of statistically insignificant number of samples.
Retrospective validation is useful for trend comparison of results compliance to
CGMP/CGLP.
Closure interaction with Pharmacopoeial forum to address analytical problems.
International Pharmacopoeial harmonization particularly in respect of impurities
determination and their limits.
Method validation is completed to ensure that an analytical methodology is accurate,
specific, reproducible and rugged over the specified range that an analyte will be
analyzed. Method validation provides an assurance of reliability during normal use,
and is sometime referred to as "the process of providing documented evidence that the
method does what it is intended to do."
For method validation, these specifications are listed in USP Chapter <1225>, and can
be referred to as the "Eight Steps of Method Validation," as shown in figure below.
These terms are referred to as "analytical performance parameters", or sometimes
Dept of Pharmaceutical Analysis 24 EGS Pillay College of Pharmacy The USP Eight Steps of Method Validation
In response to this situation, one of the first harmonization projects taken up by the
ICH was the development of a guideline on the "Validation of Analytical Methods:
Definitions and Terminology." ICH divided the "validation characteristics" somewhat
differently, as outlined in Figure below
Dept of Pharmaceutical Analysis 25 EGS Pillay College of Pharmacy 1.4.9.3Method Validation Parameters
The developed methods were validated by following steps:
A. Accuracy
It is defined as closeness of agreement between the actual (true) value and mean
analytical value obtained by applying a test method number of times. Spike and
recovery studies are performed to measure accuracy: a known sample is added to the
excipients and the actual drug value is compared to the value found by the assay.
Accuracy is expressed as the bias or the % error between the observed value and the
true value (assay value/actual value x 100%).
The accuracy is acceptable if the difference between the true value and mean
measured value does not exceed the RSD values obtained for repeatability of the
method.
The parameter provides information about the recovery of the drug from sample and
effect of matrix, as recoveries are likely to be excessive as well as deficient.
Procedure:
Use a minimum of 3 spiking concentrations in the excipient solution. Prepare
two samples of each concentration. Test the 6 samples in triplicate on one run.
Measure expected vs. average measured value. Calculate the % recovery.
B. Precision
The precision of an analytical method is the degree of agreement among individual
test results when the method is applied repeatedly to multiple sampling of
homogenous sample.
Precision is the measure of the degree of repeatability of an analytical method under
Dept of Pharmaceutical Analysis 26 EGS Pillay College of Pharmacy (%RSD) or coefficient of variation (% CV) for a statistically significant number of
samples. According to the ICH, precision should be performed at three different
levels: repeatability, intermediate precision, and reproducibility.
Repeatability is the results of the method operating over a short time interval under
the same conditions (or) is the % RSD of multiple determinations of a single sample
in a single test run (intra-assay precision). It should be determined from a minimum of
nine determinations covering the specified range of the procedure (for example, three
levels, three repetitions each) or from a minimum of six determinations at 100% of
the test or target concentration.
Procedure :
Prepare three dilutions of the sample (high/medium/low concentrations in the
range).
Test 10 replicates of each dilution of the sample.
Calculate the average and standard deviation for each point on the curve.
Calculate the RSD for each point on the curve.
Intermediate precision is the results from within lab variations due to random events
such as different days, analysts, equipment, etc. In determining intermediate
precision, experimental design should be employed so that the effects (if any) of the
individual variables can be monitored (or) intermediate precision (also called
inter-assay precision) measures the % RSD for multiple determinations of a single sample,
controls and reagents analyzed in several assay runs in the same laboratory.
Procedure:
Prepare three dilutions of the sample (high/medium/low concentrations in the
Dept of Pharmaceutical Analysis 27 EGS Pillay College of Pharmacy Test triplicates of each dilution of the sample in three different assays.
Do for day-to-day variations
Do for lot-to-lot variations of assay materials
Do for technician-to-technician variation.
Calculate the average and standard deviation for each point on the curve for each
individual test.
Calculate the RSD for each point on the curve between the assay runs.
Reproducibility refers to the precision between laboratories usually in collaborative
studies and not directly relevant to assay validation in a manufacturing facility.
Documentation in support of precision studies should include the standard deviation,
relative standard deviation, coefficient of variation, and the confidence interval.
C. Specificity
It is the ability of an analytical method to assess unequivocally the analyte of interest
in the presence of components that may be expected to be present, such as impurities,
degradation products and matrix components. It is not possible to demonstrate that an
analytical procedure is specific for a particular analyte. In such case a combination of
two or more analytical procedure is recommended to achieve the necessary level of
discrimination. Lack of specificity of an individual analytical procedure may be
compensated by other supporting analytical procedures or tests.
In case of the assay, demonstration of specificity requires that the procedure is
unaffected by the presence of impurities or excipients. In practice, this can be done by
spiking the drug substances or product with appropriate levels of impurities or
excipients and demonstrating that the assay is unaffected by the presence of these
Dept of Pharmaceutical Analysis 28 EGS Pillay College of Pharmacy specificity may be demonstrated by comparing the test results of samples containing
impurities or degradation products to a second well-characterized procedure e.g.,
pharmacopoeia method or other validated analytical procedure (independent
procedure). These comparisons should include samples stored under relevant stress
conditions (e.g. light, heat humidity, acid/base hydrolysis, oxidation, etc.).
D. Limit of Detection
The limit of detection (LOD) is defined as the lowest concentration of an analyte in a
sample that can be detected, not quantitated. It is a limit test that specifies whether or
not an analyte is above or below a certain value. It is expressed as a concentration at a
specified signal-to-noise ratio, usually two- or three-to-one. The ICH has recognized
the signal-to-noise ratio convention, but also lists two other options to determine
LOD: visual non-instrumental methods and a means of calculating the LOD. The
method used to determine LOD should be documented and supported, and an
appropriate number of samples should be analyzed at the limit to validate the level.
Procedure
Prepare a standard concentration of the product in the appropriate solution.
Prepare a blank solution without any sample (zero concentration).
Perform the assay at least 3 times in duplicate according to the SOP.
Measure the amount present in the sample and blank.
Calculate the average for the sample and blank.
Calculate and standard deviation of the blank.
Dept of Pharmaceutical Analysis 29 EGS Pillay College of Pharmacy E. Limit of Quantitation
The Limit of Quantitation (LOQ) is defined as the lowest concentration of an analyte
in a sample that can be determined with acceptable precision and accuracy under the
stated operational conditions of the method. That is, as the LOQ concentration level
decreases, the precision increases. If better precision is required, a higher
concentration must be reported for LOQ.
Procedure:
The calculation method is again based on the standard deviation of the response (SD)
and the slope of the calibration curve (S) according to the formula: LOQ = 10(SD/S).
Again, the standard deviation of the response can be determined based on the standard
deviation of the blank, on the residual standard deviation of the regression line, or the
standard deviation of y-intercepts of regression lines.
F. Linearity :
It is the ability of an assay to obtain test results, which are directly proportional to the
concentration of an analyte in the sample. The determination of linearity will identify
the range of the analytical assay. It can be measured as slope of the regression line
and its variance or as the coefficient of determination (R2) and correlation
coefficient (R).
Procedure:
Determining the coefficient of correlation R for dilutions of the sample over the range
claimed for the assay.
1. Prepare 6 to 8 sample dilutions across the claimed range
2. Test each dilution in triplicate for 3 runs
Dept of Pharmaceutical Analysis 30 EGS Pillay College of Pharmacy 4. Analyze each set of dilutions as a linear curve and calculate R for each assay.
Alternative:
Calculate the accuracy and precision at each dilution. Range is the highest
and lowest concentration with satisfactory accuracy and precision.
If the validation study for an analytical test is well planned it should be possible to
design the protocol to consider many of the parameters in a single series of tests, for
instance: selectivity (specificity) linearity, range, accuracy and precision for a potency
test.
G. Range:
Range is the interval between the upper and lower levels of analyte (inclusive) that
have been demonstrated to be determined with precision, accuracy and linearity using
the method as written. If the relationship between response and concentration is not
linear, the range may be estimated by means of a calibration curve.
The range is normally expressed in the same units as the test results obtained by the
method. The ICH guidelines specify a minimum of five concentration levels, along
with certain minimum specified ranges. For assay, the minimum specified range is
from 80-120% of the target concentration. For an impurity test, the minimum range is
from the reporting level of each impurity, to 120% of the specification. (For toxic or
more potent impurities, the range should be commensurate with the controlled level).
H. Ruggedness:
Ruggedness, according to the USP, is the degree of reproducibility of the results
obtained under a variety of conditions, expressed as %RSD. The ruggedness of an
analytical method is the degree of reproducibility of test results obtained by the
Dept of Pharmaceutical Analysis 31 EGS Pillay College of Pharmacy laboratories, different analysts, different instruments, different lots of reagents,
different elapsed assay times, different assay temperatures, different days, etc.
I. Robustness:
ICH defines robustness as a measure of the method's capability to remain unaffected by
small, but deliberate variations in method parameters. Robustness can be partly assured
by good system suitability specifications. The evaluation of robustness should be
considered during the development phase and depends on the type of procedure under
study. It should show the reliability of an analysis with respect to deliberate variations
in method parameters. If the results of a method or other measurements are susceptible
to variations in method parameters, these parameters should be adequately controlled
and a precautionary statement included in the method documentation. One consequence
of the evaluation of robustness should be that a series of system suitability parameters
(e.g., resolution test) is established to ensure that the validity of the analytical
procedure is maintained whenever used.
Examples of typical variations are:
Stability of analytical solutions
Extraction time
In the case of liquid chromatography, examples of typical variations are
Influence of variations of pH in a mobile phase
Influence of variations in mobile phase composition
Different columns (different lots and/or suppliers)
Temperature
Flow rate.
Dept of Pharmaceutical Analysis 32 EGS Pillay College of Pharmacy Different columns (different lots and/or suppliers)
Temperature
Flow rate.
J. System Suitability Test (SST)
SST is commonly used to verify resolution, column efficiency, and repeatability of
the chromatographic system to ensure its adequacy for a particular analysis.
According to the United States pharmacopoeia (USP) and the International
Conference on Harmonization (ICH), SST is an integral part of many analytical
procedure.
Primary SST parameters are most important as they indicate system specificity,
precision and column stability. Other parameter include capacity factor (K) and signal
to noise ratio (S/N) for impurity peaks.
The USP chromatography general chapter states (USP 36–NF 31, 621 – Chromatography)
“System suitability tests are an integral part of gas and liquid chromatographic
methods. They are used to verify that the resolution and reproducibility of the
chromatographic system are adequate for the analysis to be done. The tests are based
on the concept that the equipment, electronics, analytical operations and samples to be
analyzed constitute an integral system can be evaluated as such.”
1.5 Interpretation Of Chromatograms
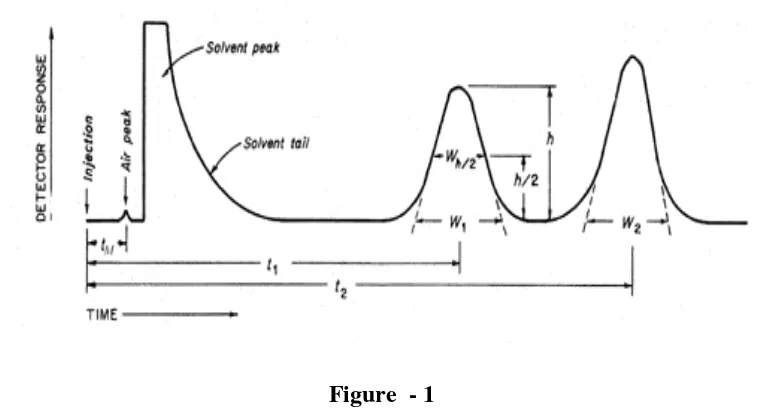
Figure below represents a typical chromatographic separation of two substances, 1 and
2, where t1 and t2 are the respective retention times; and h, h/2, and Wh/2 are the height,
Dept of Pharmaceutical Analysis 33 EGS Pillay College of Pharmacy the respective widths of peaks 1 and 2 at the baseline. Air peaks are a feature of gas
chromatograms and correspond to the solvent front in liquid chromatography.
Figure - 1
Chromatographic retention times are characteristic of the compounds they represent
but are not unique. Coincidence of retention times of a test and a reference
substance can be used as a feature in construction of an identity profile but is
insufficient on its own to establish identity. Absolute retention times of a given
compound vary from one chromatogram to the next.
1.5.1 Relative Retention times:
Relative retention time is calculated by the equation Rr = t2/t1
t2 = Retention time of test.
t1 = Retention time of reference substance, determined under identical
experimental conditions on the same column.
1.5.2 Relative Retention:
t2-tM
To calculate the relative retention (r) : --- t1-tM
[image:36.595.126.506.125.331.2]Dept of Pharmaceutical Analysis 34 EGS Pillay College of Pharmacy 1.5.3 Resolution (as per USP) :
The resolution, R, is a function of column efficiency, N, and is specified to ensure that
closely eluting compounds are resolved from each other, to establish the general
resolving power of the system, and to ensure that internal standards are resolved
from the drug.
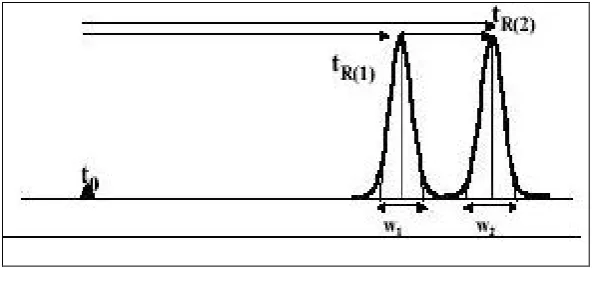
[image:37.595.125.422.209.352.2]Figure - 2
R is determined by the equation:
2(t2 - t1) R =
W2 + W1
Or
2(t2 - t1) R =
1.70 (W1, h/2 + W2,h/2)
t2 and t1 are the retention times of the two components.
W2 and W1 are the corresponding width at the bases of the peaks obtained by
extrapolating the relatively straight sides of the peaks to the base line.
Dept of Pharmaceutical Analysis 35 EGS Pillay College of Pharmacy 1.5.4 Resolution (as per Ph.Eur) :
Where, tR2 > tR1
tR2 and tR1 = Retention times or distances along the baseline from the point of injection to the perpendiculars dropped from the maxima of two adjacent peaks
Wh1 and Wh2 = peak width at half height
1.5.5 Theoretical Plates (as per USP and Ph.Eur)
Column efficiency also may be specified as system suitability requirements, especially
if there is only one peak of interest in the chromatograms. The number of the
theoretical plates, N, is a measure of column efficiency. It is calculated by the
equation.
t = Retention time of the substance.
w = width of the peak at its base, obtained by extrapolating the relatively
straight sides of the peak to the baseline.
w½ = Peak width at half-height.
1.5.6 Precision:
Precision a measure of either degree of reproducibility or of repeatability is
determined by making replicate injections of standard preparation and calculating
relative standard deviation. Unless otherwise specified in the individual monograph,
data from five replicate injections of the standard preparation are used to calculate 1.18(tR2 - tR1)
R =
Dept of Pharmaceutical Analysis 36 EGS Pillay College of Pharmacy the relative standard deviation (SR), if the requirement is 2.0% or less; data from six
replicate injections are used if the relative standard deviation requirement is more than
2.0%.
Relative Standard Deviation in percentage.
x = Arithmetic mean of the set.
xi = An individual measurement in a set of N measurements.
N = Number of individual values
1.5.7 Tailing Factor as per USP (or) Symmetry factor as per Ph.Eur:
Tailing factor, T, a measure of peak symmetry, is unity for perfectly symmetrical
peaks and its value increases as tailing factor is pronounced (Fig 1). In some cases
values less than unity may be observed. As peak asymmetry increases, integration and
hence precision becomes less reliable.
Figure - 3
W0.05 = Width of peak at 5% height.
f = Distance from the peak maximum to the leading edge of the peak, the distance is
Dept of Pharmaceutical Analysis 37 EGS Pillay College of Pharmacy 1.5.8 Capacity Factor (Mass distribution ratio):
Capacity factor k’ of a sample component is a measure of the degree which
that component is retained by the column relative to an unretained component
Capacity factor is k’ = (tr - t0) / t0
tr - is the elution time of retained component and
t0 - is the elution time of the unretained sample.
1.5.9 Signal to Noise Ratio: 2H S/N = ---
H Where,
H = Height of the peak corresponding to the component concerned, in the
chromatogram obtained with the prescribed reference solution, measured from the
maximum of the peak to the extrapolated baseline of the signal observed over a
distance equal to 20 times the width at half-height
h = Range of the background noise in a chromatogram obtained after injection or
application of a blank, observed over a distance equal to 20 times the width at half-
height of the peak in the chromatogram obtained with the prescribed reference solution
and, if possible, situated equally around the place where this peak would be found.
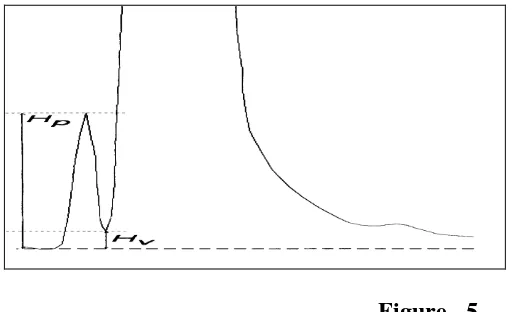
Dept of Pharmaceutical Analysis 38 EGS Pillay College of Pharmacy 1.5.10 Peak to valley ratio
The peak-to-valley ratio (p/v) may be employed as a system suitability requirement in
a test for related substances when baseline separation between 2 peaks is not reached
Hp = Height above the extrapolated baseline of the minor peak,
Hv = Height above the extrapolated baseline at the lowest point of the curve
separating the minor and major peaks.
Figure - 5
System Suitability Parameters and Recommendations: Parameter Recommendation
Capacity Factor (k’) The peak should be well-resolved from other peaks and the void volume, generally k’>2.0
Repeatability RSD </= 1% for N >/= 5 is desirable
Relative retention Not essential as long as the resolution is stated
Resolution Rs of > 2 between the peak of interest and the closest eluting.
Tailing Factor (T) T of </= 2
Theoretical
[image:41.595.106.362.303.459.2]Dept of Pharmaceutical Analysis 39 EGS Pillay College of Pharmacy 1.6 Statistical Parameters
1.6.1 Linear regression:
Once a linear relationship has been shown to have a high probability by the
value of the correlation coefficient ‘r’, then the best straight line through the data
points has to be estimated. This can often be done be done by visual inspection of the
calibration graph, but in many cases it is far more sensible to evaluate the best straight
line by linear regression (the method of least squares).
The equation of straight line is
y = mx + c
Where, y the dependent variable is plotted as result of changing x, the independent
variable.
To obtain the regression line ‘y on x’ the slope ‘m’ of the line and the intercept
‘c’ on the y axis are given by the following equation.
m = and c =
1.6.2 Correlation coefficient:
When the changes in one variable are associated or followed by changes in the other,
it is called correlation. To establish whether there is a linear relationship between two
variables x1 and y1, use Pearson’s correlation coefficient r.
r =
Where n is the number of data points.
The value of r must lie between +1 and -1, the nearer it is to +1, the greater the
probability that a definite linear relationship exists between the variables x and y,
Dept of Pharmaceutical Analysis 40 EGS Pillay College of Pharmacy correlation values of ‘r’ that tend towards zero indicate that x and y are not linearly
related (they made be related in a non-linear fashion).
1.6.3 Standard deviation:
The standard deviation measures the spread of the data about the mean value.
It is commonly used in statistics as a measure of precision statistics as a measure of
precision and is more meaningful than is the average deviation. It may be thought of
as a root-mean-square deviation of values from their average and is expressed
mathematically as
1 N x x S n i 1 i i
Where,S is standard deviation.
If N is large (50 or more) then of course it is immaterial whether the term in the
denomination is N -1 or N
Σ = sum
x = observed values
x = Mean or arithmetic average= X/N
x
-x = deviation of a value from the mean
N = Number of observations
1.6.4 Percentage relative standard deviation (%RSD):
It is also known as coefficient of variation CV. It is defined as the standard
deviation (S.D) expressed as the percentage of mean.
C 100 x S.D RSD % or
Dept of Pharmaceutical Analysis 41 EGS Pillay College of Pharmacy Where, S.D = standard deviation,
x = Mean or arithmetic average.
The variance is defined as S2 and is more important in statistics than S itself.
However, the latter is much more commonly used with chemical data.
1.6.5 Standard Error of mean (S.E.):
Standard error of mean can be defined as the value obtained by division of
standard deviation by square root of number of observations. It is mathematically
expressed as
n S.D. S.E.
Where, n = number of observations.
S.D = Standard deviation
1.7 Data elements required for assay validation:
It is not always necessary to evaluate every analytical performance parameter, as
different test methods require different validation schemes. The Most common
categories of assays for which validation data should be required are as follows:
i) Quantitation of major components or active ingredients.
ii) Determination of impurities or degradation compounds.
iii) Determination of performance characteristics
Category-I: Analytical methods for quantitation of major components of bulk drug substances or active ingredients (including preservatives) in finished pharmaceutical
products.
Category-II: Analytical methods for determination of impurities in bulk drug substances or degradation compounds in finished pharmaceutical products. These
Dept of Pharmaceutical Analysis 42 EGS Pillay College of Pharmacy Category-III: Analytical methods for determination of performance characteristics (e.g. dissolution, drug release).
The type of method and its intended use dictates which parameters are required to be
[image:45.595.96.538.209.496.2]investigated. They are illustrated in the following Table 6.
Table 6: Data elements required for assay validation Analytical
Performance Parameter
Assay Category-I
Assay category-II Assay Category-III
Quantitative Limit Test
Accuracy Yes Yes * *
Precision Yes Yes No Yes
Specificity Yes Yes Yes *
LOD No No Yes *
LOQ No Yes No *
Linearity & range Yes Yes No *
Ruggedness Yes Yes Yes *
*may be required, depending on the nature of specific test.
Table 7: Comparison of Analytical Parameters Required for Assay validation FDA reviewer Guidance USP General Chapter
<1225>
ICH Q2A Guidelines
Accuracy Accuracy Accuracy
Precision Repeatability Analysis Precision Precision
Intermediate precision No Intermediate
precision
[image:45.595.110.518.545.743.2]Dept of Pharmaceutical Analysis 43 EGS Pillay College of Pharmacy FDA reviewer Guidance USP General Chapter
<1225>
ICH Q2A Guidelines
Specificity /selectivity Specificity Specificity
Detection limit Detection limit Detection limit
Quantitation limit Quantitation limit Quantitation limit
Linearity Linearity Linearity
Range Range Range
No Ruggedness No
Robustness Robustness Robustness
System suitability sample solution
Dept of Pharmaceutical Analysis 44 EGS Pillay College of Pharmacy
2.0
LITERATURE REVIEW
2.1 Suneetha and Raja Rajeswari, IJPSR, 2015; Vol. 6(5): 1915-1923.,
Estimation of Teriflunomide Along with Concomitant Drugs in Different
Biological Matrices Using LC-MS/MS. Int J Pharm Sci Res 2015; 6(5):
1915-23.doi: 10.13040/IJPSR.0975-8232.6(5).1915-23.
The proposed validated method for the estimation of teriflunomide in different
biological matrices is highly sensitive and rapid compared to published reports.
The method offers significant advantages over those previously reported, in
terms of lower sample requirements, simplicity of extraction procedure without
any matrix effect. The efficiency of protein precipitation extraction and without
any interference from the concomitant drugs make it an attractive procedure in
bio analysis of teriflunomide.
The linear dynamic range established was adequate to measure the
concentration of teriflunomide in any preclinical and clinical study involving
different biological species. The concomitant drugs also can be estimated along
with the target analyte which is more advantageous than single compound