UNIVERSITY OF SOUTHERN QUEENSLAND
Ultraviolet radiation
reflection
from building materials:
Characterisation, quantification and
the resulting effects
A dissertation submitted by
Joanna Turner BSc. (Hons) (First Class)
For the award of
Doctor of Philosophy
i
Abstract
Ultraviolet (UV) radiation significantly influences many biological entities in the terrestrial biosphere. However, the amount of UV exposure can be affected by surfaces that reflect UV radiation. Knowledge about reflected UV radiation from surfaces in the built environment is limited, especially from vertical or other non-horizontal surfaces and the resulting effects of UV radiation reflection from these surfaces. The main aims of this research is comprised of (1) characterisation of UV radiation reflection from a variety of urban building materials in vertical positions, (2) quantification of the biological effect of UV reflection from simulated structures on a human and (3) establishing relationships between UV radiation measurement indicators and resulting biological effects.
ii
predominantly lower solar zenith angles. This produces an observable seasonal effect, creating a potential problem in cooler seasons than in warmer seasons due to human behaviour, where personal UV protection can be overlooked compared to thermal comfort. This study has shown that UV reflection from certain vertical surfaces will substantially enhance UV exposure to an individual, and reduce the time for an outdoor worker to exceed recommended UV exposure limits.
iii
CERTIFICATION OF DISSERTATION
I certify that the ideas, experimental work, results, analyses, software and conclusions reported in this dissertation are entirely my own effort, except where otherwise acknowledged. I also certify that the work is original and has not been previously submitted for any other award, except where otherwise acknowledged.
Signature of Candidate Date
ENDORSEMENT
Signature of Supervisor Date
iv
Acknowledgements
I would like to thank my supervisor Dr Alfio Parisi for guiding my through this mammoth task. He has guided me through projects ever since my undergraduate degree where I completed a small but interesting investigation on UV reflection from walls, which inevitably led me to this destination. The words of encouragement I received on a regular basis from Alfio has helped tremendously, when the little voice in my head started talking too loudly (about how I didn‟t really know what I was doing) and needed to be silenced.
I would like to thank my associate supervisor Dr Brad Carter, who despite coming from a slightly different discipline, has maintained an upbeat enthusiasm to encourage me through this entire process, and no doubt his distance from the project has helped to refine how I explain myself, rather than assume that he already knows what I am talking about.
Thank you to the Physics technical staff: Kim Larsen, who was happy to listen to my carping whilst helping me to search for equipment and inspiration, and Oliver Kinder who built some of the important equipment needed to complete my results.
Thank you to my co-conspirators Jenny Spence and Carolyn Brown, whose regular appearances in L113 kept me sane with discussions on the world we chose to put ourselves in (why was that again – of course, because we‟re physicists), life in general and the random shouted comments directed at our computers that resulted in many an interesting conversation.
Thanks to David Turnbull, Nathan Downs, and Peter Schouten, my predecessors who answered my questions even when I wasn‟t really sure what I was asking, and answering them again when I figured out what I really wanted to ask. Hopefully I in turn can do the same to those reaching this point.
A big thank you must go to my partner Darren, who has been with me through it all, thick and thin, despair and excitement and everything in-between. I don‟t think I can even estimate what I would be doing if you were not here with me.
Finally thanks to my family, who have watched me go from studious (and sometimes neurotic) high school student, to university graduate to present day. You provided support when I needed it, but did not let my head get too big either. These last few years have been the hardest on us, and even in the worst of it, we took the hard parts together as much as we could.
v
Table of Contents
Abstract ... i
CERTIFICATION OF DISSERTATION ... iii
Acknowledgements ... iv
Table of Contents ... v
List of Figures ... xii
List of Tables ... xix
List of Abbreviations ... xx
Glossary of frequently used terms ... xxi
1
Introduction and Literature Review ... 1
1.1 Introduction ... 1
1.2 Literature Review... 2
1.2.1 Ultraviolet radiation ... 2
1.2.1.1 Electromagnetic radiation ... 2
1.2.1.2 Ultraviolet radiation spectrum ... 4
1.2.2 Biological effects due to UV radiation ... 6
1.2.2.1 Beneficial biological effects to mankind ... 7
1.2.2.2 Hazardous biological effects to mankind... 10
1.2.2.2.1 Erythema ... 10
1.2.2.2.2 Skin changes – tanning, pigmentation and photoaging ... 13
1.2.2.2.3 Skin cancer ... 15
1.2.2.2.3.1 Non-melanoma ... 16
1.2.2.2.3.2 Malignant melanoma ... 17
1.2.2.2.4 Eye effects ... 19
1.2.2.2.5 Immune suppression ... 20
1.2.2.2.6 DNA damage, mutation and other effects ... 21
1.2.2.3 Ecological biological effects ... 22
1.2.3 Variations in UV radiation levels at the earth’s surface ... 23
1.2.3.1 Extraterrestrial UV ... 24
1.2.3.2 Geographical location ... 26
1.2.3.2.1 Altitude ... 26
1.2.3.2.2 Latitude and longitude ... 26
1.2.3.2.3 Seasonal variation ... 27
1.2.3.3 Solar zenith angle and solar azimuth angle ... 27
1.2.3.4 Ozone ... 28
vi
1.2.3.6 Scattering and absorption ... 35
1.2.3.6.1 Diffuse radiation ... 37
1.2.3.7 Albedo ... 38
1.2.4 Man-made influences on UV exposures to humans ... 43
1.2.4.1 Artificial UV sources ... 43
1.2.4.2 Shading ... 45
1.2.4.3 Occupation ... 46
1.2.4.4 Reflectivity ... 49
1.2.4.4.1 Specular vs. diffuse reflection ... 52
1.2.4.5 Personal protective equipment ... 54
1.2.5 Measurement of UV radiation ... 55
1.2.5.1 Broadband measurement ... 55
1.2.5.2 Spectral measurement ... 57
1.2.5.3 Dosimetry ... 58
1.2.6 UV reflectivity ... 61
1.2.6.1 Historical usage and measurement ... 61
1.2.6.2 Current knowledge and measurement ... 62
1.2.6.3 Albedo vs. reflectivity ... 64
1.3 Research objectives ... 65
2
Methodology ... 67
2.1 Overview ... 67
2.2 Quantification of UV reflection from metal surfaces due to multiple factors ... 67
2.3 Quantification of biological effect of UV exposure due to UV reflective surfaces ... 72
2.3.1 Dosimetry ... 72
2.3.2 UV exposure measurement ... 75
2.3.2.1 Walls ... 75
2.3.2.2 Walls at vertices – corners ... 77
2.3.2.3 Wall orientation – vertical, inclined and horizontal ... 79
2.3.3 Spectral reflectance measurement ... 80
2.3.3.1 Calibrating the USB4000 spectrometer ... 82
2.3.3.2 Characterising spectral reflectance ... 83
2.4 Quantification of relationship between horizontal and vertical reflectivity ... 84
2.5 Establishing a UVI factor for UV reflective surfaces ... 84
vii
3
Results... 86
3.1 Overview ... 86
3.2 Quantification of UV reflection from metal surfaces due to multiple factors ... 86
3.2.1 Preliminary measurements ... 86
3.2.1.1 Distance ... 86
3.2.1.2 Orientation ... 89
3.2.1.3 Time of day and position of sun in sky ... 92
3.2.2 Investigative measurements of different surface types ... 93
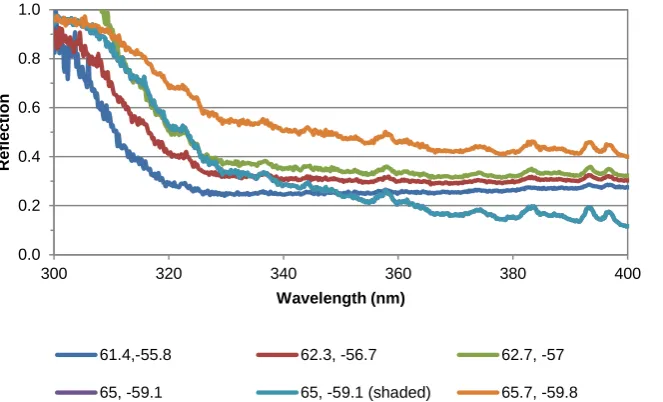
3.2.2.1 Zinc aluminium trapezoidal ... 94
3.2.2.2 All other surface types measured ... 98
3.2.3 Repeated experiments... 101
3.2.3.1 Zinc aluminium trapezoidal ... 102
3.2.3.2 Zinc aluminium corrugated ... 107
3.2.3.3 Cream trapezoidal ... 109
3.2.3.4 Cream corrugated ... 111
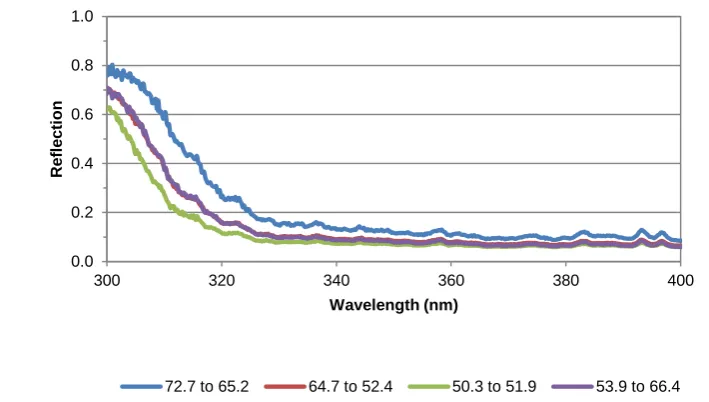
3.2.3.5 Pale green trapezoidal ... 113
3.2.3.6 Remaining surface types ... 116
3.2.4 Other surface types in situ... 117
3.2.4.1 Non-vertical surfaces ... 117
3.2.4.1.1 Galvanised steel ... 117
3.2.4.1.2 Grey coated trapezoidal ... 118
3.2.4.1.3 Transparent plastic ... 118
3.2.4.2 Vertical surfaces ... 119
3.2.4.2.1 Tinted glass ... 119
3.2.4.2.2 White painted fibro board ... 120
3.2.4.2.3 Red brick ... 121
3.3 Quantification of biological effect of UV exposure due to vertical UV reflective surfaces ... 122
3.3.1 Investigating influence of reflective wall surfaces on UV exposure in Autumn 2008 ... 123
3.3.1.1 Zinc aluminium trapezoidal ... 123
3.3.1.2 Pale green trapezoidal ... 125
3.3.1.3 Cream trapezoidal ... 126
3.3.1.4Comparing influence of erythemal exposure due to presence of vertical surfaces ... 127
viii
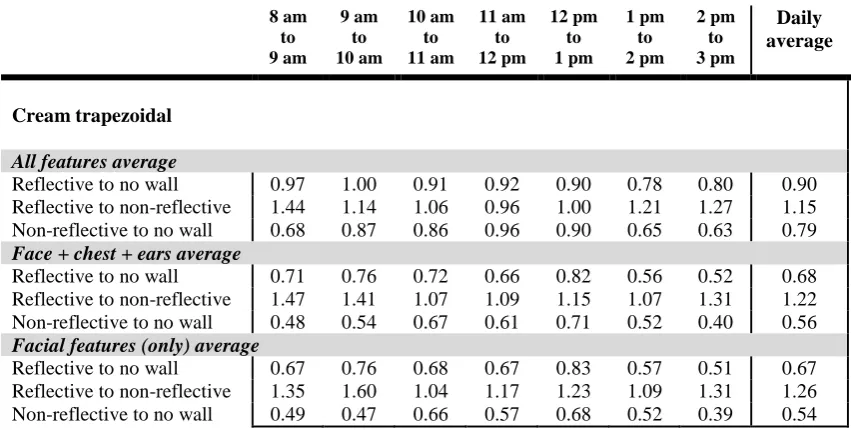
3.3.2.1 Cream trapezoidal ... 129
3.3.3 Investigating influence of reflective wall surfaces on UV exposure in Spring 2008 ... 130
3.3.3.1 Zinc aluminium corrugated ... 130
3.3.3.2 Zinc aluminium trapezoidal ... 133
3.3.3.3 Comparison of surface type for Spring 2008 ... 134
3.3.4 Repeat of zinc aluminium trapezoidal Spring 2010 ... 136
3.3.5 Quantification of biological effect of UV exposure due to vertical, inclined or horizontal UV reflective surfaces ... 137
3.3.5.1 Zinc aluminium trapezoidal ... 137
3.3.5.1.1 North facing surfaces ... 137
3.3.5.1.2 East and west facing surfaces ... 138
3.3.5.2 Pale green trapezoidal ... 139
3.3.5.3 Comparison between surface types and orientations ... 140
3.3.6 Quantification of biological effect on UV exposure due to UV reflective surfaces positioned at vertical vertices. ... 142
3.3.6.1 Zinc aluminium trapezoidal ... 142
3.3.6.2 Pale green trapezoidal ... 142
3.3.6.3 Comparison between surface types ... 143
3.3.7 Quantification of biological effect on UV exposure due to non-metallic UV reflecting surfaces ... 146
3.3.7.1 White painted fibro board ... 146
3.3.7.2 Red brick ... 147
3.3.7.3 Comparison between surfaces ... 148
3.4 Quantification of relationship between horizontal and vertical reflectivity ... 149
3.4.1 Zinc aluminium trapezoidal ... 149
3.4.2 Pale green trapezoidal ... 150
3.5 Establishing a UVI factor for UV reflective surfaces ... 151
3.6 Resolving contributions of direct and diffuse UV radiation for effective reflectivity measurements ... 153
4
Discussion ... 158
4.1 Overview ... 158
4.2 Quantification of UV reflection from metal surfaces due to multiple factors ... 158
4.2.1 Preliminary spectral reflection measurements ... 159
4.2.1.1 Distance ... 160
4.2.1.2 Orientation ... 162
ix
4.2.2 Surface type ... 164
4.2.3 Repeated spectral reflection measurements ... 168
4.2.3.1 Refining the reflection measurement technique ... 171
4.2.3.2 Observations in repeated spectral reflection measurements ... 173
4.2.3.2.1 Zinc aluminium trapezoidal ... 173
4.2.3.2.2 All other metal surface types ... 175
4.2.3.2.3 Non vertical surfaces in situ ... 178
4.2.3.2.4 Vertical surfaces in situ ... 179
4.3 Quantification of biological effect of UV exposure due to vertical UV reflective surfaces ... 181
4.3.1 Influence of reflective walls ... 183
4.3.1.1 Zinc aluminium trapezoidal Autumn 2008 ... 183
4.3.1.2 Pale green trapezoidal Autumn 2008 ... 187
4.3.1.3 Cream trapezoidal Autumn 2008 ... 188
4.3.1.4 Dosimeter position comparison Autumn 2008 ... 189
4.3.1.5 Cream trapezoidal Winter 2008 ... 190
4.3.1.6 Zinc aluminium corrugated Spring 2008 ... 191
4.3.1.7 Zinc aluminium trapezoidal Spring 2008 and 2010... 193
4.3.1.8 Dosimeter comparison of Spring 2008 ... 195
4.3.2 Comparison of vertical, horizontal or inclined reflective surface influence on erythemal exposure ... 196
4.3.2.1 Zinc aluminium trapezoidal ... 196
4.3.2.1.1 North facing ... 196
4.3.2.1.2 East and west facing ... 197
4.3.2.2 Pale green trapezoidal ... 199
4.3.2.3 Comparison of surface type reflection ... 199
4.3.3 Influence of reflective vertices on erythemal exposure ... 201
4.3.3.1 Zinc aluminium trapezoidal ... 201
4.3.3.2 Pale green trapezoidal ... 203
4.3.4 Influence of non-metallic UV reflecting surfaces... 205
4.3.4.1 White painted fibro board ... 205
4.3.4.2 Red brick ... 206
4.3.4.3 Comparing the two non-metallic surfaces ... 206
4.4 Quantification of relationship between horizontal and vertical reflectivity ... 207
4.4.1 Zinc aluminium trapezoidal ... 207
4.4.2 Pale green trapezoidal ... 208
x
4.6 Resolving contributions of direct and diffuse UV radiation for effective
reflectivity measurements ... 212
5
Conclusions ... 218
5.1 Quantification and analysis of reflection due to vertical surfaces ... 218
5.2 Analysis of relationship between vertical and horizontal reflection.. 220
5.3 Quantification of the biological effect due to influence from vertical surfaces ... 220
5.4 Calculating a UVI factor ... 221
5.5 Accounting for the direct and diffuse UV components in UV reflection ... 222
5.6 Future Directions ... 222
6
List of References ... 225
7
Appendices ... 249
7.1 Preliminary measurements of different surface types spectral reflection .. ... 249
7.1.1 Zinc aluminium corrugated ... 249
7.1.2 Beige trapezoidal ... 250
7.1.3 Cream trapezoidal ... 252
7.1.4 Cream corrugated ... 253
7.1.5 Medium blue trapezoidal ... 254
7.1.6 Insultec coated (zinc aluminium) trapezoidal ... 255
7.1.7 Black trapezoidal ... 257
7.1.8 Dark red trapezoidal ... 258
7.1.9 Pale green trapezoidal ... 259
7.2 Remaining surface types – repeated measurements ... 261
7.2.1 Insultec coated trapezoidal ... 261
7.2.2 Beige trapezoidal ... 262
7.2.3 Dark green trapezoidal ... 263
7.2.4 Dark green corrugated ... 265
7.2.5 Black trapezoidal ... 266
7.2.6 Dark red trapezoidal ... 267
7.2.7 Medium blue trapezoidal ... 269
7.3 UVI charts ... 271
7.3.1 Zinc aluminium trapezoidal ... 271
7.3.1.1 Autumn 2008 ... 271
7.3.1.2 Spring 2008 ... 272
7.3.1.3 Spring 2010 ... 273
xi
7.3.2 Zinc aluminium corrugated ... 275
7.3.2.1 Early spring 2008 ... 275
7.3.3 Pale green trapezoidal ... 276
7.3.3.1 Autumn 2008 ... 276
7.3.3.2 Autumn 2009 (corner) ... 277
7.3.4 Cream trapezoidal ... 278
7.3.4.1 Autumn 2008 ... 278
7.3.4.2 Winter 2008 ... 279
7.3.5 Zinc aluminium finished surface walls ... 280
7.3.6 Paint coated surfaces ... 281
8
Previously Published Articles... 282
8.1 Reflected solar radiation from horizontal, vertical and inclined surfaces: Ultraviolet and visible spectral and broadband behaviour due to solar zenith angle, orientation and surface type ... 283
xii
List of Figures
Figure 1.1 - CIE erythemal action spectrum (CIE 1987). ... 11
Figure 2.1 - Experiment set up for reflected irradiance measurements for various SZA and azimuth for a vertical sheet and a sheet inclined at 35° to the horizontal. The photo on the right also shows the horizontal sheet. Ground UV reflectance 1% measured for set up on the left, up to 3% for set up on the right. ... 68
Figure 2.2 – Constructed walls and head forms (left) and standalone head form (right) with shading due to the position of the sun... 76
Figure 2.3 – Measuring UV exposure to a head form inside a right angled corner wall junction. ... 79
Figure 2.4 - (a) UV exposures measured for vertical, inclined and horizontal surface fixtures. (b, c) Shading caused by head form placement. ... 80
Figure 2.5 - Sensor direction for irradiance measurements. ... 81
Figure 3.1 - Reflected UV irradiance over a ridge compared to reflected UV irradiance over a flat surface. ... 87
Figure 3.2 – UV irradiance measured from centre of trapezoidal surface at varying distances. ... 87
Figure 3.3 - Global and reflected spectral UV irradiance measured at 0.5 m and 1.0 m for vertical north facing zinc aluminium trapezoidal surface. ... 88
Figure 3.4 - Reflection per wavelength at 0.5 m and 1.0 m sensor distance for vertical north facing zinc aluminium trapezoidal surface. ... 88
Figure 3.5 – Reflected spectral UV irradiance measured from vertical surface facing the compass points at 0.5 m. ... 89
Figure 3.6 - Reflected spectral UV irradiance measured from vertical surface facing compass points at 1.0 m. ... 90
Figure 3.7 - Reflection (ratio compared to global irradiance) measured from vertical surfaces facing compass points at 0.5 m. ... 90
Figure 3.8 - Reflection measured from vertical surfaces facing compass points at 1.0 m. ... 90
Figure 3.9 - Measurement of global spectral UV irradiance and reflected UV irradiance from north facing vertical and horizontal surfaces from 58.5° to 59.1°. ... 91
Figure 3.10 - Reflection measured for vertical north facing and horizontal surfaces at 58.5° to 59.1°. ... 92
Figure 3.11 - Reflection from north facing vertical zinc aluminium trapezoidal for the SZA and SAA listed. ... 92
Figure 3.12 - Reflection from horizontal zinc aluminium trapezoidal for the SZA and SAA listed. ... 93
Figure 3.13 - Reflection from north facing zinc aluminium trapezoidal vertical surface for the SZA and SAA listed. ... 94
Figure 3.14 - Reflection from a horizontal zinc aluminium trapezoidal surface at various SZA and SAA. ... 94
Figure 3.15 - Variation in horizontal reflection with changing SZA and SAA per wavelength (range from 73.4, 57.9 early morning to 46.1, 359 midday to 61.3, 314 mid afternoon). Averaged from Figure 3.14. ... 96
Figure 3.16 - Reflection from inclined north facing zinc aluminium trapezoidal at various SZA and SAA. ... 96
Figure 3.17 - Average reflection per wavelength north facing for inclined and vertical for various SZA and SAA. ... 96
Figure 3.18 - Average reflection per wavelength for east facing inclined and vertical surfaces. ... 97
Figure 3.19 - Average reflection per wavelength for south facing vertical and inclined surfaces. ... 97
Figure 3.20 - Average reflection per wavelength for west facing vertical and inclined surfaces. ... 97
Figure 3.21 – Multiple spectral reflection measurements with respect to global measured UV irradiance taken over several hours in Autumn 2008. ... 101
Figure 3.22 – Multiple spectral reflection measurements with respect to total measured UV irradiance taken over several hours in Autumn 2008. ... 101
Figure 3.23 - Reflection from zinc aluminium trapezoidal vertical north facing surfaces for varying SZA and SAA in Winter 2010. ... 102
Figure 3.24 - Reflection from zinc aluminium trapezoidal horizontal surface for varying SZA and SAA in Winter 2010. ... 102
xiii
xiv
xv
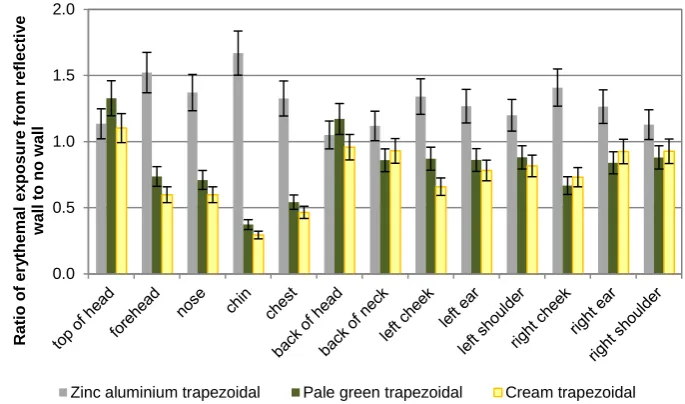
Figure 3.75 – Average daily ratio of erythemal exposure due to a reflective wall compared to no wall for individual dosimeter positions on a head form, for a zinc aluminium trapezoidal wall (Autumn 2008) and corner (Autumn 2009). ... 145 Figure 3.76 - Comparison between relative average erythemal exposures of three groups (consisting of thirteen, eight and five respectively) measured for a corner (vertice) in Autumn 2008 and a wall in Autumn 2009 for pale green trapezoidal over hourly intervals. ... 145 Figure 3.77 - Average erythemal exposure of three groups (consisting of thirteen, eight and five respectively) dosimeters per head form for white painted fibro board wall, non-reflective wall and no wall over hourly intervals. ... 146 Figure 3.78 - Average erythemal exposure of three groups (consisting of thirteen, eight and five respectively) dosimeters per head form for red brick wall, non-reflective wall and no wall over hourly intervals. ... 147 Figure 3.79 – Vertical erythemal reflection compared to horizontal erythemal reflection for same SZA and SAA for each pair of vertical and horizontal erythemal reflection values for zinc aluminium trapezoidal. ... 149 Figure 3.80 - Vertical erythemal reflection compared to inclined erythemal reflection for same SZA and SAA for each pair of vertical and inclined erythemal reflection values for zinc aluminium
trapezoidal. ... 150 Figure 3.81 – Vertical erythemal reflection compared to horizontal erythemal reflection for same SZA and SAA for each pair of vertical and horizontal erythemal reflection values for pale green
trapezoidal. ... 150 Figure 3.82 - Vertical erythemal reflection compared to inclined erythemal reflection for same SZA and SAA for each pair of vertical and inclined erythemal reflection values for pale green trapezoidal. ... 150 Figure 3.83 – Erythemal exposure (SED) correlated to average hourly UV Index for exposures influenced by zinc aluminium coated steel surfaces (trapezoidal and corrugated) for all over exposure to more specific exposures. ... 152 Figure 3.84 - Erythemal exposure (SED) correlated to average hourly UV Index for exposures influenced by paint coated steel surfaces (pale green and cream trapezoidal) for all over exposure to more specific exposures. ... 153 Figure 3.85 – Diffuse reflection from (a) zinc aluminium corrugated and (b) cream corrugated for horizontal, vertical and inclined surfaces. ... 154 Figure 3.86 – Diffuse reflection from (a) zinc aluminium trapezoidal and (b) cream trapezoidal for horizontal, vertical and inclined surfaces. ... 154 Figure 3.87 – Diffuse reflection (19 October 2010), total reflection (18 October 2010), and diffuse reflected UV irradiance relative to total UV irradiance comparison from zinc aluminium trapezoidal. ... 155 Figure 3.88 – Spectral irradiance measurements used to calculate the diffuse (19 October 2010) and direct (18 October 2010) spectral reflection in Figure 3.87. ... 155 Figure 3.89 – Diffuse reflection ratio compared to ratio of: UV irradiance measured with sensor oriented in the same direction as a vertical wall sensor (but without a nearby wall) to global UV irradiance. ... 156 Figure 3.90 - Measurement of reflection from an inclined galvanised surface with sensor placed horizontally above the surface, and also placed 45° to the horizontal (SZA range 50° to 60°, SAA range -60° to -70°). ... 157 Figure 4.1 – Orientations of the sensor for global irradiance measurements and reflected spectral measurements from different surface inclinations, relative to the position of the sun. ... 169 Figure 4.2 – Approximate surface areas exposed to UV irradiance from global (down welling) irradiance measurements relative to different SZA. ... 170 Figure 4.3 – Erythemal reflection ratios for all paint coated surfaces for a vertical north facing surface. ... 177 Figure 4.4 – Comparison of the ratio of erythemal exposures from head form near a cream
xvi
xvii
xviii
xix
List of Tables
Table 1.1 – Fitzpatrick skin type table compiled from Holick & Jensen (2003), ICNIRP (2007) and Diffey (1991). ... 13 Table 1.2 – Summary of all albedo measurements from published results. ... 41 Table 1.3 - Summary of all albedo measurements from published results continued. ... 42 Table 3.1 - Average reflection for five surface types at different orientation, and time of day, taken at 320 nm in the spectral range due to maximum or minimum reflection occurring at this wavelength. . 99 Table 3.2- Average reflection for five surface types at different orientation, and time of day, taken at 320 nm in the spectral range due to maximum or minimum reflection occurring at this wavelength. 100 Table 3.3 - Comparison of the ratios of average erythemal exposure received for head forms located near reflective wall, non-reflective wall and no wall, for different dosimeter average groupings in Autumn 2008. ... 128 Table 3.4 – Ratios of average erythemal exposure received for head forms located near cream trapezoidal reflective, non-reflective and no wall, for different dosimeter groupings, Winter 2008. 130 Table 3.5 - Comparison of the ratios of average erythemal exposure received for head forms located near reflective wall, non-reflective wall and no wall, for different dosimeter average groupings in Spring 2008. ... 135 Table 3.6 – Ratios of average erythemal exposure received for head forms located near zinc
xx
List of Abbreviations
BCC Basal cell carcinoma DNA Deoxyribonucleic acid
DT Delayed tanning
FM Frequency modulated
IPD Immediate pigment darkening OMI Ozone monitoring instrument NMSC Non melanoma skin cancer
RB Robertson-Berger
SAA Solar azimuth angle SCC Squamous cell carcinoma SZA Solar zenith angle
UV Ultraviolet
xxi
Glossary of frequently used terms
Action spectrum A function that represents the effectiveness of each wavelength or interval in any part of or all of the solar electromagnetic spectrum at producing a photochemical or photobiological reaction.
Actinic keratosis Excessive growth of skin layers (usually hard to the touch) from over-exposure to ultraviolet radiation.
Dose Amount of radiation someone or something is exposed to (as in absorbed dose) measured in energy per unit area.
Dosimeter A device that measures radiation exposure (“dose meter”). Dosimetry The use of a device called a dosimeter to measure radiation
exposure.
Diffuse (radiation) Radiation that has undergone scattering, with longer path lengths than shortest path between a radiation source and a receiver, and can be incident from any direction.
Diffuse (reflection) Radiation penetrating the boundary of a surface and
undergoing reflection (via elastic collisions) by one or more particles or molecules, resulting in radiation leaving the surface independently of the angle of incidence.
Direct (radiation) Radiation that travels in the shortest path possible between the radiation source and a surface or receiver.
Global (radiation) Total radiation measured when a receiver is oriented on a horizontal surface, indicating that all radiation in the
hemisphere above the receiver (direct and diffuse) is included in the measurement.
Erythema Inflammation and oedema of the skin due to photochemical reactions caused by ultraviolet irradiance (commonly known as sunburn).
xxii Minimum erythemal dose
The smallest amount of erythemal ultraviolet radiation required for people with skin type I (fair skin) to cause barely perceptible erythema (equivalent on average to 200J/m2). Photokeratitis Painful inflammation of the eye (specifically the cornea) due
to over-exposure to intense or prolonged ultraviolet radiation exposure.
Radiation (Electromagnetic) radiation is the energy produced by propagation of oscillating electric and magnetic fields due to accelerating electric charge.
Specular (reflection) Radiation reflected at the immediate boundary of a surface, with the reflected angle dependent on the incident angle. Solar zenith angle The angle between the top of the celestial hemisphere and the
position of the sun on the arc between the top of the sphere and the horizon (the top of the sphere is 0° and usually the horizon is 90°).
Solar azimuth angle The angle the sun makes between true north and any point heading clockwise around the compass points (true north is 0° and becomes 360° after one full revolution around the
compass points). In some cases negative values (0° to -90°) from true north might be used to keep all solar azimuth angles within the northern quadrants with measurements in the southern hemisphere.
Standard erythemal dose
An exact dose of 100J/m2 of erythemal ultraviolet radiation. Total (radiation) Total radiation measured when a receiver is oriented on a
plane that is normal to the radiation source, indicating that all radiation (direct and diffuse) in the path between source and the receiver is included in the measurement.
1
1
Introduction and Literature Review
1.1
Introduction
In the field of ultraviolet (UV) radiation monitoring and UV dose exposure measurement, the ability to account for factors that influence these measurements is becoming more and more important. The importance of this knowledge is dictated by the need for better understanding of the effects of UV radiation in the biosphere (Blumthaler 1993; Seidlitz & Krins 2006). Cohen (2003) predicted some years ago that more than half of the population of the world will live in cities by the end of this decade. We are now at that point in the decade and while this number has not yet been confirmed, it is accepted that the majority of the world‟s population now live in or near urban centres. Therefore, measurement in UV radiation and dose monitoring should be taking into account factors specific to urban environments, yet the body of knowledge on this topic, specifically that on reflective surfaces in vertical structures remains small.
2
times are increased. The biological effects of UV radiation is a large research area, but the influencing factors affecting UV radiation fluctuation in an urban setting, which is where a significant proportion of the population dwells, is not so well understood. In order to be able to take preventative action against harmful biological effects of UV radiation on humans, this influence of urban factors needs to be researched.
Those most affected by UV radiation in their lifetimes, are people who spend their working hours outdoors. In particular, workers in the construction industry, who handle UV reflective surfaces, will be most prone to UV radiation effects on their health. In order to advise such workers on preventative measures from excessive UV exposure in these situations, it is necessary to quantify the effects of UV radiation reflective surfaces and resulting exposures. In addition, modellers who seek to predict UV radiation levels in urban environments will be able to incorporate this information in order to improve the resulting models. At the same time, an attempt to better understand the interactions between UV radiation and UV reflective surfaces will be conducted, so that choices in selecting building materials that are dependent on UV reflectivity can be made if necessary.
1.2
Literature Review
1.2.1
Ultraviolet radiation
1.2.1.1 Electromagnetic radiation
3
the photo dissociation of water vapour releasing oxygen into the atmosphere (Tevini 1993) around two billion years ago. This reaction (as well as many other photochemical reactions) resulted in chemical compounds important to the development of life. According to classical physics, electromagnetic radiation is defined as the “energy resulting from the acceleration of electric charge and the associated electric fields and magnetic fields” (Isaacs 1996). Electromagnetic radiation is thus a form of energy and can be described conceptually and mathematically as a self propagating wave of oscillating electric and magnetic fields. Modern physics dictates that electromagnetic radiation can also be understood in terms of photons, which are discrete quantities of energy with particle characteristics. The energy of electromagnetic radiation is defined quantitatively as where f is defined as the frequency of the wave of the electromagnetic radiation and h is Planck‟s constant. Using the classical characteristics of a wave, the frequency of a wave is inversely proportional to its wavelength (λ) and together is related by the speed of the wave. The speed of electromagnetic radiation in a vacuum is constant (c = 2.998×10⁸ms-1) and thus the relationship is . It stands to reason that simple substitution of this latter equation into the former can show the dependence of energy of electromagnetic radiation on the characteristic wavelength as . Electromagnetic radiation energy can be referred to by its characteristic wavelength or frequency. In UV radiation research, the energy involved is described using wavelength, as used in Parisi, Sabburg & Kimlin (2004a).
4
wavelength versus wavelength of the solar output (Webb 1998b) resembles black body radiation curves (Serway, Moses & Moyer 1997) and when plotted for the temperature of the sun and compared to intensity of spectral irradiance at the top of the atmosphere only vary by small amounts (Lenoble 1993a). As a result of these solar emissions, the peak wavelength emitted is found in the visible part of the solar spectrum, but the emission curve reaches to as low as 200 nm and as high as 3000 nm, hence the spectrum reaches to the lower and upper regions of the ultraviolet and infrared wavebands. This range is applicable to radiation at the top of the earth‟s atmosphere. As the electromagnetic radiation travels through the earth‟s atmosphere, it is attenuated. The various mechanisms involved in the attenuation of the solar radiation will be discussed later in this thesis.
Evolution has led to human eyesight matched to the narrow visible spectrum in which solar radiation is the most abundant, whilst our bodies can feel infrared radiation as heat. On the other hand, UV radiation cannot be immediately detected, leaving humans with biological mechanisms that have only delayed responses. So despite the fact that UV radiation is the most damaging biologically of all the solar radiation received at the earth‟s surface, our bodies have no immediate way to sense it. Therefore, we must devise alternate ways to detect and measure UV radiation in order to understand its influences on biological mechanisms.
1.2.1.2 Ultraviolet radiation spectrum
5
atmosphere‟s attenuation, not all UV radiation reaches the earth‟s surface, and therefore the UV spectrum is further divided. The spectrum was first divided into the following wavebands and respective names:
UVC - 100 nm to 280 nm UVB - 280 nm to 315 nm UVA – 315 nm to 400 nm
Although these divisions were made arbitrarily at the Second International Congress of Light in 1932 (Diffey 2002b), the literature review presented here suggests that the divisions were the result of some initial understanding of spectral biological effectiveness. Today, as Diffey (2002b) points out, the wavebands of interest are dependent on the principle research area involved and may change accordingly, for example, environmental and dermatological photobiologists use the following divisions:
UVC – 100 nm to 290 nm UVB – 290 nm to 320 nm UVA – 320 nm to 400 nm
6
between disciplines and therefore some comparability (the former presented waveband divisions).
At the top of the atmosphere, UV radiation only accounts for between 8 to 9 % of all solar radiation with UVC, UVB and UVA comprising 0.5%, 1.5% and 6.3% respectively (Frederick, Snell & Haywood 1989). Once this radiation passes through the atmosphere it is attenuated further. Terrestrial UV radiation is made up of UVB and UVA radiation, with all UVC radiation completely absorbed in the stratospheric part of the earth‟s atmosphere (at a height of approximately 40 km) by ozone and molecular oxygen (Webb 1998b). Some UVB radiation is also absorbed by ozone in the stratosphere, but not all (Madronich et al. 1998) while only minimal amounts of UVA are absorbed by ozone (Kerr et al. 2002). The amount of UVB radiation reaching the earth‟s surface is primarily dependent on ozone, and therefore is variable due to the variable nature of ozone concentrations. This also leads to variation in the lower cut-off wavelengths reaching the earth‟s surface, due to a combination of ozone and other seasonal effects. Therefore, most photobiological studies restrict themselves to using UVB and UVA wavebands, which are the biologically effective wavelengths that reach the earth‟s surface.
1.2.2
Biological effects due to UV radiation
7
describes this ability to break molecular bonds through the UV absorptive capabilities of molecules and explains how each waveband affects different molecules. Wavelengths shorter than 180 nm are absorbed easily by air – sometimes this UV waveband is called vacuum UV radiation. UVC radiation is actinic in nature, meaning that is causes photochemical reactions. UVC radiation is absorbed by some types of amino acids and proteins, while UVB radiation is less actinic than UVC radiation. However, because it is absorbed less easily, UVB radiation penetrates further into human tissue. The point at which some UVB is absorbed is below the outer layer of the skin, which assists its ability to produce photobiological effects in the body. UVB is considered the most photocarcinogenic of all UV radiation since UVC radiation is not found naturally in the lower atmosphere. UVA radiation is absorbed the least effectively by human tissue, which means it can penetrate further than UVB radiation, but it is also much less photobiologically active. However, the largest penetration depth for UV radiation does not exceed 1mm (Sliney & Chaney 2006). Despite the variation in influence to photobiological effects, UV radiation is considered more hazardous than beneficial, if only due to humans‟ lack of immediate automatic biological sensitivity to UV radiation. The following sections will discuss both the hazards and benefits of solar terrestrial UV radiation, a topic frequently studied (McCarthy 2004; McKenzie, Liley & Bjorn 2009).
1.2.2.1 Beneficial biological effects to mankind
8
1940). In the early part of the twentieth century, the discovery that sunlight and specifically UV radiation could help cure people who suffered from rickets, tuberculosis and psoriasis led to the building of solaria so that patients could recover more fully from these diseases (Holick & Jenkins 2003a). Rickets is defined as a disease where bones do not form correctly due to lack of vitamin D3 and therefore a
lack of calcium in the human body. Rajakumar (2003) explains how rickets was noted historically in ancient medical writings and first studied around 1650, but it wasn‟t until large outbreaks of the disease occurred in the late 19th
century and early 20th century in industrialized cities that experiments revealed that lack of sunlight and poor diet were causative factors (Unknown 1922). As a result of extensive studies, an anti-richitic was identified and given a name: Vitamin D (Rajakumar 2007). This was found to be in cod-liver oil. Eventually, through extensive experimenting, the link between sunlight and vitamin D, or more correctly vitamin D3 production was determined (Atkins 1938; Rajakumar 2007).
It is apparent then that humans obtain vitamin D from their diet or from exposure to UV radiation in the atmosphere. However, over ninety percent of vitamin D3 in a
person‟s diet is produced through exposure to sunlight (Holick 2003b). Interestingly, vitamin D found in food is not exactly the same as vitamin D3 endogenously
produced from UV irradiance on human skin. UVB radiation, the waveband important to vitamin D3 production, when incident on the skin, starts a series of
chemical reactions. UVB radiation must be absorbed by a molecule called 7-dehydrocholesterol (7DHC), which causes the rearrangement of double bonds (photoisomerisation) to produce pre-vitamin D3 (Webb 2006). This product in turn
undergoes heat isomerisation which eventually produces vitamin D3 (which takes
9
itself is not biologically active, therefore it must undergo further reactions in the body to convert it to a hormone that the body can use (De Gruijl 2000a). In other words, vitamin D3 is really a hormone and not a vitamin (Webb 1993). Despite its
ambiguous name, the fact remains that vitamin D3 is important to humans for the
absorption of calcium, which is necessary for good bone health (Holick 2004a) and hence important to the cure for rickets. Holick (2004a) reports that a person who is vitamin D3 deficient results in only 10-15% calcium being absorbed by the small
intestine, while a non-deficient vitamin D3 person will absorb 30% and providing this
continues, can increase to 80% absorption.
In the past few decades, when the detrimental effects due to UV radiation was becoming more and more pronounced compared to the beneficial effects, the message sent to the public from health and government organisations about UV radiation was that it was very harmful and that sunlight exposure should be minimized. This was particularly true for people of European descent living in areas of the world with high ambient UV radiation and whom the campaigns were mostly targeting due to their skin type. As a result from the campaigns of sun awareness, an increase in vitamin D3 deficiency has been observed. Many studies have looked at
other impacts of lack of vitamin D3. As such, vitamin D3 deficiency has now been
linked with increased risk of cancer (Lucas & Ponsonby 2002) of the prostate, colon and breast (Berwick & Kesler 2005; Garland et al. 2006; Garland et al. 2007), autoimmune diseases including multiple sclerosis, type 1 diabetes and rheumatoid arthritis (Ponsonby, Lucas & van der Mei 2005), cardiovascular disease (Yuen & Jablonski 2010), and obesity (Foss 2009) while sufficient levels of vitamin D3 has
10
out how to balance exposure to UV radiation in order to maintain sufficient vitamin D3 levels in the body while at the same time not over exposing the body to UV
radiation which is associated with many detrimental effects (Reichrath 2006; Samanek et al. 2006; Webb & Engelsen 2006). Of course, it is possible to obtain some vitamin D through diet (such as supplements or consumption of oily fish), but this does not always guarantee sufficient vitamin D3 levels, due to lack of
understanding about the supplements and how they work, and for people who do not have access to or cannot afford to consume oily fish on a regular basis. Instead, it is much simpler (and less expensive) for most people to obtain vitamin D3 from the
sun.
1.2.2.2 Hazardous biological effects to mankind
UV radiation has been linked to numerous detrimental effects since the beginning of the twentieth century, but even now, there is much that is still not known about the hazardous effects UV radiation is linked with. UV radiation is the cause of or has been linked with sunburn (erythema), photoaging, eye damage, immune suppression, DNA damage and mutations and non-melanoma and melanoma skin cancers (Godar 2005).
1.2.2.2.1 Erythema
over-11
exposure to UV radiation which is characterised by redness, warmth, and oedema (known as swelling) (Honigsmann 2002). Erythema can appear within half an hour to six hours of exposure time (Hawk 1982) and depends on the duration of exposure to UV radiation, skin type of a person, as well as various factors that influence UV radiation itself (Honigsmann 2002). The redness of the skin is due to increased blood content near the skin surface and will reach a maximum redness at 8 -12 hours after exposure, and gradually fade in a few days (ICNIRP 2007) although this depends on the severity of the erythema or “burn”. The use of the word “burn” can be somewhat misleading since traditionally burns are characterised by extreme temperatures (very hot or very cold) or chemicals. Instead, the “burn” results from phototoxicity or actinic effects (photochemical reactions) caused by UV radiation (ICNIRP 2007). UVC radiation is two to three times more effective at producing erythema than UVB radiation, and UVB radiation is 1000 times more effective at producing erythema than UVA radiation (Hawk 1982). This indicates that different wavelengths (and therefore different photon energies) have different efficacy at producing erythema. This is true of most photobiological effects (Horneck 1995). The effectiveness of wavelengths in the UV waveband to cause erythema is represented by the erythemal action spectrum (CIE 1987) as shown in Figure 1.1.
Figure 1.1 - CIE erythemal action spectrum (CIE 1987). 0.0001
0.001 0.01 0.1 1
280 300 320 340 360 380 400
R
e
la
ti
v
e
e
ff
e
c
ti
v
e
nes
s
12
This action spectrum was superseded by clarification of measurement as reported by the CIE (1998) as endorsed by Webb et al., (2011), although to the eye, the relationship would be appear to be the same as Figure 1.1, despite variations between the two that are outlined by Webb et al., (2011). To determine an action spectrum for biological responses it is typical to study the relationship between surface exposure and the resulting response at individual wavelengths (De Gruijl 2000b). This is important since not all absorbed photons of energy cause a response. Instead, only a proportion of all absorbed photons may cause a photobiological response (De Gruijl 2000b). An action spectrum represents this proportion of effective photons per unit wavelength, commonly using a scale of zero to one. This scale can then act as a fractional weighting system, that when applied across the appropriate spectrum of wavelengths will represent only the biologically reactive radiation (Figure 1.2). As can be seen in Figure 1.1, the biological effects can change by the order of magnitude rather than just fractional, and so must be represented logarithmically since this would not be apparent in a standard 0 to 1 scale.
Figure 1.2 – Unweighted and erythemally weighted solar UV spectrum (measured 12.20pm, 6 January, 2009).
1.0E-05 1.0E-04 1.0E-03 1.0E-02 1.0E-01 1.0E+00
280 300 320 340 360 380 400
S
pec
tra
l
Irra
di
a
nce
(
W
/m
2/nm
)
Wavelength (nm)
13
The biological characteristics of a person with erythemal UV exposure also dictate how their body will respond, as mentioned previously, due to skin type. People with fair skin require less exposure time to induce erythema, while people who have more pigmented skin will require longer exposure times to induce erythema, or else they may not receive erythema at all. Fitzpatrick (1975) quoted in Diffey (1991) determined a relative grading scale of six sun reactive-skin types (Table 1.1).
Table 1.1 – Fitzpatrick skin type table compiled from Holick & Jensen (2003), ICNIRP (2007) and Diffey (1991). Skin Type Sun Sensitivity Sunburn Susceptibility Exposure to Burn (SED) Tanning ability Characteristic features
I Very Sensitive Always burns < 2 Never tans (no tan)
Fair with red/blonde hair; freckles
II Moderately
Sensitive High 2-3
Rarely tans (light)
European descent (Scandinavian/Celt)
III Moderately
insensitive Moderate 3-5
Gradually tans (medium)
Occasionally burns; Mediterranean and Middle East Origins
IV Insensitive Low 5-7
Always tans (dark) + exhibits IPD
Seldom burns; East Asian, Indian and Pakistan origins
V Insensitive Very Low 7-10
Always tans + exhibits IPD
Rarely burns, natural brown skin; African, South East Asian and some Indian and Pakistan origins
VI Insensitive Extremely Low >10
Always tans darkly + exhibits IPD
Never burn; natural black skin; African and Tamil origins.
1.2.2.2.2 Skin changes – tanning, pigmentation and photoaging
14
15
1.2.2.2.3 Skin cancer
Skin cancer is a growing problem worldwide, where Australia has one of the highest rates of skin cancer in the world (McCarthy 2004). Skin cancer has been identified as being caused by UV radiation since the 1930s (Albert & Ostheimer 2003) and 1940s (Blum 1948). Cancer is one of the main causes of death in the world (Celik, Hayran & Yuce 2010), and compared to other types of cancer (named according to where or how the cancerous cells arise), skin cancer is one of the most common types of cancer (McCarthy 2004). Cancer starts at the level of cells, whereby the cell is damaged or mutated to produce a cancer cell by carcinogenic causes which are either physical, chemical or biological (Celik, Hayran & Yuce 2010). UV radiation has been identified as one of the main carcinogens in the etiology of skin cancer (IARC 1992) although there are many contributing risk factors such as those listed by Alam & Ratner (2001) for squamous cell carcinoma, and this list has a number of factors that are also themselves directly linked with UV exposure. The process of producing a cancer cell is a little more complicated than the outline above and can be better understood through damage to DNA (Leffell & Brash 1996).
16
keratinocytes to replace the cells that wear off at the skin‟s outermost surface. Between the epidermis and the dermis there are cells called melanocytes that produce a pigment called melanin. There are two main types of skin cancer: non-melanoma and melanoma, named due to the position of the skin in which they occur.
1.2.2.2.3.1 Non-melanoma
17
BCC with UV radiation is slightly different to the epidemiological evidence that links SCC with UV radiation (English et al. 1997). The review by English et al., found that over numerous studies SCC was strongly linked to total exposure including both occupational exposure (people who work outside) and non-occupational exposure, while BCC was more associated with non-non-occupational exposure. Total UV dose is also important to occurrence of NMSC, where exposure to high UV doses increases incidence of development of NMSC, where SCC is more affected than BCC (Ramos et al. 2004). UVB radiation is believed to be mainly responsible for NMSC cutaneous damage (Dessinioti et al. 2010) and specifically for total cumulative exposure in SCC (Vitasa et al. 1990). BCC appears to be more closely linked to people with the type of skin that burns easily or tans poorly but with intermittent UV exposures (Vitasa et al. 1990; Kricker et al. 1995; Green et al. 1996). However, despite the differences between the role of UV radiation in NMSC skin cancer induction, it is agreed by most that UV radiation plays a very important role in all types of skin cancer (Kricker et al. 1995; Green et al. 1996; Leffell & Brash 1996; English et al. 1997; Armstrong 2004).
1.2.2.2.3.2 Malignant melanoma
18
19
controversies and contradictions surrounding development and results of malignant melanoma, many studies agree with the reasoning of Brenner and Hearing (2008), which shows the action spectrum for UV induced tanning and the erythemal action spectrum are almost identical, and only differ in the type of UV that is more efficient at each biological response. It was previously stated that the degree of pigmentation (and therefore skin type and ease of tanning ability) are the most useful predictor of skin cancer (Lin & Fisher 2007), therefore, it stands to reason that induction of tans and erythema are also used as predictors of skin cancer in an individual and therefore is a result of UV radiation exposure.
1.2.2.2.4 Eye effects
20
cataract is a clouding of the part of the eye causing opacity when there should be transparency and as a result of the cataract, limiting vision (Gallagher & Lee 2006). Specifically, UV is linked to the development of cortical cataracts which are cataracts that develop on the outer part of the cornea as opposed to the centre or inner part of the cornea (West et al. 2005) or cataracts of the lens. A much rarer condition, ocular melanoma, has been linked with UV exposure, and it is more likely to occur in subjects with light skin and hair, and blue or grey eyes (Gallagher & Lee 2006).
1.2.2.2.5 Immune suppression
21
UVB, where the natural mechanism of erythema was essentially de-activated, causing a person to seek shelter when erythema was eventually detected.
1.2.2.2.6 DNA damage, mutation and other effects
22
There is much information on the specifics of gene mutation and its products, for example (Mitchell & Karentz 1993; Mouret et al. 2006).
Other effects that UV radiation may be linked with include the interactive effects of UV radiation where threshold dosages may be important for good health. Most particularly is the production of vitamin D3. As discussed earlier, lack of vitamin D3
is associated with other forms of cancer, where by balancing moderate doses of UV exposure may assist general health. In other words, too much UV exposure can cause NMSC while not enough UV exposure may inadvertently contribute to other types of cancer (such as breast or colon cancer). Current literature is reinforcing this body of knowledge (Tuohimaa et al. 2007; Grant 2008), while lack of vitamin D3 is also
postulated to be linked with obesity (Foss 2009) and sufficient vitamin D3 levels may
contribute to lowering of hypertension (Godar 2005).
1.2.2.3 Ecological biological effects
23
other aquatic life forms such as coral, sea anemones, amphibians and fish are thought to be indirectly affected by UV radiation due to changes in other climatic factors (Hader et al. 2007). Numerous studies have been carried out using plants subjected to increased levels of ambient UV exposure. Biological effects include plant growth inhibition, changes in acclimation responses, changes in plant chemistry and interactions between plants and synergistic and consumer organisms (such as herbivory, fungi, microbial communities) (Caldwell et al. 2007). The former topics are direct effects of changes in UV radiation while the latter are indirect effects. As with most ecological systems, there are many factors that work together to produce optimum conditions for any biological entity, and it is obvious that UV radiation plays an important role in ecological systems on earth, but defining exactly how UV functions for every different type of organism is difficult. Many studies have been carried out in Antarctica where maximal changes in UV radiation are investigated for the effects on biological organisms, both on land (Xiong & Day 2001) and in the ocean (Davidson & Belbin 2002).
1.2.3
Variations in UV radiation levels at the earth’s surface
24
estimating surface UV radiation, with examples of forecasting of the UV Index, estimating surface UV irradiance from space and estimation of UV penetration under water (Kerr 2003). The majority of research on changes in UV radiation levels and consequential biological effects began when depletion of ozone was discovered over Antarctica, potentially resulting in increased UV radiation levels at the earth‟s surface (Sommaruga 2009). Kerr (2003) describes the main influencing factors affecting UV radiation reaching the earth‟s surface as geometrical and geophysical variables. Geometrical variables include changes in the earth-to-sun distance and the position of the sun in the sky relative to a geographical location on the earth‟s surface. Geophysical variables include physical effects on the passage of UV radiation through the earth‟s atmosphere. The geometrical factors will be discussed here first before addressing the geophysical factors. Out of the many variables that influence UV radiation, temperature however is not one of them, which is in contrast to the effect of UV radiation on ozone and oxygen in the stratosphere, in which UV radiation controls the thermal profile of the stratosphere (Lean 1997).
1.2.3.1 Extraterrestrial UV
25
26
1.2.3.2 Geographical location
UV radiation reaching the earth‟s surface varies according to geographical location (Seckmeyer, Albold & Mayer 1997; Kimlin 2008; Lee-Taylor et al. 2010) as indicated by variation in average doses to UV exposure. The variations in UV radiation due to geographical location are not just a result of geography (latitude and longitude), but are due to a combination of geometrical and geophysical factors including the observer‟s altitude, seasonal variations and the position of the sun in the sky.
1.2.3.2.1 Altitude
UV radiation reaching the earth‟s surface at different altitudes is affected by the total air column that it must travel through in the atmosphere (Piazena 1996) which means that the higher the altitude, the lower the attenuation which will result in higher UV radiation intensity measurements (Parisi, Sabburg & Kimlin 2004a). The attenuating effects of the atmosphere cause variation even at similar altitudes, so the effect of altitude has been explored at various altitudes, around the world including the Chilean Andes (Piazena 1996), the European Alps (Schmucki & Philipona 2002) and in Germany and Bolivia (Pfeifer, Koepke & Reuder 2006).
1.2.3.2.2 Latitude and longitude
27
Longitudinal variations in UV radiation tend to be minimal and any variations observed indicate it is more likely to be due to climate of the area under consideration (Godar 2005).
1.2.3.2.3 Seasonal variation
Despite the inability of the solar activity to significantly influence UV radiation reaching the earth‟s surface, the relative position between the earth and the sun does influence the intensity of UV radiation reaching the earth‟s surface. The distance between the earth and the sun varies by about 3.4% (Madronich 1993) which leads to seasonal UV variation by about 7% due to the inverse square law (Kerr 2003; Seidlitz & Krins 2006) which produces the seasonal difference in UV radiation levels per season for each hemisphere. Due to this variation in earth-sun distance, the tilt of the earth‟s axis and a number of other factors including ozone content and pollution, the southern hemisphere receives higher UV irradiance than the northern hemisphere (Madronich 1993; Herman 2010). Essentially, both latitude and seasonal variation in UV radiation are mainly due to the position of the sun in the sky and duration of sunlight over the day time (Frederick 1993), which means that solar elevation is one of the dominating variables that controls UV radiation reaching earth‟s surface.
1.2.3.3 Solar zenith angle and solar azimuth angle
28
in the sky and the larger the SZA, the lower the sun is in the sky. The SAA is the position of the sun in the sky with respect to geographical north and is normally measured using north as 0°, and one full revolution clockwise around the compass points from north is 360°, however there can be variation in representing solar azimuth depending on the location on the earth where the measurements are made. SZA and SAA at any location vary with time of day, year and geographical location (Madronich 1993; Diffey 2002b), which means they are constantly changing as the earth rotates about its axis and orbits the sun. These descriptors can be expressed diagrammatically (Coakley 2003). As a result, the total path length of UV radiation travelling through the atmosphere is also changing, where the shorter the path length to the earth‟s surface, the less interaction with the geophysical factors of the atmosphere, while the longer the path length, the more interaction with geophysical factors and therefore greater attenuation of UV radiation. For these reasons solar UV irradiance on a horizontal surface is weighted according to the cosine of SZA, and as a result the smaller the SZA, the less absorption or scattering is observed. This is supported by maximum UV irradiance intensity occurring around solar noon, given factors such as clouds are not present, resulting in 50 to 60% of UV exposure occurring in the hours bracketing solar noon (approximately 4 to 5 hours) (Diffey 2002b) for any location regardless of the SZA or SAA in an area (except for the highest latitudes and polar regions where the sun may not come above the horizon in winter months).
1.2.3.4 Ozone
29
(around 90%) is located in the troposphere, while most of the remainder is found in the stratosphere. Energy at different wavelengths emitted from the sun may be absorbed in the atmosphere, and depending on the wavelength of the energy, can be absorbed in different parts of the atmosphere, or else not absorbed at all. UVC radiation causes ozone production (Lean 1997; Haigh 2003) as a result of being absorbed in the stratosphere. UVC radiation is absorbed by molecular oxygen (O2),
which splits into atomic oxygen (O). Atomic and molecular oxygen, due to their electron configurations, combine to produce triatomic oxygen (O3) otherwise known
as ozone. As a result of the breaking of molecular bonds, this process also produces heat that contributes to thermal profile of the stratosphere (Lean 1997; Haigh 2003). Compared to total atmospheric content, ozone exists only in trace amounts (Dessler 2000a). Nevertheless, the presence of ozone in this part of the atmosphere is vital to the earth‟s biosphere, because ozone filters out the biologically hazardous wavelengths within the UVC and UVB radiation wavebands. This filtering can be observed through the resulting UV spectral irradiance intensity which drops by six orders of magnitude over a 20 to 30 nm interval in the UVB waveband (Seidlitz & Krins 2006). Specifically, wavelengths up to and around 290 nm will be absorbed by ozone (Rowland 2006), which is split into atomic and molecular oxygen, only to be cycled back into the ozone and oxygen conversion reactions. There are also many reactions that serve to destroy ozone in the atmosphere (Rowland 2006) in larger capacities compared to ozone production. These reactions occur when compounds are introduced to the stratosphere that interacts with ozone.
30
introduced through normally stable compounds known collectively as CFCs (chlorofluorocarbons), used specifically in refrigeration and aerosol cans. The story can in fact be traced back to 1881, when Hartley (1881) as referenced from Walker (2007) worked out that UV absorption occurred due to ozone, and that placement of the ozone in the atmosphere was particularly important to the UV radiation reaching the earth‟s surface. In the 20th
31
the situation changed, when the British Antarctic Survey team demonstrated that ozone levels measured during spring in the late 1970s, had fallen below the levels observed during the period 1957 to 1973 (Farman, Gardiner & Shanklin 1985). Farman, Gardiner & Shanklin postulated that chlorine reaching the stratosphere was causing the destruction of ozone, a conclusion later supported by a confirmation that CFCs carried chlorine into the stratosphere.
Chlorine isn‟t the only culprit in destroying ozone, with previous work having already shown that nitrogen oxides were also capable of ozone destruction. In fact, with development in the 1970s of supersonic passenger aeroplanes flying in the stratosphere, a concern arose that nitrous oxides in the exhaust from these planes (van der Leun 2004) could also cause ozone destruction (Crutzen & Arnold 1986). In the end, it wasn‟t the supersonic planes‟ exhaust that caused significant problems. Other chemical elements make it to the stratosphere to eventually exist as free radicals, and have been shown to be just as damaging (if not more) to ozone as chlorine, such as bromine (Wennberg 1999) which is up to 60 times more effective than chlorine at converting ozone to oxygen (WMO 2006).
32
reactions in the atmosphere. There is also the polar vortex, a climatic condition that is able to separate the polar air mass from lower latitude air movement through strong pressure gradients (Dessler 2000b). The ozone hole is in reality not an isolated phenomenon, and depletion of ozone levels worldwide have since been observed, as has a “hole” forming over the Arctic (Muller et al. 1997), despite the differing climatic conditions to Antarctica (Walker 2007).
33
was produced in 1987 called the Montreal Protocol to embark on reducing the use of ozone depleting substances as much as possible (WMO 2006). At the time of the most recent assessment of the Montreal Protocol (WMO 2006) it appears that the protocol is working with measurable reductions of ozone depleting substances in the stratosphere, while the depletion of ozone itself has not worsened. This is despite the fact that there are many contributing factors to variations in ozone concentrations in the stratosphere (Weatherhead & Andersen 2006). There is also the added uncertainty as to how climate change may affect ozone, with the potential to affect the warming that ozone provides to the stratosphere (through the initial production via UVC radiation and molecular oxygen). Cooling of the stratosphere due to added greenhouse gases trapped in the troposphere could cause increased ozone depletion, but warming in the polar regions may help to decrease ozone loss (through less severe conditions in the polar vortex) which will help circulate ozone across the global atmosphere (Schiermeier 2009). There are many other interactions involved in climate change that relate to solar UV through a variety of factors (Matthews & McKenzie 2006) but do not need to be considered here. The interaction between change in ozone concentration and enhanced greenhouse effect causes higher uncertainties in the overall recovery of the ozone layer, and therefore adds another layer of variability that has to be considered. However that is larger than the scope of this research. One of the more investigated variations is cloud cover, which will be discussed next.