NAA ENHANCING THE QUALITY OF MARKING PROJECT:
THE EFFECT OF SAMPLE SIZE ON INCREASED PRECISION
IN DETECTING ERRANT MARKING
Mudhaffar Al-Bayatti and Ben Jones
February 2005
THE EFFECT OF SAMPLE SIZE ON INCREASED PRECISION IN
DETECTING ERRANT MARKING
ABSTRACT
The quality of examiners’ marking is currently checked by sampling their marking and comparing the marks given with a more senior examiner’s marks. The aim of this research was to investigate whether increasing the size of this sample re-marking would improve the quality control process significantly. Ninety-eight scripts were re-marked according to current quality assurance arrangements, and the relationship between the sample size of scripts and the standard error of the mean difference between Senior Examiner and Assistant Examiner marks was measured. The pattern of decrease in the standard error, as the sample size of scripts increased, was found to be similar for three Assistant Examiners of varying expertise and experience, and a simulated marker. There was little to be gained from increasing sample size beyond a certain number of scripts for each type of marker. The minimum number of scripts required to identify errant marking was estimated for each category of examiner, and the more experienced the examiner, the fewer scripts were required.
Keywords: accuracy of marking, sample size.
INTRODUCTION
This study aimed to measure the relationship between the sample script size and the standard error of the mean difference between Senior Examiner and Assistant Examiner marks. The main research question addressed by this study was: “How many scripts should be re-marked by the Senior Examiner efficiently to evaluate an Assistant Examiner’s marking?”
Under current practice, a Standardisation Meeting is held for all Assistant Examiners, although in small entry question papers all scripts are marked by the Senior Examiner. The consistency of marking can become an important issue, particularly for large-scale examinations involving many Assistant Examiners. The responsibility of a Principal Examiner at the Standardisation Meeting is summarised by the following statement from the AQA Procedure Guidance of Standardisation (2004):
“ It is very important that the Principal Examiner gains the full confidence and co-operation of all the examiners so that the exercise makes a proper contribution to ensuring that everyone marks the scripts accurately according to the mark scheme and that there is consistency within each individual’s work and amongst the work of all the examiners.”
comprising approximately 50 scripts, is collected about half way through the marking period. Only 15 are re-marked initially and if any fall outside the tolerance limits, or a consistent pattern of leniency or severity emerges, then an additional ten are marked. These re-marked scripts form the basis on which decisions are made about examiner adjustments, errancy at marking review and the need for a total or partial re-mark.
This report investigates the efficiency with which various sizes of samples of scripts can recognise an Assistant Examiner with errant marking, that is, the discrepancy between the Senior and Assistant Examiner’s marks that would be beyond the agreed tolerance. The investigation was carried out on three sets of real mark data and a simulated data set, and for each case, for a given tolerance level, a minimum number of scripts for a sample is recommended. The motivation for the study lay in seeking efficient sample sizes that could reduce costs yet provide good approximations of marker accuracy.
Many papers have been published in relation to examiners’ accuracy, but few address the effect of sample size on the estimation of accuracy of marking. Cresswell (1996) looked at sample and sub-sample sizes needed for the moderation of centre-assessed components. Selecting samples of marking is obviously more efficient than re-marking every piece of candidates’ work, but the sample needs to provide a good estimate of the quality of the examiner’s marking. A different sample of candidates’ work could produce a different estimate of the quality of the examiner’s marking. Statistically speaking, ‘confidence limits’ can be calculated, which indicate the risk that the estimate of the quality of the examiner’s marking is wrong. A 95 per cent confidence limit indicates the range in which the quality of the examiner’s marking will lie, given a particular sample size, in 95 out of 100 different samples. For example, the 95 per cent confidence limit could indicate that an examiner’s marking was severe by between 2 and 5 marks. Clearly, the tighter the range of these confidence limits, the more accurate the estimate. This is achieved by either increasing the sample size, or having consistency in the examiner’s marking quality. Cresswell’s paper demonstrated the influence of different sized samples on the 95 per cent confidence limits for adjusted marks. The paper contained tables showing the range of the confidence limits of the candidates for adjusted marks, assuming a correlation of 0.9 between the teacher’s and moderator’s marks in adjusted centres. The smallest sample sizes recommended for 10 and 200 candidates taking the component at a centre were 8 and 24 scripts respectively. These samples would have given reasonably reliable estimates of the quality of the examiners’ marking. That is, the 95 per cent confidence limits were a reasonably small range for these sample sizes.
METHOD AND DATA
Assuming the marking of the Senior Examiner represents the best estimate of candidates’ true mark, the difference between the Assistant and Senior Examiner’s marks defines the error in marking. Absolute differences were used instead of the raw differences since, for this exercise, it was the extent, not the direction, of the errors that was important, although absolute differences are not used by the examiner adjustment team in deciding their Examiner mark adjustments (see AQA Procedure Guidance, 2004).
Because each Assistant Examiner marks many scripts (usually between 300-400), the mean of the absolute differences should be a good representative of all individual differences. The standard error of the mean is a measure of the closeness of a sample mean to the population
mean and was used here as the mathematical definition for the increased precision of increasing sample size. The value of the standard error should depend on both the standard deviation (a statistical representation of the consistency of the leniency or severity of the examiner’s marking) of the differences and the sample size (n). Theoretically, for a fixed standard deviation, the larger the sample sizes the smaller the standard error. This will be shown practically in the next section.
This research used a sub-set of the data generated by Royal-Dawson (2004) in her investigation of the differences in marking Key Stage 3 English between four groups with different teaching and marking experience. Three markers were chosen arbitrarily, one from each type, for this study: marker 1 was from a B.A. graduates group, marker 2 from a teachers group, and marker 3 from an experienced markers group. They each marked the scripts of ninety eight candidates from the 2003 Key Stage 3 English written paper, the maximum mark of which was 30. A simulated data set was also generated, based on a maximum mark range found in the actual data of the three markers mentioned above (see Appendix).
EFFECT OF SAMPLE SIZE ON INCREASING PRECISION
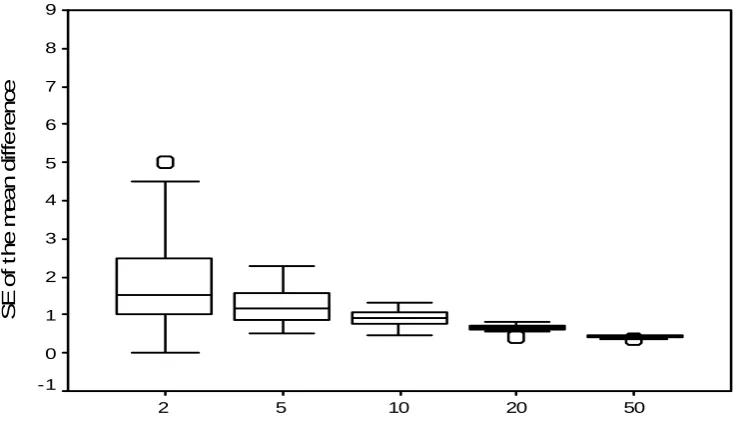
Twenty five random sub-samples of scripts, sized 2, 5, 10, 20, and 50, were selected from all scripts (98). The standard error of the mean absolute difference between the Senior and Assistant Examiner were computed for each sample size and for each marker. Box plots (or box and whisker diagrams) were constructed to summarise the data and to show the shape of the distributions, their central values and variability. A box plot provides a graphical summary of a data distribution and comprises the smallest value, the lower quartile, the median, the upper quartile, and the largest value. The central box spans the quartiles and the line in the box marks the median. (Quartiles divide an ordered list of values into four equally sized groups. One quarter of the values are less than or equal the lower quartile, half the values are less than or equal to the second quartile (or the median) and three quarters of the values are less than or equal to the upper quartile.) Lines (or whiskers) extend from the box out to the smallest and largest values that are not suspected outliers. Values more than 1.5 x the inter-quartile range (i.e. the difference between the lower and upper quartiles) are plotted individually outside the central box as possible outliers.
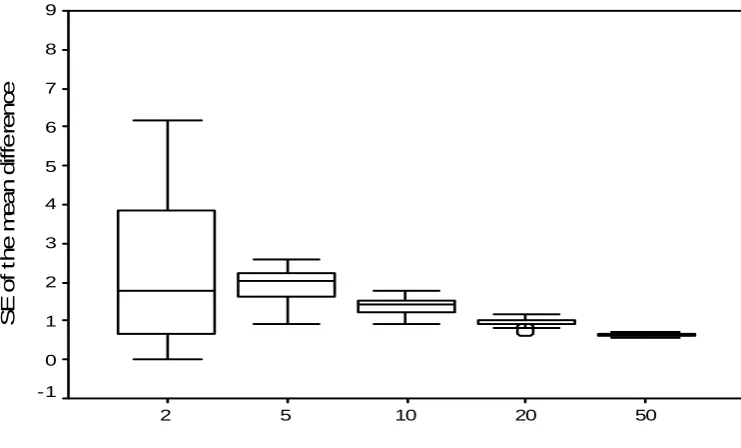
A simulated data set, of pseudo-random numbers, was also generated and the same descriptive statistics obtained. The pseudo-random numbers were generated such that they covered the maximum range of differences in marks between Senior and Assistant Examiner found in the real data for the three markers mentioned earlier. Although the simulated data were deemed to represent a set of data that could realistically reflect actual scenarios, because they are based on the maximum range of differences found in the datasets of the three types of markers, they have the highest standard deviation and the simulated marker thus represents a “worst case” scenario. The mean absolute mark difference between the Senior and the Assistant Examiners and the simulated marker were 4.48, 4.03, 3.29 and 8.80 respectively (see Appendix). The standard errors for all sample sizes were produced graphically in Figures 1, 2, 3 and 4 for each marker type.
distribution is positively skewed for samples of size 2 while it is negatively skewed for samples of size 5; the mean of the standard errors for samples of size 2 (2.36) is higher than that for samples of size 5 (1.86). A positively skewed distribution has a concentration of cases with low values, the cases with higher values being spread more broadly across the range; negatively skewed distributions have a concentration of cases with high values, the cases with lower values being spread across the range. The four box plots have points plotted outside the whiskers as circles and crosses which represent outliers.
Figure 1. Box plots of 25 random samples for standard error of the mean difference between Senior Examiner and Marker 1 (B.A. Graduate).
Num ber of scri pts sampl ed
50 20 10 5 2 S E of t he m ean di ff e renc e 9 8 7 6 5 4 3 2 1 0 -1
Figure 2. Box plots of 25 random samples for standard error of the mean difference between Senior Examiner and Marker 2 (Teacher).
Num ber of scri pts sampl ed
50 20 10 5 2 S E of t he m ean di ff e renc e 9 8 7 6 5 4 3 2 1 0 -1
[image:5.595.116.485.520.739.2]Figure 3. Box plots of 25 random samples for standard error of the mean difference between Senior Examiner and Marker 3 (Experienced).
Num ber of scri pts sampl ed
50 20
10 5
2
S
E
of
t
he m
ean di
ff
e
renc
e
9
8
7
6
5
4
3
2
1
0
-1
Figure 4. Box plots of 25 random samples for standard error of the mean difference between Senior Examiner and Simulated marker.
Num ber of scri pts sampl ed
50 20
10 5
2
S
E
of
t
he m
e
an di
ff
e
renc
e
9
8
7
6
5
4
3
2
1
0
[image:6.595.117.488.448.672.2]SAMPLE-SIZE CALCULATION
An important, and yet difficult, question to answer is how many scripts should be re-marked by the Senior Examiner efficiently to evaluate the Assistant Examiner’s marking? The larger the sample size, the more precise will be the estimate of the differences between Senior and the Assistant Examiner’s marks. Since an increase in the sample size costs more money and time, it is sensible to relate the sample size to a specified degree of precision. The mean of mark differences was compared with zero, assuming that the differences between the Senior and the Assistant Examiner had the same known standard deviation of that calculated from the ninety eight scripts mentioned in the previous section. The significance level was set at 0.05 and the power of the test was at least 80 per cent to yield a statistically significant result. For statisticians, 'significance' relates to the probability that a particular finding is true (or not due to chance). The most commonly reported level of significance is 0.05, meaning that a finding has a 95 per cent chance of being true, and only a 5 per cent chance of not being true. The power is the basis of tests used for estimating the sample size needed to detect an effect of a particular magnitude, and a test with a higher power is preferred as it represents the probability of making a correct decision in hypothesis testing.
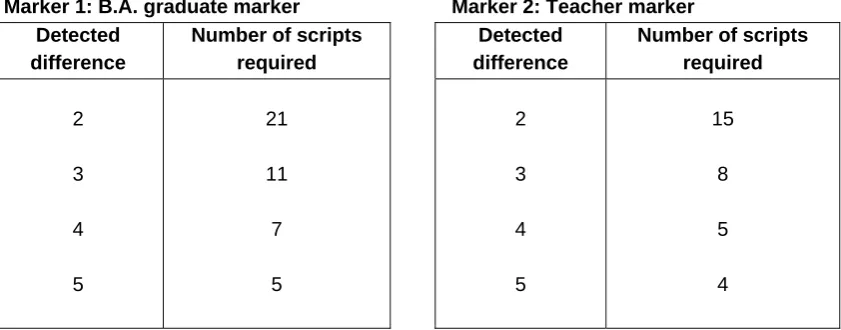
[image:7.595.88.509.502.667.2]The minimum sample sizes required for various differences between the Senior and the Assistant Examiners’ marks were calculated, and the results are shown in Table 1. For example, for marker 1, if it is important to detect an absolute difference of at least 2 marks (any smaller effect might not be deemed to be of substantive significance), then a sample of 21 scripts is required to be re-marked by the Senior Examiner to reveal a significant difference; fewer than 21 scripts might not be enough to detect a difference of 2 marks.
Table 1. Number of Scripts Required to Detect Differences of Marks Between Senior Examiner and Three Types of Markers and a Simulated Marker in Key Stage 3 English Written Component With a Maximum Mark of 30.
Alpha = 0.05, Power 80 per cent.
Marker 1: B.A. graduate marker Marker 2: Teacher marker
Detected difference
Number of scripts required
Detected difference
Number of scripts required
2
3
4
5
21
11
7
5
2
3
4
5
15
8
5
4
Marker 3: Experienced marker Simulated marker Detected
difference
Number of scripts required
Detected difference
Number of scripts required
2
3
4
5
13
7
5
4
2
3
4
5
34
16
10
7
CONCLUSIONS
The relationship between the standard error of the mean difference and the number of scripts is known to be negative: for a fixed standard deviation, the larger the sample sizes the smaller the standard error. This relationship was demonstrated using marks of three types of Assistant Examiner and a simulated marker. Figures 1 - 4 illustrate the pattern of the reduction in the standard error of the mean difference between the Senior and Assistant Examiners’ marks as the number of scripts increases. In principle, there is agreement between the results of this paper and those of Cresswell (1996) concerning the effect of sample size on identifying the accuracy of Assistant Examiners’ marks. There is little to be gained from increasing sample sizes beyond a certain number and there is a point at which returns gained from increasing the sample size no longer increase.
REFERENCES
AQA (2004) Procedure Guidance File for Examiner Review and Marking Review, Centre Grade Comparison Lists and Office Reviews:GCSE/GCE/VCE/ GNVQ specifications.
Internal document.
AQA (2004) Procedure Guidance File for Pre-standardisation and Standardisation Meetings for GCSE, GNVQ, GCE and VCE specifications. Internal document.
Cresswell, M. J. (1996) Moderation of centre-assessed components a note concerning sample sizes. AEB Internal Report.
Royal-Dawson, L. (2004) Is teaching experience a necessary condition for markers of Key Stage 3 English? Report of the Key Stage 3 English Marker Study. Internal Report, RC/261. Assessment and Qualifications Alliance.
Mudhaffar Al-Bayatti
AQA Research and Statistics Group. February 2005
APPENDIX
Descriptive Statistics of Absolute Mark Difference Between Senior Examiner and Markers 1, 2, 3, and Simulated Marker for 98 Candidates.
Marker Range Mean Standard
error
Standard deviation