E
d
u
ca
tio
n an
d Life
lo
n
g L
e
ar
nin
g
Measurements of Participation in
Scottish Higher Education Report
MEASUREMENTS OF PARTICIPATION IN SCOTTISH
HIGHER EDUCATION REPORT
Geoff Cohen, Antony Fielding**, and Jennifer Waterton
The views expressed in the report are those of the author(s) and do not necessarily reflect those of the Scottish Government or any other organisation(s) by which the author(s) is/are employed.
The Scottish Government is making this research report available on-line in order to provide access to its contents for those interested in the subject. The Scottish Government commissioned the research but has
not exercised editorial control over the report.
This report and research findings are published by Education Analytical Services, Lifelong Learning Research, Scottish Government, 5 Atlantic Quay, 150 Broomielaw,
Glasgow, G2 8LU.
If you have any enquiries about these reports
Please contact Andrew Walker on 0300 244 6774 ; by e-mail on recs.admin@scotland.gsi.gov.uk or visit our website www.scotland.gov.uk/insight .
© Crown Copyright 2010
Limited extracts from the text may be produced provided the source is acknowledged.
For more extensive reproduction, please write to, the Chief Researcher at Office of Chief Researcher, 4th Floor West Rear, St Andrew's House, Edinburgh EH1 3DG
Scottish Government Social Research
2010
Table of Contents
EXECUTIVE SUMMARY 1 INTRODUCTION
2 DEFINITIONAL AND METHODOLOGICAL ISSUES 3 METHODS OF MEASUREMENT OF PARTICIPATION 4 MEASUREMENT OF PARTCIPATION IN THE UK
5 MEASUREMENT OF PARTICIPATION OUTWITH THE UK 6 MEASURES OF WIDENING PARTICIPATION
7 STRENGTHS AND WEAKNESSESES OF CURRENT APPROACHES 8 THE STAKEHOLDER CONSULTATION
9 CONCLUSIONS
10 OPTIONS FOR DEVELOPMENT
GLOSSARY
REFERENCES
ANNEX 1 LIST OF STAKEHOLDERS FOR INTERVIEW ANNEX 2 TOPIC GUIDE FOR STAKEHOLDER INTERVIEWS ANNEX 3 BRIEFING NOTE FOR STAKEHOLDER INTERVIEWS
EXECUTIVE SUMMARY
Background
In December 2009, the Lifelong Learning Analytical Services Unit commissioned research on behalf of the Scottish Funding Council and the Scottish Government to examine current approaches to the measurement of participation in Higher
Education (HE) and to advise on possible options for further development.
The research was prompted by a number of factors, including the recognition that the current headline measure of HE participation in Scotland – the Age Participation Index (API) – was not sufficiently broad in its coverage of mature and part-time learners. Since these groups – and other ‘non traditional’ learners – comprise a growing proportion of the total numbers of students in HE, it was important to investigate whether other measures would be more suitable for capturing current patterns of participation.
Research Methods and Approach
The research was conducted in two stages. The first stage of the work comprised a literature review together with an assessment of current practice within the UK. The second stage was a consultation exercise with a broad range of stakeholders comprising telephone and face-to-face interviews, and an online questionnaire survey. A total of 18 telephone interviews and 2 group face-to-face interviews were conducted. The online survey was completed by 33 respondents.
Literature Review and Assessment of Current Practice
The literature review revealed a vast literature on the issue of widening participation which discusses the factors which influence the participation of disadvantaged groups and non-traditional learners, the impact (actual and potential) of local and national policies on patterns of participation, and the economic and social benefits that may flow from wider participation. However, by contrast, the literature which deals specifically with the measurement of participation rates, both in the UK and elsewhere is limited.
The measurement of participation in HE is impacted by a range of complex and detailed definitional and methodological issues. These include the definitions of participation, higher education, domicile and mode of learning; the availability of individual level data; and the potential for disaggregation by social, demographic, educational or other characteristics.
The term ‘participation’ is used in different ways within the literature, to mean ‘total enrolment‘ or ‘initial entry’. This lack of precision in the terminology is confusing, especially for policy makers and wider stakeholder groups. Moreover, participation interpreted as enrolment or as initial entry makes no reference to achievement or qualification at HE level and so does not provide a statistical measure of what might be termed ‘successful participation’.
participation rates; and, for local areas, standardised participation ratios. Each type of measure has different strengths and weaknesses.
The review of approaches to measuring HE participation revealed that there was no common methodology across the four UK administrations. However stakeholders in all administrations expressed a wish for greater comparability both in headline measures and in general methodology.
While the Age Participation Index (API) continues to be used and valued in both Scotland and Northern Ireland as a headline measure of participation, it is no longer produced in England. The only headline measures in Wales are based on gross enrolment rates. The headline measure currently used in England is the Higher Education Initial Participation Rate (HEIPR) which covers a broader age range than the API.
The review of the international literature emphasised the sensitivity of comparisons to the measures chosen and revealed a very wide range of methodologies in OECD countries.
The widening access agenda is of interest to all four UK administrations, but the measures used to monitor improvements in widening access are variable. While Scotland has concentrated on the (area based) Scottish Index of Multiple Deprivation (SIMD), the other administrations have taken more interest in measures based on the National Statistics Socio-Economic Class (NS-SEC). In addition, statisticians at the Higher Education Funding Council for England (HEFCE) have developed the Young Participation Rate (YPR) which has been used to gain understanding of both geographical and socio-economic disparities in access to HE.
There is no satisfactory ‘off the shelf’ measure currently available for measuring the rates of participation for part-time and mature learners.
Stakeholder Consultation
The stakeholder consultation confirmed that no single ‘headline’ measure of
participation can address the complex questions that policy makers, managers, and academics are seeking to answer. Whilst the Scottish API is familiar to those
working in the field, and whilst many would not wish to see it discontinued (since it provides information about trends) there is a shared view that it does not provide a broad enough assessment of the participation of ‘non-traditional’ groups (especially mature learners, and those studying on a part-time basis).
There was broad agreement that information is required to cover more than one type of ‘participation’. Stakeholders are concerned equally with enrolment, initial entry, articulation, subsequent entry, and completion. At a broader level, stakeholders believe that ‘participation in Higher Education’ is a rather limited basis on which to analyse the life course trajectory through the educational system and into
employment.
Stakeholders identified a wide range of factors by which they wished any measure of participation to be reported. These covered individual student characteristics
disability, other indicators of multiple deprivation, origin, domicile), institutional factors (type of HEI / College), and mode of study.
A fairly positive view emerged of the efforts which have been made in recent years to improve the measurement of participation. In general, stakeholders were of the opinion that the standard of analysis, publication, and dissemination of the current information had improved.
Stakeholders are most interested in developing new information sources which will allow a life course approach to be adopted. There is a strong preference for a longitudinal approach which would allow the tracking of students through from their earliest years and educational experiences, into Higher Education and then into employment.
Options for Development
There is no clamour for any immediate changes to the current provision of
measures. However there are a number of improvements that could be enacted in the short to medium term. In addition, there are a number of suggestions for developmental work in this area which could be undertaken in the longer term.
In the short term:
- the API should continue to be produced, but the two formulae used by the Lifelong Learning Statistics Branch and the Scottish Funding Council should be harmonised;
- a user friendly guide to the rationale for, and interpretation of, current measures should be produced; and
- an Age Participation Index, calculated specifically for the most deprived section of the population, could be used to monitor widening access
In the medium term:
- a YPR for Scotland could be produced. This is a reliable measure for assessing the proportions of young people entering HE which is ‘proofed’ against abrupt changes in the population denominators. This would improve comparability across the UK;
- for the understanding of mature and part-time participation, net entry rates into tertiary A and tertiary B HE specific for mode and single year (or quite narrow age groups beyond age 21) should be calculated. Summing these over age groups would facilitate comparisons with the English HEIPR and the OECD net entry rates;
- production and publication of the API should be discontinued within the medium term (3-5 years).
In the longer term:
- development work could be undertaken on the possibility of taking a life course approach to measuring, analysing and interpreting participation in HE; - anonymised data linkages between e.g. UCAS applications and HESA
records, should continue to be explored;
- the feasibility of integrating data in Scotland collected by different
1 INTRODUCTION
1.1 In December 2009 the Lifelong Learning Analytical Services Unit
commissioned research on behalf of the Scottish Funding Council and the Scottish Government to examine current approaches to the measurement of participation in Higher Education (HE) and to advise on possible options for further development.
1.2 The research was conducted in two stages. The first stage of the work comprised a literature review together with an assessment of current practice within the UK. The second stage was a consultation exercise with a broad range of stakeholders comprising telephone and face-to-face interviews, and an electronic questionnaire survey with all those who have registered their interest in this topic through the Scottish Government’s statistical consultation register (SCOTSTAT).
1.3 This report brings together the findings from the two stages of the work, and sets out options for development based on the material from both the technical aspects of the work (undertaken at Stage 1) and from the consultation exercise.
1.4 Sections 2-7 below, which relate mainly to Stage 1:
• discuss the key definitional and methodological issues • provide a brief summary of current approaches across the UK • highlight relevant research from the wider international literature • and discuss the strengths and weaknesses of current approaches.
1.5 Section 8 presents the findings from the stakeholder consultation. The conclusions are set out in Section 9, and the options for development are presented in Section 10.
1.6 As far as Stage 1 is concerned, there is a vast literature on the issue of widening participation which discusses the factors which influence the
participation of disadvantaged groups and non-traditional learners, the impact (actual and potential) of local and national policies on patterns of participation, and the economic and social benefits that may flow from wider participation. However, by contrast, the literature which deals specifically with the
measurement of participation rates, both in the UK and elsewhere is limited. Given the short amount of time available for this first stage of the work, our report therefore draws mainly on a few key sources.
1.7 First, there are two important reports (Ramsden (2003) and Corver (2005, 2010)) which have greatly influenced the measurement of overall participation rates in England and small area participation rates throughout the UK. Second, we have examined the statistical publications produced by the bodies
international literature, with reference to the comparative data published by the Organisation for Economic Cooperation and Development (OECD) publication ‘Education at a Glance’ and to reviews of the interpretation of these data for a range of countries including USA, Canada, Netherlands, Australia and
Scandinavia.
2 DEFINITIONAL AND METHODOLOGICAL ISSUES
2.1 The measurement of participation in HE is impacted by a range of complex and detailed definitional and methodological issues. These include the definitions of participation, higher education, domicile and mode of learning; the availability of individual level data; and the potential for disaggregation by social, demographic, educational or other characteristics.
2.2 These issues are discussed briefly below and are elaborated in Sections 3-6 below. It is clear that, given the definitional and methodological complexity, it is unlikely that one single measure of participation in HE will be able to capture the key dimensions for policy makers and stakeholders with a variety of perspectives and interests.
Definition of Participation Rate
2.3 The term ‘participation’ is used in different ways within the literature, to mean ‘total enrolment‘ or ‘initial entry’. This lack of precision in the terminology is confusing, especially for policy makers and wider stakeholder groups.
2.4 While it is essential to measure the number of participants of various kinds, for many purposes it is more meaningful to measure participation rates, that is the number of HE participants as a proportion of the relevant population. Defining and measuring an appropriate population denominator is sometimes difficult.
2.5 Enrolment rates measure the ‘stock’ of students (with each student being counted in the participation measure for every year that they are enrolled in HE), whilst entry rates measure the ‘flow’ of students (with each student being counted in the participation measure only for the year in which they first enrol). These are conceptually different, but are not always clearly distinguished in the literature.
2.6 The definition of ‘entry’ – if it is to be used to mean ‘new entry’ (and therefore meet the requirement that each potential student can be counted only once) is further complicated by the requirement to define ‘new’. This is also complex as it requires any measure to be able to distinguish those who have entered HE before. This raises questions about how to deal with cases where an individual has entered a HE course, but left well before completing the course.
Definition of Higher Education
2.8 The definition of ‘higher education’ is also complex, dynamic, and quite variable internationally, notwithstanding the harmonisation efforts ongoing through the Bologna process (European Commission (2009)). In Scotland higher education is defined by reference to levels 7 and above of the Scottish Credit and
Qualifications Framework (SCQF). In the UK as a whole, for the purpose of the Higher Education Statistics Agency (HESA's) data collection, HE students are those students on courses for which the level of instruction is above level 3 of the Qualifications and Curriculum Authority (QCA) National Qualifications Framework (NQF) (e.g. courses at the level of Certificate of HE and above). HESA publish an approximate correspondence between the NQF levels, and those of the SCQF.
2.9 HESA distinguishes the course aim of students entering HE as postgraduate, first degree and other undergraduate. In Scotland the term ‘sub-degree’ is used synonymously with ‘other undergraduate’. The category ‘other undergraduate’ covers foundation degrees, HND, HNC, Dip. HE, Cert. HE and a variety of professional and other qualifications1.
2.10 Higher Education courses are delivered in Higher Education Institutions (HEIs). In Scotland, there is also substantial delivery of Higher Education courses in Colleges. In the rest of the UK a much smaller proportion of Higher Education is delivered outwith HEIs.
2.11 Some courses designated as HE may include components below the level designated by the SCQF or QCA as higher education.
Definition of Domicile
2.12 Another consideration in relation to the selection of measures of participation is the extent to which policy interest focuses on domicile. Some policy questions (relating for example to the cost implications of provision of Higher Education, or to the performance of individual educational institutions) will require
measures which include all students whatever their domicile, while other policy questions (for example questions relating to the access of disadvantaged population subgroups to Higher Education) would focus on domestic students only.
2.13 Domicile is defined by a student's permanent or home address prior to entry to the course. Participation statistics may be classified by country of domicile, distinguishing between students from each of the four administrations within the UK, countries of the European Union (EU), and non-EU countries. In cases where students have recently relocated prior to their application to HE the
1
country of domicile may not represent the country where they had the majority of their pre-HE education.
Modes of Learning
2.14 Full-time study is defined by HESA to mean a programme of study of at least 24 weeks within a year with an average of at least 21 hours per week. Part-time students may be on a programme lasting less than 24 weeks or may be
studying part-time throughout the academic year.
2.15 Where full-time and part-time enrolments are both included in the participation rate the concept of full-time equivalent (FTE) may be used as an alternative to the total headcount.The FTE for part-time students may be estimated by HEIs on either a 'credit' or 'time' basis relative to a comparable full-time course. For non-degree courses in Scotland the FTE is relative to a designated total number of hours for a full-time student. (The definition uses the SUM (student unit of measurement) which equals 40 hours of study.)
Availability of Individual Level Data
2.16 The main source for individual level student data which forms the basis for many of the measures of participation which either are or can be produced in the UK, is the HESA student record. For HE programmes delivered within Colleges separate data records are collected in England, Scotland, Wales and Northern Ireland. These data are supplied to HESA but there may be fields that are not directly comparable across the individual learner record systems.
2.17 More sophisticated measures of participation might be developed if HESA data could be individually linked to other record systems such as the Universities and Colleges Admissions Service (UCAS), which processes most university applications for full-time degrees, and the National Pupil Database. However there are data protection issues which could complicate efforts to link HESA student records with UCAS. Individual linkage with survey data would also be helpful.
2.18 No comprehensive data are collected on UK domiciled students engaged in HE programmes outside the UK.
Disaggregation
2.19 For most policy purposes disaggregation by age and gender is vital. There are methodological issues in relation to recombining age and gender specific
participation rates into broader overall measures. For example, the variation in normal school leaving age between countries of the UK may affect the
interpretation of the participation rate of the 18-21 age group.
2.20 Substantial development work has been undertaken in relation to disaggregating participation to small geographic areas, with a view to
their home address. This has necessitated considerable work since the required data are not directly available from the last census. Also, since participation rates for small areas may not be statistically stable there are questions as to how to model the local rates so as to ensure interpretation is not over-influenced by chance factors.
2.21 Disaggregation by other individual factors such as socio-economic group, disability and ethnicity is important, but raises issues in relation to estimation of appropriate denominators.
3 METHODS
OF
MEASUREMENT OF PARTICIPATION
3.1 The literature identifies a number of different types of measurement of participation. These can be characterised as ranging from the very simple to the more sophisticated. Each type of measure has different strengths and weaknesses and these are discussed more fully in Section 7.
3.2 The main types of measure described in the literature are gross enrolment rates; age specific participation rates; age specific initial entry rates; true cohort young participation rates; and, for local areas, standardised participation ratios. These are described briefly below.
Gross Enrolment Rate
3.3 This is the crudest possible measure of participation. It is calculated as the ratio of total student enrolment to total population. For countries with rudimentary statistical systems this is the only feasible measure.
Age Specific Participation Rates
3.4 Age specific participation rates are much more commonly used. For example, the ratio of total students aged 18-21 to total population aged 18-21. These rates are influenced by many factors including: the changing propensity to enter HE (influenced by economic factors and the supply of places), the average length of course, drop-out rates and the changing age structures in the population.
3.5 International comparisons of age specific participation rates are complicated by the fact that countries vary with regard to: the ages at which compulsory
schooling ends; the typical age at entry into higher education; the average length of courses; and drop-out rates. For example in Finland most students have to take one or several gap years before they can continue in tertiary education, and in Germany and Austria all 18 year-old males are required to perform either six months of military service or 12 months of civilian service (Adelman(2009), p.24).
at entry (y) to HE they can be compared by dividing the number of students enrolled at ages y to y+3 by the total population in this age range (Kaiser and O’Heron (2005)).
3.7 Age specific participation rates are frequently disaggregated by level and mode. For example the percentage of 18-21 year olds studying full-time on first degree programmes is a much more focused rate than simply the percent of 18-21 year olds participating in HE.
Initial Entry Rates, the Age Participation Index and Net Entry Rates
3.8 Instead of focusing on the total number of students (of given ages) enrolled in HE programmes a clearer interpretation may often be based on the number of students entering HE in a given year. This concept is clearest if entrants are only counted when they are new entrants to the particular level of HE under consideration. Given a careful enough definition of the term ‘new entrant’, an individual can only be a new entrant once. Dividing the number of new entrants in a given age range by the population in that age range gives a rate of initial entry into HE.
3.9 A variant on this approach is the Age Participation Index (API) currently published by the Scottish Government. This divides the number of 17-20 year old Scottish domiciled new entrants into full-time HE by the population aged 17. If there were no changes from year to year in the size of the 17-year old
population or of each cohort’s subsequent age-specific rates of entry into HE then this rate would represent the probability that a Scottish domiciled person aged 17 would enter into full-time HE for the first time by the age of 21.
3.10 Initial entry rates specific for single years of age, or small age bands are called (by OECD) net entry rates. If entry rates for several successive years of age are added the result is also called a net entry rate. Such a sum is not entirely logical, and could in theory lead to absurd rates of over 100%. A sounder method is to combine current age specific initial entry rates with the proportions of the population at each age who had not entered HE in previous years
(Ramsden (2003) pp72-73). The disadvantage of this formula is that the complications of its construction would make the participation measure less transparent to users.
3.11 Initial or net entry rates take no direct cognisance of the length of HE
programme that an individual enters into, nor the chances that the individual drops out or fails to qualify. This is in a sense an advantage over participation rates, in that net entry rate comparisons across countries are not confounded by variations in completion rates and course length. Changes in initial entry rates over time and differences in initial entry rates between countries are of course affected by economic factors that influence demand and supply of places and demographic changes that affect the age specific population denominator.
3.12 A consultation was carried out by Ramsden (2003) in relation to the
of entry was insufficient, in that the statistic would be interpreted as a measure of participation. According to those consulted a suitable measure should only include entrants who had ‘some real engagement’ in HE. Prior to the Ramsden report new entrants were only counted in the IER if they were entering on a course of study ‘expected to last for one year or more’. Ramsden examined the weaknesses of this definition due to student drop-out and proposed instead that entrants should be counted only if their actual period of study exceeded six months. This proposal was accepted for the purposes of the English Higher Education Initial Participation Rate (HEIPR) which is discussed further in Section 4.
3.13 Depending on how and when enrolments are counted enrolments may include some students who dropped out too early to be counted as new entrants. For example, a student who enrols in September and is counted in an enrolment census in December but leaves after Christmas would not be counted as an entrant on the above definition.
3.14 Variations between countries in the way it is determined whether entrants have previous experience of HE at the level they are entering (and are therefore not ‘new entrants’) affects international comparisons of entry rates.
True Cohort Young Participation Rates
3.15 When entry rates for each age group in the same calendar year are summed this is a net entry rate for a ‘synthetic cohort’. A ‘true cohort’ net entry rate would be one such as (for example) the net entry rate for 17-year olds in 2005 plus the net entry rate for 18 year olds in 2006 plus the net entry rate for 19-year olds in 2007 etc. Alternatively total initial entrants from an age cohort over a period of years may be divided by the size of the cohort at the age of
commencement of higher education.
3.16 In 2005 the Higher Education Funding Council for England (HEFCE) published a report on Young Participation in Higher Education (Corver, 2005). This was a substantial exercise in data linkage whereby true cohort entry rates for young people aged 18 and 19 were calculated for every ward in the UK. Databases from the UCAS, HESA, ILR and FES were linked in order to follow individual students through the HE system while avoiding false matches. Cohorts were defined in terms of the school year of each country (thus different for England and Scotland). The sum of the entrants aged 18 in year (y) plus the entrants aged 19 in year (y+1), divided by the estimated size of this school year cohort in year (y-3) when they were aged 15, defines the Young Participation Rate (YPR) for year (y).
3.18 A disadvantage of the true cohort YPR is that it cannot be calculated until the cohort reaches the end of the second year to which it relates. For example the YPR for the cohort which reached age 18 in 2008/09 would have some
members who did not enter HE until 2009/10, and the YPR would not be available until late 2010 (at the earliest). This is one reason (among several) why Corver did not consider a larger age range.
3.19 One of the main interests in YPR’s is as a basis for the POLAR (Participation of Local Areas) system of classifying small areas by their level of HE participation in order to assess trends in widening participation. This is discussed below.
3.20 Another examination of true cohort rates is presented by Kaiser and O’Heron (2005). They compare true and synthetic cohort net entry rates for ages 17-30 into first degrees in UK. For 2004/05 the true cohort rate was lower by three percentage points (30% vs 33%). This was attributed by Kaiser and O’Heron to the decline in the population of 18 year olds in the early 1990s.
Standardised Participation Ratios
3.21 In Scotland and Wales the technique of indirect standardisation is used to compare the HE participation rates of subnational areas, allowing for variations in local demography. The national (i.e. Scottish or Welsh) age and gender specific participation rates are applied to the population in each age-gender group in the local area to calculate the expected participation in the area if it followed national patterns. The ratio of the actual observed number of HE participants in the local area to the expected number of such participants defines the standardised participation ratio (SPR). Values greater than 1 imply that the local area has higher participation than the national average and values less than 1 imply the converse.
4 MEASUREMENT OF PARTICIPATION WITHIN THE UK
4.1 Current approaches within Scotland, England, Wales and Northern Ireland are described below. The summaries are based both on information which is available from websites, and also on detailed conversations with staff within each administration. We comment on the measures used to represent overall HE participation and local variation in participation within each of the four administrations. Further material on disaggregation by local area and other factors such as social class is presented in section 6.
Scotland
4.2 The most recent statistics on HE participation in Scotland are published by the Scottish Funding Council (2009) and the Scottish Government (2009).
part-time) and by level of study (other undergraduate / first degree / postgraduate).
4.4 Age and gender specific participation rates are also published on both headcount and FTE bases. Headcount rates are graphed by single years of age from 16 to 24 and by five year age groups up to 85+.
4.5 Standardised participation ratios are calculated for each Scottish local authority. Trends have been studied in a number of SFC publications (Raab and Small (2003), Scottish Funding Council (2009)).
4.6 Both the Scottish Government (Education Analytical Services Division) and the Scottish Funding Council publish an Age Participation Index (API). As
mentioned in paragraph 3.9 the Scottish Government defines the API as the ratio of the number of 17-20 year old Scottish domiciled new entrants into full-time HE to the population aged 17. The SFC uses a slightly broader definition of a new entrant : first-year entrants to HEIs who have no previous HE
qualification and first-year entrants to HE programmes within Scotland’s Colleges. This includes some part-time students and a few aged 16. The information on previous qualification is less complete for entrants to Scotland’s Colleges than for entrants to HEIs. The SFC definition of new entrant is only defined by lack of previous HE qualification at an HEI.
4.7 Over the last five years the SG’s API has been on average about three
percentage points lower than the SFC’s API. The year on year changes in each series have sometimes, but not always, been similar. For example, between 2005-6 and 2006-7 the SG’s API dropped by two percentage points while the SFC’s API did not change. However both series are affected by changes in the size of the 17-year old population, making short-term trends hard to interpret.
4.8 As a special exercise within the lifelong learning statistics branch of the Education Analytical Services Division, the OECD net entry rate has been calculated for entrants to first degree programmes in Scottish HEIs and Colleges. For this exercise HESA’s matching back method of defining ‘new’ entrants (see paragraph 4.16 below) was not used. Entrants into Colleges who completed less than 25% of their first year course were excluded. The fact that this measure is not restricted to Scottish domiciled students implies that it is less relevant as an indicator of participation for the Scottish population. (Scotland imports a large proportion of students with 27% of entrants to first-degree study in 2008-09 coming from outwith the country2). But comparison of this indicator with other countries could inform assessments of the performance and requirements of the Scottish HE sector as a whole.
4.9 This exercise did not include calculation of the OECD net entry rates for sub-degree and advanced research programmes.
4.10 A similar net entry rate, but restricted to Scottish domiciled new entrants, has also been calculated by statisticians within the Education Analytical Services Division. This is described as the ‘All ages, All modes’ measure. Scottish
2
domiciled entrants into first degree programmes at all UK higher education institutions were covered, but first degree entrants in Colleges were excluded. In this calculation ‘new’ entrants were those with no previous first degree level qualifications – a weaker exclusion than that used in the OECD net entry rate. A somewhat different age grouping was used with new entry rates summed for single years up to age 29, 5 year age groups from 30 to 64 and 65+.
4.11 The ‘All ages, All modes’ indicator appears closer in spirit to the English HEIPR (described below) than any other indicator currently available in Scotland, but the exclusion of sub-degree programmes is very significant.
England
4.12 The headline participation measure for England is the Higher Education Initial Participation Rate (HEIPR) which has been designated a National Statistic. To calculate the HEIPR the number of new entrants into HE at each single year of age (from 17 to 30) is divided by the population of that age and the single year rates then summed. If the population age structure and the probability of first entering HE at a given age were both constant from year to year this would closely represent the chance that a person aged 17 would enter into HE at some point before age 31. This is a synthetic cohort net entry rate. HEIPRs specific for males and females, full-time and part-time students and narrower and broader age ranges are also published (HEIPR60 covers ages 17-60, HEIPR20 covers ages 17-20).
4.13 The HEIPR is calculated for English domiciled students and covers entry into higher education courses at all UK universities and further education colleges in England, Scotland and Wales (courses designated higher education or at NVQ level 4 or above).
4.14 Thus for a given age, say age 18, the number of English domiciled students entering HE in the UK is divided by the estimated English population aged 18. Because of the way census population statistics are collected and updated to produce annual population estimates, this population denominator effectively includes some 18-year old students whose term-time address is in England but whose home address is in Scotland, Wales or Northern Ireland, and excludes some 18-year old English domiciled students whose term-time address is in Scotland, Wales or Northern Ireland. However, even for single year age groups the inaccuracy in population denominators for the whole of England as a result of the net cross-border flow of students is relatively small.
4.15 The HEIPR would only be an accurate predictor of future synthetic cohort-based measures of participation under perfectly stationary conditions with no change from year to year in the age-specific probability of entering HE. However the use of a synthetic cohort measure means that changes in the HEIPR are susceptible to changes in preferred age at entry to HE, as might happen if there were an increase in tuition fees (Corver, 2005 p.192).
markedly higher for year y+1 than year y, and in all likelihood the HEIPR for year y+1 would be higher too. But in year y+2 the net entry rate for age 19 might drop as a large proportion of that cohort had entered in year y+1; thus the HEIPR might fall. This could happen while the true cohort young
participation rates for those reaching age 18 in years y, y+1 and y+2 remained unchanged.
4.17 An important part of the HEIPR definition relates to the determination of ‘new’ entrants. This requires removal of entrants with previous experience of HE lasting six months or more. A complex matching algorithm looks back over HE data for at least 12 years and FE data for at least 10 years in order to decide whether the entrant is indeed ‘new’ to HE. Because data sources do not allow matching further back this means that the definition of new entrant is not quite correct for entrants aged over 30, and becomes progressively less appropriate for older entrants. The six month rule is arbitrary but it may not be practical to construct a definition which takes better account of the nature of previous HE experience (length of course, level studied and whether success was
achieved).
4.18 The possible exclusion of professional courses less than one year in length from the definition of HE was considered in some depth in the Ramsden report (Ramsden, 2003 paragraphs 202-226 and Appendix 3) when the HEIPR was being defined. Decisions with regard to short professional qualifications or training courses that may or may not be accredited by the SCQF and the QCA could have a bearing on the inclusion of mature HE entrants as ‘new’ entrants, and thus affect the participation rates for mature entrants.
4.19 While the HEIPR was designed as a national statistic for England, its disaggregation by region and by other factors was considered in a second report by Ramsden (2005). Disaggregation to large English regions was recommended, although some work would be needed to adjust the population base numbers. This is because the 2001 census counted students at their term-time address while HESA counts entrants at their home address, and the effect of net flow across regional boundaries has a relatively greater impact on regional age specific population estimates. In any case the mobility of young people means that for smaller regional populations the age specific populations are less accurate at census time and become more unreliable as years
progress to the next census. Thus the age specific initial entry rates become less reliable for smaller areas. The Ramsden review did not recommend
disaggregation of the English HEIPR to populations significantly below the level of UK regions, most of which are comparable in population size to Scotland.
Wales
4.21 In Wales statistics on HE participation are produced by the Higher Education Funding Council for Wales (HEFCW), while statistics on FE are produced by the Welsh Assembly Government (WAG). This differs from the situation in Scotland, where SFC publishes statistics on both HE and FE participation.
4.22 The overall Welsh HE participation rate is calculated as all enrolments of Welsh domiciled students (full-time and part-time, all ages) as a percentage of the total population. This is a gross enrolment rate. Age specific participation rates are published for age bands between 16 and 59, and these provide clearer interpretation than the overall rate. The rates are also broken down by gender within age groups and gender differences in participation are calculated.
4.23 The enrolments counted in the Welsh participation rates could include some students with little ‘real engagement’ in HE, since there is no requirement for a minimum actual period of study, or minimum expected length of course
incorporated in the definition.
4.24 Furthermore, there are some non-degree enrolments classed as ‘institutional credit’ or ‘no formal qualification’. In 2004/5 about 15% of these enrolments were aged under 18 and were on ‘taster’ sessions in higher education
(HEFCW, 2009). It is not clear what level these courses were at in terms of QCA definitions.
4.25 HE participation rates for the Welsh domiciled population are not broken down by first degree / sub-degree. The numbers enrolled by level, mode, gender, ethnicity etc are tabulated by StatsWales, but the only rates calculated are by age and gender.
4.26 No measures based on initial entry rates are published, but we were told that there was a desire to publish a participation statistic comparable with those produced elsewhere in the UK.
4.27 The WAG also publishes gross enrolment rates for all post-16 education and training, by gender and overall. This covers Welsh domiciled students at UK HEIs, students enrolled at Further Education Colleges (FECs) in Wales and England, pupils in maintained school sixth forms in Wales, and work-based and community based learners. Gross enrolment rates for post-16 education and training excluding HE are also published, and these are in fact subdivided by FE, sixth form and work-based learning.
Northern Ireland
4.29 HE statistics in Northern Ireland (NI) have tables on numbers of enrolments into HE by mode, level, location and gender. However the only participation rate calculated is the Age Participation Index (API). This is defined as the number of NI-domiciled young entrants (aged under 21) to full-time
undergraduate higher education (in the UK or Republic of Ireland) as a percentage of the 18 year-old population of Northern Ireland. In Northern Ireland most entrants leave school at age 18, and gap years are less common than in England. The API is very similar to the Scottish API, the differences being (a) inclusion of study in the Republic of Ireland, and (b) division by the population aged 18, where Scotland uses the population aged 17.
4.30 There are no immediate plans to change or extend statistics on participation rates, however Northern Ireland’s API is kept under constant review. We were also told that there would be a wish to improve comparability with other UK administrations. Apparently an unpublished study within the Department of Learning and Employment considered application of the HEIPR and concluded that it would indicate rates of up to about 60% in Northern Ireland.
4.31 The Northern Ireland administration has not set any specific target for HE participation.
5 MEASUREMENT OF PARTICIPATION OUTWITH THE UK
5.1 The Organisation for Economic Development and Cooperation (OECD) is a forum where the governments of 30 democracies (the majority of EU countries plus USA, Canada, Australia, New Zealand, Japan and Korea) work together to address economic, social and environmental challenges. The OECD
Directorate for Education produces an annual publication, Education at a Glance (EAG) , which includes tabulations and analysis of quantitative, internationally comparable indicators of participation in higher education. The levels of educational programmes are defined by the International Standard Classification of Education (ISCED) which is produced by the UNESCO Institute of Statistics, working in conjunction with OECD and Eurostat
(UNESCO, 1997). The last revision was in 1997 and the next will be in 2011. Tertiary education is at ISCED levels 5 and 6. Level 5 is divided into 5A which corresponds approximately to Honours degrees, graduate diplomas and certificates and taught Masters degrees (but excluding Masters degrees by research); and level 5B which corresponds approximately to Ordinary degrees, HND, HNC, Dip HE, Cert HE and similar qualifications.
5.2 The OECD indicators for entry into higher education are net entry rates for levels 5A, 5B and postgraduate research students respectively. The net entry rates are the sum of new entrant rates by single years of age for ages 15-29 and by five year age groups for ages 30+. These rates are published
rates are higher than they would be if only UK citizens or residents were counted, because the UK is a net importer of students. The UK is close to the OECD and EU averages for net entry into tertiary-type 5A programmes, higher than average for net entry into tertiary-type 5B programmes and lower than average for entry into level 6 (advanced research) programmes.
5.3 It appears that the definition of ‘new’ entrants used in the UK net entry rates is different from that used in calculating the HEIPR. In this case the definition is based on a direct question to entrants on the lines of 'Have you ever started a higher education course (i.e. above A level or equivalent) in the UK before, and if so did you attend this course for 6 months or more?' The information is
collected by institutions and returned to HESA. No further checking back on previous HESA or FE records is carried out.
5.4 OECD Education At a Glance also publishes national enrolment rates in two tables. Age specific participation rates in all levels of education (called
enrolment rates) are published for ages 15-19, 20-29, 30-39, 40+ (Table C1.1). The 15-19 age group includes substantial numbers of school and further
education students, and the higher age groups include postgraduates. No adjustment is made for international students. This table also contains the age at which compulsory education ends in each country, and the number of years in which over 90% of a country’s population are enrolled in (primary/secondary) education. These data are highly relevant to international comparisons of age specific enrolment rates at ages beyond the end of compulsory education.
5.5 Rates of age specific participation in tertiary education at ages 16, 17, 18, 19, 20 are also published, (Table C1.3). School students are excluded, and there will be very few postgraduates at these ages. No adjustment is made for international students.
5.6 Useful reviews of the pitfalls and subtleties in comparisons of OECD
participation rates have been given by Kaiser and O’Heron (2005), Adelman (2009) and Steyn (2008). Graphs in Kaiser and O’Heron (2005) illustrate, for example, that initial entry tends to occur later in Sweden, Finland and the Netherlands than in the UK. This implies care in comparing age specific entry rates. The age distribution of total enrolment in all levels of HE also varies markedly between UK, Scandinavia and North America. Where countries differ greatly in the average length of time spent in higher education (which may result from differences in the proportions of part-time undergraduates) the use of total headcount enrolment can be highly misleading.
5.7 Consider for example country A where 1000 students per annum enter a 3 year full-time degree at age 18, and country B where 1000 students per annum enter a 6 year part-time degree at age 18. Total headcount enrolment in B would be double that in A. But entry rates would be the same, assuming constant and equal population numbers at each year of age in both countries. The age specific enrolment rate covering the first three years of the degree (age 18-20) would be the same in both countries, but the age specific enrolment rate for ages18-23 would be twice as large for country B than
participation, bearing in mind the modal age of entry into HE and the average length of time spent in HE.
5.8 It is clear that the rates used by OECD do not simply reflect a nation’s effort in higher education, but – arguably more importantly – capture relevant elements of the size and historical weighting of components of the national economy. An obvious example of this is Germany which has a manufacturing export-oriented economy that requires a large skilled crafts and mid-level technical workforce, hence strong vocational and apprenticeship programmes which do not lead to tertiary degrees.
5.9 Commenting on OECD rates Adelman (2009) notes that “neither gross enrolment ratios nor census participation ratios are as instructive for policy purposes as setting the denominator to students who completed upper secondary school in the country at issue. .... Call this the basic qualifying population, as it is the population for which the education system of the country is responsible. It includes academic track, general track, and vocational track upper secondary students. It can be divided by traditional and non-traditional routes. .... One then asks, ‘of the qualifying population, what proportion enters short-cycle degree programs and first cycle degree programs (a) immediately following qualification and (b) within [let us say] three years?’ .... The qualifying population then becomes the core of cohort histories.”
5.10 For Scotland to produce participation statistics based on cohort histories of this kind would require greater reliance on panel studies and longitudinal surveys, enhancing the school-leavers destination survey. Removal of obstacles to data linkage based on data privacy considerations would also help to move towards this objective.
5.11 In addition to an examination of OECD measures we reviewed the official statistics and research literature of several OECD countries, focusing in particular on Sweden, Australia and Canada. One conclusion that emerged was that in some of these countries greater use is made of surveys to explore the issues of participation and its measurement. For instance Canada has regular longitudinal Youth in Transition Surveys (YITS) and a Post Secondary Education Participation Survey (PSEPS). These have enabled the adoption of different definitions of participation for a variety of purposes (Berger et al (2007)).
5.12 Australia publishes age specific participation rates and also uses surveys extensively. Their main headline indicator is ‘People aged 25-64 with a
vocational or higher education qualification’3, though they produce a variety of
supplementary indicators such as ‘Year 7/8 to Year 12 apparent retention rate’ and ‘Level of highest non-school qualification for those aged 25-64’.
5.13 The revision of ISCED which will be implemented in 2011 is currently under review and open to consultation. Sources of inconsistency may arise because countries currently use somewhat different definitions for ISCED5-6 ( tertiary / higher postgraduate education ) and ISCED4 (post-compulsory non-tertiary
education). Particular problems that have been reviewed are : the need to better distinguish between ISCED5A (‘academic’) and ISCED5B (‘vocational’); overlap between ISCED4 and ISCED5B ; and the need for clearer demarcation between first and second degrees under both ISCED5A and ISCED5B.
5.14 To resolve some of these issues the review has proposed replacing the existing classifications by a more detailed structure. This may allow greater flexibility for defining measures of participation in future.
6 MEASURES OF WIDENING PARTICIPATION
6.1 There is a large literature on widening participation. We have not reviewed academic studies of the factors that influence participation of disadvantaged groups, the effectiveness of government policies to encourage wider
participation, and assessment of the macroeconomic benefits that may flow from wider participation. Restricting ourselves to measurement indicators, we have considered the statistics available from HESA and other official sources within the UK and devolved administrations.
Indicators based on Socioeconomic Group
6.2 Since 2001 all national statistics related to socioeconomic group have been based on a seven-level classification (NS-SEC) defined in terms of occupation. The seven levels are : higher managerial and professional; lower managerial and professional; intermediate; small employers and own account workers; lower supervisory and technical; semi-routine; routine. There are two other categories : never worked/long-term unemployed and student/occupation not known.
6.3 At present it appears that Scottish participation statistics do not make any use of socioeconomic group as a category to investigate access to HE.
6.4 HESA widening performance indicators include the percentage of young (< 21) full-time first degree entrants who are in NS-SEC 4,5,6 and 7. The
socioeconomic group of young entrants is determined by the occupation (or most recent occupation if retired/unemployed) of the higher earning parent. For mature entrants the entrant’s own occupation is used4.
6.5 A supplementary table produced by HESA5 compares the value of this statistic between the English regions and Scotland, Wales and Northern
Ireland. For example in 2007/08 the percentages were Scotland 26.3, England 29.4, Wales 30.4, Northern Ireland 40.6. These crude statistics suggest that
4 For one year 2008/09 a different question was asked by UCAS – occupation of higher earning
parent if student was in full-time education and own occupation if student was not in full-time education. It was realised that this raised problems in connection with young students taking gap years so UCAS has reverted to the former question, as indicated above.
young full-time students in Scotland are less likely to come from lower socioeconomic groups than students in other UK administrations. The gap between Scotland and the other UK countries is even a bit bigger when young sub-degree entrants (HND, HNC etc) are considered. However the exclusion of entrants to Scottish colleges could well explain these differences. Note also that the entrants are not disaggregated by domicile, it is entrants of any
domicile to HEIs within the four countries that are being compared.
6.6 In England a widening participation indicator known as FYPSEC (full-time young participation by socio-economic class) has been developed. The methodology is partly based on the HEIPR. The indicator compares the proportion of young people (aged 18-20) in the top three social classes who enter full-time HE with the proportion of young people in the bottom four social classes who enter full-time HE. The gap between these two proportions is an indication of differing access to HE. It is recommended that figures for a single year should not be relied upon (due to some weaknesses with the data), rather the trend over years may be used to evaluate whether participation in HE is indeed widening (Department of Business Innovation and Skills, 2009).
6.7 FYPSEC is only calculated for English domiciled students (Wales and Northern Ireland do not use this indicator). The population denominators are estimated from the Labour Force Survey. These denominators are estimates of the total numbers of young people in England at each of the ages 18, 19 and 20 who come from households where the parents are in NS-SEC 1 to 3 and 4 to 7 respectively. For each of the two socio-economic groupings net initial entry rates at each single year of age 18 – 20 are obtained, and then the sums over age are calculated, following the HEIPR methodology.
6.8 Exact replication of this approach in Scotland would suffer from the fact that there are smaller numbers in the Labour Force Survey in Scotland, and thus there would be less precision in the estimated denominators. A possible alternative approach for Scotland would be to use the Annual Population Survey (APS). The APS is based on a year’s worth of Scottish LFS data with a substantial sample boost, funded by the Scottish Government.
6.9 In Northern Ireland the percent of UCAS accepted applicants who come from SEC 5 to 7 is used as an indicator of social inequality in participation. NS-SEC 4 is omitted because it covers a large element of the Northern Ireland population which cannot be described as particularly deprived in the Northern Ireland context. This indicator would not take account of sub-degree or part-time HE entrants.
Indicators based on Free School Meals
6.10 Free school meal (FSM) eligibility is determined by parental income, and thus provides a limited measure of socio-economic status. Registration for free school meals is widely used as an indicator of deprivation, which can be seen to be linked to attainment levels and attendance rates6. Scotland has data on
pupils registered as entitled to receive free school meals7, but it is not linked to
the HESA database. The Scottish School-leavers Destination Survey (SLDS) publishes the percentages of school-leavers who were in HE a few months after leaving school, by FSM status. For leavers in 2007-08 the rates were 34% for non-FSM and 9% for FSM 8.
6.11 The English National Indicator 1069 looks at the progression rates of pupils from English maintained schools to UK Higher Education Institutions broken down by Free School Meal (FSM) eligibility status and local authority. The measure looks at pupils aged 15 who entered HE by the age of 19. There are currently 2 time points which look at 15 year olds in 2001/02 who entered HE by 2005/06, and 15 year olds in 2002/03 who entered HE by 2006/07. For England as a whole the entry rates are 33% for non-FSM and 14% for FSM giving a gap of 19 percentage points.
6.12 FSM status is determined by the school census in England and the information is incorporated in the National Pupil Database. This is linked to HESA and ILR records allowing Key Stage 4 students to be tracked through to HE. It is considered highly unlikely that matching errors would cause the estimates to vary by more than the level of rounding used.
6.13 Wales has recently withdrawn from the National Pupil Database; free school meal information is collected in its school census10, but this does not seem to be linked to HESA records. Northern Ireland publishes statistics on school leaver qualifications by FSM status11.
Indicators based on areas with low HE participation (POLAR)
6.14 Maps showing all wards in Scotland classified by their YPR quintile were provided in the first version of the POLAR (Participation of Local Areas) project12. These are still available, and probably continue to portray enduring wide geographic differences in HE participation. However they are based on participation rates that are now about 10 years old. A substantial revision, POLAR213, was made in 2005/06. The YPRs for this revision were based on entry into HE of the 2000 to 2004 cohorts.
6.15 In POLAR2 the YPRs are based on entry into all forms of HE and both full-time and part-time modes. Wards are ranked according to their YPR and arranged into quintiles for the purposes of mapping and further analysis.
6.16 So far as HESA is concerned this work seems to have been undertaken mainly for the purpose of providing performance indicators for HEIs. The indicators show the percent of young entrants from areas in the lowest quintile of YPR participation, and the percent of mature entrants who have no previous HE
7http://www.scotland.gov.uk/Publications/2009/06/22104701/0
8 http://www.scotland.gov.uk/Publications/2008/12/08090751/0 Table 12. 9 http://www.esd.org.uk/esdtoolkit/Tree/Root.aspx?Tree=NI&ID=106 10http://www.statswales.wales.gov.uk/ReportFolders/reportFolders.aspx
11http://www.delni.gov.uk/index/publications/r-and-s-stats/ucas-applicants/ucas-acc-app-08.htm 12 http://www.hefce.ac.uk/widen/polar/guide/
qualification and come from areas in the lowest quintile of YPR participation. The indicators are calculated separately for full-time and part-time entrants, and in the case of full-time entrants for first degree, sub-degree and all
undergraduate entrants. The indicators were intended to provide information relevant to the performance of institutions in relation to widening access, but total figures for England, Wales and Northern Ireland are also calculated.
6.17 These performance indicators (PIs) have not been produced for Scottish
institutions because it was felt that ‘the very high proportion of HE that occurs in FE colleges means that the figures for Scottish institutions could, when viewed in isolation, misrepresent their contribution to widening participation’14.
6.18 However the YPRs on which POLAR2 is based have been calculated for all Scottish postcodes; they are published at the level of UK quintiles, but it seems probable that the exact YPR values for Scottish wards or local authority areas would be fairly easily available. Therefore the kinds of measure used in the HESA PIs could probably be calculated at the Scotland level, for example the percent of mature entrants to Scottish institutions who have no previous HE and are from low (relative to UK) participation neighbourhoods (PI Table T2b). Also the Scottish local area YPRs could be recalibrated to establish quintiles of participation relative to a Scottish standard. These statistics would not be based on Scottish domiciled entrants, unless HEFCE or SFC undertook to rework the YPR calculations for this population.
6.19 A difficulty in assessing local variation in participation by mature entrants is that the numerators would be defined by the number of mature entrants in a given area whereas the classification of denominators would be relative to young participation. A suggested alternative would be to classify areas by the proportion of adults without a degree, although the problem of population mobility would remain.
Indicators based on areas grouped by parental education or household income
6.20 Recent work by Corver (2010) describes trends in YPR’s in areas grouped by parental education or household income. A specially commissioned census table allowed areas to be classified by the proportion of children living in families with one graduate parent. This statistic ranged from ten percent in the most disadvantaged quintile to 48 percent in the most advantaged quintile.
6.21 The proportion of children living in households in receipt of income-related benefits or tax credits provided an alternative way of grouping areas. This statistic ranged from 45 percent in the most disadvantaged quintile to 5 percent in the most advantaged quintile.
Indicators based on areas with high levels of deprivation
6.22 Instead of widening access indicators based on areas of low participation Scottish statistics are based on areas with high levels of deprivation. The Scottish Index of Multiple Deprivation (SIMD; Scottish Government, 2009a) ranks local areas in Scotland using a score derived from seven domains of deprivation: income; employment; health; education, skills and training; geographic access and telecommunications; crime; and housing. The lowest ranked areas covering approximately 20% of the population are characterised as ‘most deprived’.
6.23 The Scottish Funding Council has compared gross enrolment rates (relative to the population aged 16+) for the most deprived population with the
corresponding rates for the ‘less deprived’ 80% of the population. Broad age specific participation rates (young 16-20 and mature 21+) were also compared, as were ‘most’ versus ‘less’ deprived participation rates within each local
authority area (Scottish Funding Council, 2009).
6.24 An alternative approach is to compare institutions with respect to the percentage of entrants who come from the most deprived areas. Since by definition the ‘most deprived’ areas cover 20% of the population a crude analysis, ignoring age structure and a host of other factors, might suggest that in a world of equal access 20% of entrants would come from these areas. In fact analysis by the Scottish Government (2009b) showed that in 2007/08 only 8% of entrants to the ancient Scottish universities came from the most deprived areas whereas 22% of entrants into HE programmes in colleges were from these areas. The ‘newer’ universities and the post-92 universities had respectively 12% and 15% of entrants from the most deprived areas. A
variation of these statistics, focusing on full-time first degree entrants, was used in the report on widening access submitted to the Scottish Parliament in
relation to the Graduate Endowment Abolition (Scotland) Act 200815.
Indicators based on level of prior educational achievement
6.25 A study based on linking the English National Pupil Database with HESA and ILR records and a ‘cumulative Key Stage 4 and Key Stage 5’ file provided by the Department for Children Schools and Families (DCSF) allowed Chowdry et al (2008) to examine many factors that potentially influence HE participation. A pertinent conclusion was that ‘socioeconomically disadvantaged students have a similar likelihood of participating in HE to more advantaged students, if they achieve highly at Key Stage 4’. This suggests the importance for the widening access agenda of indicators that describe participation in terms of previous educational attainment.
6.26 The Scottish School Leavers Destination Survey provides information on the proportion of school leavers who enter higher education within a few months of leaving school, and through linkage with the pupil census, permits analysis of
this proportion in relation to highest SCQF qualification attained and total SCQF qualifications attained. It also permits analysis of initial entry rates for young entrants in terms of the deprivation level of the area they live in.
6.27 The initial destinations of school leavers are surveyed in September, around three months after the majority left, but up to nine months after leaving school for those who left at the preceding Christmas. In 2009 a follow up survey of the 2008 cohort of leavers was carried out in March/April, thus about nine months after most had left school. This permitted more reliable estimation of the proportions going into HE directly from school. It is evident however that these surveys may not be able to provide information on people who take less direct routes between school and HE, for example by working for a few years or taking a gap year. Additionally we note that both surveys are aimed primarily at publicly funded schools, and information on leavers from independent schools is limited.
6.28 There are no administrative linkages between individual level school databases and the higher education databases held by HESA and SFC.
7 STRENGTHS AND WEAKNESSES OF CURRENT APPROACHES
7.1 It is clear from the foregoing, that the selection of a measure – or set of measures – to assess participation in higher education is a complex task. A wide variety of measures have been developed, and each has its own strengths and weaknesses.
7.2 Moreover, as can be seen from the detailed descriptions of the approaches adopted in each of the 4 UK administrations, there are specific policy,
administrative and contextual factors which affect the selection of measures.
7.3 The dimensions of quality defined for National Statistics (Relevance, Accuracy, Completeness, Timeliness, Clarity, Coherence, Comparability) provide a useful framework for commenting on the various types of measure but also raise further questions about the specific uses of individual measures (relevance can only be defined in relation to the purpose for which a measure has been
developed) and also about the hierarchy amongst these various elements (for example, comparability may be thought by some stakeholders to be more important than timeliness; clarity may be thought by others to be more important than accuracy).
7.4 In addition, a key question relevant to the selection of (a) measure(s), is the amount of resource required to undertake any proposed development work, as well as the resource required to implement any new measures on an ongoing basis.
Table 1 Strengths and Weaknesses of Methods of Measuring Overall Participation
Methods of Measuring Overall Participation
Strengths Weaknesses
Gross Enrolment Rate Simple measure to produce; easy for
stakeholders to understand
Over simplistic – may be misinterpreted when used for making comparisons between countries; based on
enrolment only which may be very different to ‘real
engagement’ or completion
Age Specific Participation Rates Reasonably straightforward to produce; fairly easy for stakeholders to understand; can usually be
disaggregated by level of HE and mode of study
Influenced by many external factors which mean
comparisons between countries can be misleading; based on enrolment only; sensitive to rapid changes in population size
Initial Entry Rates / API/ Net Entry Rates
Conceptual clarity – each individual counted only once; comparisons between countries are not confounded to such a degree by external factors
Difficult to define and exclude individuals with previous experience of HE; net entry rates are difficult for
stakeholders to understand; labour intensive to produce given the requirement to screen out previous participants; changes over time are influenced by demographic and economic factors; based on entry only with no focus on ‘real engagement’ or completion
True Cohort Participation Rates Not so susceptible to fluctuations in the population sizes of successive cohorts;
Fairly difficult for stakeholders to understand; there is a delay / time lag of at least a year before it can be calculated.
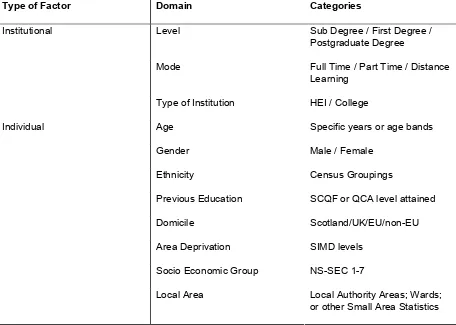
7.7 Table 2 captures the main dimensions along which stakeholders are likely to vary in terms of their assessments, by presenting the key domains relevant to the assessment of participation.
Table 2 Domains relevant to the assessment of measures of participation
Type of Factor Domain Categories
Level Sub Degree / First Degree / Postgraduate Degree
Mode Full Time / Part Time / Distance Learning
Institutional
Type of Institution HEI / College
Age Specific years or age bands
Gender Male / Female
Ethnicity Census Groupings
Previous Education SCQF or QCA level attained
Domicile Scotland/UK/EU/non-EU
Area Deprivation SIMD levels
Socio Economic Group NS-SEC 1-7 Individual
Local Area Local Authority Areas; Wards; or other Small Area Statistics
8 THE STAKEHOLDER CONSULTATION
8.1 The stakeholder consultation comprised two elements. The first element was a telephone survey, supplemented by two group interviews. The second element was an online questionnaire survey. Further details of the coverage and
methodological approach to the stakeholder consultation are given in Paragraphs 8.3-8.7 below.
8.2 Paragraphs 8.8-8.28 report the findings of the telephone survey, whilst Paragraphs 8.29-8.46 report the findings of the online survey. The overall findings of the stakeholder exercise, bringing together both elements of the consultation are set out in Paragraphs 8.47-8.48.
Methodological Approach and Survey Coverage