1
Official Statistics Release
Policy area: Maintained schools inspections and outcomes
Theme: Education, children’s services and skills
Published on: 6 March 2012
Coverage: England
Period covered: 1 October 2011 to 31 December 2011
Status: PROVISIONAL
Issued by:
Office for Standards in Education, Children’s Services and Skills (Ofsted)
125 Kingsway London
WC2B 6SE
Responsible director: Jean Humphrys
Statistician: Anita Patel
Public enquiries: enquiries@ofsted.gov.uk
Press enquiries: pressenquiries@ofsted.gov.uk
Link to official statistics release
web page: www.ofsted.gov.uk/resources/official-statistics-maintained-school-inspections-and-outcomes
Publication medium: Ofsted website
Publication frequency: Quarterly
2
Introduction
From 1 January 2012 inspections of maintained schools have taken place under a new framework, in accordance with Section 5 and 8 of the Education Act 2005. The new framework reflects
amendments made to this Act by the Education Act 2011. The results of these inspections will be reported in our next quarterly release on 12 June 2012.
This official statistics release reports on inspections and outcomes of maintained schools
inspections that occurred prior to the introduction of this new framework, between 1 October 2011 and 31 December 2011 under Section 5 and 8 of the Education Act 2005.
These statistics are based on provisional data and are subject to change. Ofsted will release final statistics for this period on 12 June 2012.
This release also includes the most recent inspection outcomes for all maintained schools that have been inspected at 31 December 2011. This provides a picture of the ‘state of the nation’s schools’ as indicated by inspection outcomes.
Many schools have recently been approved by the Secretary of State to convert to become an academy school. This involves the predecessor school closing and reopening as a new legal entity, in some cases merging with other schools or otherwise changing in the process. Very few of these new academies have been inspected by Ofsted subsequent to their conversion. For the purposes of these aggregated statistics, where an academy converter school has not been inspected, the
inspection judgements of the predecessor school are included. However, it is important to recognise that the academy and the predecessor school are different legal entities.
3
Contents
Introduction ... 2
Key findings ... 5
Impact of revisions on key points of previous release ... 7
Methodology ... 8
Chart 1: Overall effectiveness of maintained schools inspected between 1 September 2005 and 31 December 2011 (provisional) ... 11
Chart 2: Overall effectiveness of maintained schools inspected between 1 October 2011 and 31 December 2011, by phase (provisional) ... 12
Chart 3: Key inspections judgements for maintained schools inspected between 1 October 2011 and 31 December 2011 (provisional) ... 13
Chart 4: Most recent overall effectiveness of maintained schools inspected at 31 December 2011 (provisional) ... 14
Chart 5: Most recent overall effectiveness of maintained schools at 31 December 2011 compared to the most recent overall effectiveness at 31 August 2011, 31 August 2010 and 31 August 2009 (provisional) ... 15
Table 1: Number of maintained schools inspected between 1 October 2011 and 31 December 2011, by inspection type (provisional) ... 16
Table 2: Inspection outcomes of maintained schools inspected between 1 October 2011 and 31 December 2011 (provisional) ... 17
Table 3: Inspection outcomes for selected judgements of maintained schools inspected at their most recent inspection at 31 December 2011 (provisional) 1 2 3 ... 18
Table 4: Most recent overall effectiveness outcome of maintained schools that closed between 1 October 2011 and 31 December 2011 (provisional) ... 19
Table 5: Number of maintained schools placed into, removed from and closed while in a category of concern between 1 October 2011 and 31 December 2011 (provisional) 1 ... 20
Table 6: Most recent overall effectiveness for schools inspected at 31 December by local authority and government office region (provisional) ... 21
4
Section 5 Inspection ... 23
Categories of concern ... 24
Interim assessment ... 24
5
Key findings
Year to date
Chart 1 shows that between 1 September 2011 and 31 December 2011 there were 2,225
maintained schools inspections. Of these, 16% (366) were found outstanding for their overall effectiveness, 47% (1,048) were judged good, 31% (683) were judged satisfactory and 6% (128) were found inadequate.
Compared to the 2010/11 academic year, the proportion of maintained schools found
outstanding between 1 September 2011 and 31 December 2011 is higher by five percentage points. The proportion of schools judged satisfactory is also lower by seven percentage points.
Since the beginning of the section 5 inspection framework on 1 September 2005, the
percentage of schools found outstanding has varied between 11% and 19%. The percentage of schools found inadequate has varied between 4% and 8%.
State of the nation’s schools
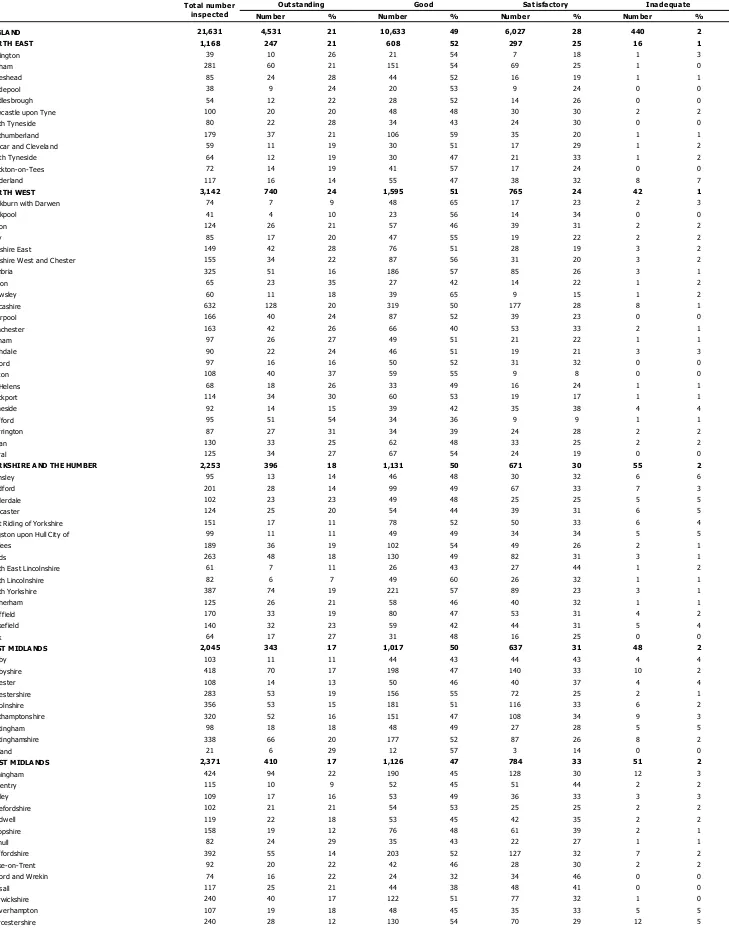
Chart 4 shows that at 31 December 2011 there were 21,631 maintained schools that had
been inspectedunder section 5 arrangements since September 2005. Of these, 21% (4,531)
were judged outstanding for their overall effectiveness at their most recent inspection, 49% (10,633) were judged good, 28% (6,027) were judged satisfactory and 2% (440) judged inadequate; of these, 1% (170) has been given a notice to improve and 1% (270) placed in special measures.
Table 6 shows that regionally, London has the highest proportion of schools found good or
outstanding at their most recent inspection (75%). Those in the West Midlands region were most likely to be judged satisfactory or inadequate (35%).
Nurseries continue to be the phase of education that is most likely to be judged outstanding
(55%) while primary schools are least likely to be judged outstanding (18%).
Pupil referral units and secondary schools were the two phases of education most likely to
be judged inadequate.
The overall effectiveness was higher than the quality of teaching judgement in 6% of
schools at their most recent inspection.
Latest quarter
Chart 2 shows that of the 1,679 maintained schools in England inspected between 1 October
6 46% (769) were judged good, 31% (517) were judged satisfactory and 6% (99) of schools were inadequate. Of those judged inadequate, 3% (48) were given a notice to improve and 3% (49) were placed in special measures1.
Chart 3 shows that of the 1,679 schools inspected, a judgement was made about the overall
effectiveness of the Early Years Foundation Stage provision on 1,260 inspections. Sixteen per cent (199) were judged outstanding, 65% (816) good, 19% (238) satisfactory and 1% (7) judged inadequate.
A judgement was made about the overall effectiveness of the sixth form provision on 204
inspections during this period. Eighteen per cent (37) were judged outstanding, 42% (85) good, 38% (77) satisfactory and 2% (5) judged inadequate.
There is a strong relationship between the overall effectiveness judgement and the
judgement on the quality of teaching, with the same judgement being made on 88% of inspections in this period.
Of the 294 outstanding schools inspected this quarter, 172 (59%) were judged to have
outstanding teaching and 122 (41%) were judged to have good teaching.
In 39% of schools inspected this quarter, behaviour was given a higher judgement than the
school’s overall effectiveness.
In 71% of schools inspected this quarter, leadership and management was good or
outstanding.
There were 69 academies (45 academy converters and 24 sponsor-led academies) inspected
during the period. Of those that have converted to become an academy, 19 were judged to have outstanding overall effectiveness while two were found inadequate.
Of the 24 sponsor-led academies inspected during the period, seven were found to be
outstanding, five were good, ten were satisfactory and two were inadequate.
Of the 23 2 schools that closed during the period, one school was judged outstanding for
overall effectiveness in their most recent inspection, six were good, ten were satisfactory and six inadequate.3
1 Data excludes one secondary school that remained in special measures and one primary school that remained in notice to improve
after re-inspection.
2During the reporting period four schools closed as a result of amalgamation, 18 closed to become sponsor-led academies and one
closed to become a local authority maintained nursery school.
7
Impact of revisions on key points of previous release
Final data covering the period 1 July 2011 to 30 September 2011 have been released and
can be found on the Ofsted website:
http://www.ofsted.gov.uk/resources/official-statistics-maintained-school-inspections-and-outcomes
The revised data includes inspection outcomes relating to a further 23 inspections which
took place between 1 July 2011 and 30 September 2011: one nursery school, thirteen primary schools, four secondary schools, two special schools and three pupil referral units. Twenty-two of these schools were found to have inadequate overall effectiveness and one school was found to have good overall effectiveness.4
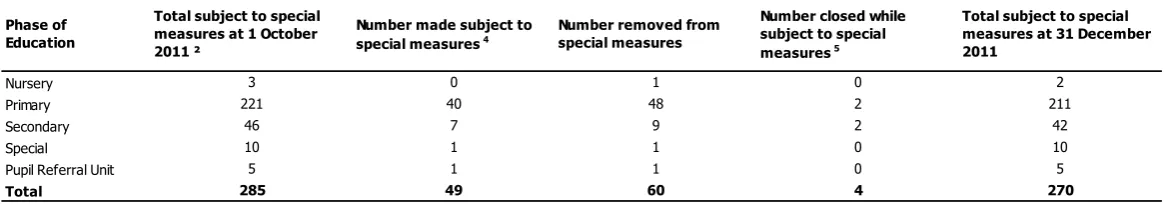
Based on the revised data, there were 285 schools in special measures and 168 schools in
notice to improve at 30 September 2011.
Most recent inspections data now include all judgements associated with pilots inspections
for the new framework which took place in the 2010/11 academic year. The reasons for this are explained in the methodology section.
4 If a school is placed in a category of concern, the time to release is extended so that the judgements can be moderated by senior
8
Methodology
1. Ofsted is required to inspect all schools subject to Section 5 of the Education Act 2005 within a specified period (see glossary). Ofsted selects schools for inspection on a proportionate basis through a system of risk assessment. Those schools that Ofsted judge would benefit
most are selected for more frequent inspection.Therefore those inspected during the
quarter may not be representative of all schools in England as a whole.
2. Data in this release are from inspections undertaken between 1 October 2011 and 31
December 2011 or most recent inspections at 31 December 2011 under Section 5 and Section 8 of the Education Act 2005 where the inspection report was published by 31 January 2012.
3. The impact of risk assessment on the sample of schools is that many fewer previously good
schools are inspected than would be the case if a proportionate approach to inspection were not employed. Previously outstanding schools have had their inspections deferred. These previously outstanding schools will not be inspected unless a complaint has been raised regarding the school or the risk assessment identifies these schools are at risk of declining performance.
4. The release contains key judgements and full details of published inspection outcomes which
can be found in an underlying dataset in csv (comma separated value) and Microsoft Excel formats.
5. The inspection framework for maintained schools that applies to data in this release was
published in September 2009. Inspections taking place prior to September 2009 took place under a previous framework. Information about the current inspection framework and previous inspection frameworks and how Ofsted inspects maintained schools can be found on the Ofsted website at:
http://www.ofsted.gov.uk/schools/for-schools/inspecting-schools
6. Statistics relating to inspections undertaken in the most recent quarter are provisional and include inspections in the period where the inspection report was published within one
month of the end of the quarter. If exceptionally, an inspection report is published later than one month after the end of the quarter in which the inspection took place, it will be included in the final release of the statistics.
7. Ofsted undertakes moderation of all inspection reports where a school is found to require
9
8. Where the most recent inspection outcome of a school that took place during the reporting
period was not published, the previous inspection outcome will be used for the school’s most recent inspection.
9. Revisions are published in line with Ofsted’s revisions policy for official statistics. For more information about the policy please visit the Ofsted website:
www.ofsted.gov.uk/resources/statistical-notice-ofsted-revisions-policy-for-official-statistics
10.Maintained schools are allocated to local authority areas according to their postcode, using the National Statistics Postcode Directory.
11.A small proportion of early years registered providers are inspected concurrently with a school. The outcomes for these providers are reported through an integrated inspection report covering the requirements of Section 5 (for the school) and Section 49 & 50 of the Childcare Act 2006 (for the registered childcare provision). Integrated inspection reports may also cover the requirements of the Children Act 1989 and the Care Standards Act 2000 for boarding provision. The inspection outcomes from these providers are included in this release.
12.Early years registered childcare provision is inspected under Section 49 of the Childcare Act 2006. Where the provision is managed by the school, the Section 49 inspection may be carried out concurrently with the Section 5 inspection and the quality of the provision
reported in a single inspection report. However, where registered provision on a school’s site is managed by a private, voluntary and/or independent provider, it is inspected separately under the Childcare Act 2006; in these circumstances, the inspection may be scheduled to take place at the same time as the school’s Section 5 inspection.
13.The welfare provision for boarding and residential special schools is inspected at the same time as the S5 inspection, if possible. The integrated inspection of the residential/boarding provision contains five major judgements. The Evaluation schedule for the inspection of boarding and residential provision in schools can be found at:
http://www.ofsted.gov.uk/resources/evaluation-schedule-for-inspection-of-boarding-and-residential-provision-schools
14.From 1 January 2012 inspection events and their outcomes for maintained schools will be
reported under a new framework in accordance with Section 5 and 8 of the Education Act 2011. Inspection and outcomes from 1 January 2012 will be reported in our next quarterly release on 12 June 2012. Information regarding the new inspection framework can be found on the Ofsted website:
10 All judgements made during these inspections map across frameworks and have been
included in the relevant tables and charts. This will reduce the number of judgements reports from 40 (including boarding, EYFS and post-16 judgements) to 10 (including boarding judgements).
15.As a result of a proportionate inspection process, inspections of weaker schools are brought forward. These weaker schools will no longer have the 2005 achievement judgement and will instead have the 2009 judgement: 'Pupils' achievement and the extent to which they enjoy their learning'. 'How well do learners achieve?' judgement is therefore more positive.
16.To allow comparisons between inspection frameworks, the judgements made for inspections
conducted after 1 January 2012 (and those of the pilot inspections that took place in the 2010/11 academic year) will be mapped to the judgements of the 2009 inspection
framework as follows:
‘Overall effectiveness’ remains unchanged;
‘Achievement of pupils and the extent to which they enjoy their learning’ will be
mapped against ‘Achievement of pupils at the school’;
‘Pupils' behaviour’ will be mapped against ‘Behaviour and safety of pupils at the
school’;
‘Quality of teaching’ will be mapped against ‘Quality of teaching in the school’;
‘The effectiveness of leadership and management in embedding ambition and driving
improvement’ will be mapped against ‘Quality of leadership in and management of the school’.
11
Chart 1: Overall effectiveness of maintained schools inspected between 1 September 2005 and 31 December 2011 (provisional) ¹ ²
Number of schools
Outstanding Good Satisfactory Inadequate Total
1 September 2011 to 31 December 2011 366 1,048 683 128 2,225
2010/11 617 2,622 2,166 321 5,726
2009/10 782 2,631 2,281 477 6,171
2008/09 1,327 3,512 1,955 271 7,065
2007/08 1,146 3,839 2,507 375 7,867
2006/07 1,150 3,899 2,810 464 8,323
2005/06 648 2,933 2,064 483 6,128
1. Percentages in the chart are rounded and may not add to 100. 2. Based on Edubase as at 3 January 2012.
Academic year Overall effectiveness
Source: Ofsted inspections
11 14
15 19 13 11
16
48 47
49 50 43 46
47
34 34
32 28 37
38 31
8 6
5 4 8
6 6
2005/06 (6,128) 2006/07 (8,323) 2007/08 (7,867) 2008/09 (7,065) 2009/10 (6,171) 2010/11 (5,726) 1 September 2011 to 31 December 2011 (2,225)
Overall effectiveness by academic year (percentages)
12
Chart 2: Overall effectiveness of maintained schools inspected between 1 October 2011 and 31 December 2011, by phase (provisional) 1
Number of schools
Outstanding Good Satisfactory Inadequate Total
Nursery 19 16 1 0 36
Primary 196 605 406 78 1,285
Secondary 49 87 83 18 237
Special 25 36 14 2 77
Pupil referral unit 5 25 13 1 44
All schools 294 769 517 99 1,679
Source: Ofsted inspections
1. Where the number of inspections is small, percentages should be treated with caution.
Phase Overall effectiveness
53
15
21
32
11
18
44
47
37
47
57
46
3
32
35
18
30
31
6
8
3
2
6 Nursery (36)
Primary (1,285)
Secondary (237)
Special (77)
Pupil referral unit (44)
All schools (1,679)
Overall effectiveness by phase of education (percentages)
13
Chart 3: Key inspections judgements for maintained schools inspected between 1 October 2011 and 31 December 2011 (provisional) 1
Number of schools
Outstanding Good Satisfactory Inadequate Total
294 769 517 99 1,679
260 807 518 94 1,679
173 932 515 59 1,679
Pupils' behaviour 424 1,074 176 5 1,679
320 870 429 60 1,679
37 85 77 5 204
199 816 238 7 1,260
1. Percentages in the chart are rounded and may not add to 100. Overall effectiveness of the sixth form
Overall effectiveness: how good is the school
The effectiveness of leadership and management in embedding ambition and driving improvement
Judgement All schools
Overall effectiveness of the Early Years Foundation stage
Source: Ofsted inspections Pupils' achievement and the extent to which they enjoy their learning
Quality of teaching
18
15
10
25
19
18
16
46
48
56
64
52
42
65
31
31
31
10
26
38
19 6
6
4
4
2
1
Overall effectiveness: how good is the school (1,679)
Pupils' achievement and the extent to which they enjoy their learning (1,679)
Quality of teaching (1,679)
Pupils' behaviour (1,679)
The effectiveness of leadership and management in embedding ambition and driving improvement (1,679)
Overall effectiveness of the sixth form (204)
Overall effectiveness of the Early Years Foundation stage (1,260)
Key inspection judgements for inspected maintained schools (percentages)
14
Chart 4: Most recent overall effectiveness of maintained schools inspected at 31 December 2011 (provisional) 1 2 3 Number of schools
Outstanding Good Satisfactory Inadequate Total
Nursery 230 174 16 2 422
Primary 3,016 8,545 4,825 330 16,716
Secondary 811 1,264 912 82 3,069
Special 399 454 168 16 1,037
Pupil referral unit 75 196 106 10 387
All schools 4,531 10,633 6,027 440 21,631
1. Percentages in the chart are rounded and may not add to 100. 2. Based on Edubase as at 3 January 2012.
3. Data includes the most recent judgements for predecessor schools of academy converters that has not been inspected as an academy converter.
Phase Overall effectiveness
Source: Ofsted inspections
55
18
26
38
19
21
41
51
41
44
51
49
4
29
30
16
27
28
2
3
2
3
2
Nursery (422)
Primary (16,716)
Secondary (3,069)
Special (1,037)
Pupil referral unit (387)
All schools (21,631)
Most recent overall effectiveness of schools inspected (percentages)
15
Chart 5: Most recent overall effectiveness of maintained schools at 31 December 2011 compared to the most recent overall effectiveness at 31 August 2011, 31 August 2010 and 31 August 2009 (provisional) 1 2 3 4
Number of schools
Outstanding Good Satisfactory Inadequate Total
31 Dec 20115 4,531 10,633 6,027 440 21,631
31 Aug 20115 4,282 10,901 6,207 455 21,845
31 Aug 2010 3,863 11,034 6,538 573 22,008
31 Aug 2009 3,593 11,143 7,058 377 22,171
1. Figures in 2010/11 include pilot inspection outcomes. 2. Percentages in the chart are rounded and may not add to 100.
3. Data based on Edubase at the end (or as close to) the end of each academic year.
5. Data includes the most recent judgements for predecessor schools of academy converters that has not been inspected as an academy converter.
Latest inspection at: Overall effectiveness
Source: Ofsted inspections
4. The impact of risk assessment on the sample of schools is that many fewer previously good schools are inspected and previously outstanding schools have had their inspections deferred. See paragraph 3 of the Methodoloy section in the Key Findings document for more information.
16 18 20
21
50 50
50 49
32 30 28 28
2 3 2 2
at 31 Aug 2009 (22,171) at 31 Aug 2010
(22,008) at 31 Aug 2011
(21,845) at 31 Dec 2011
(21,631)
Most recent overall effectiveness of schools inspected at 31 December 2011 compared to the most recent overall effectiveness at 31 August 2011, 31 August 2010
and 31 August 2009
16
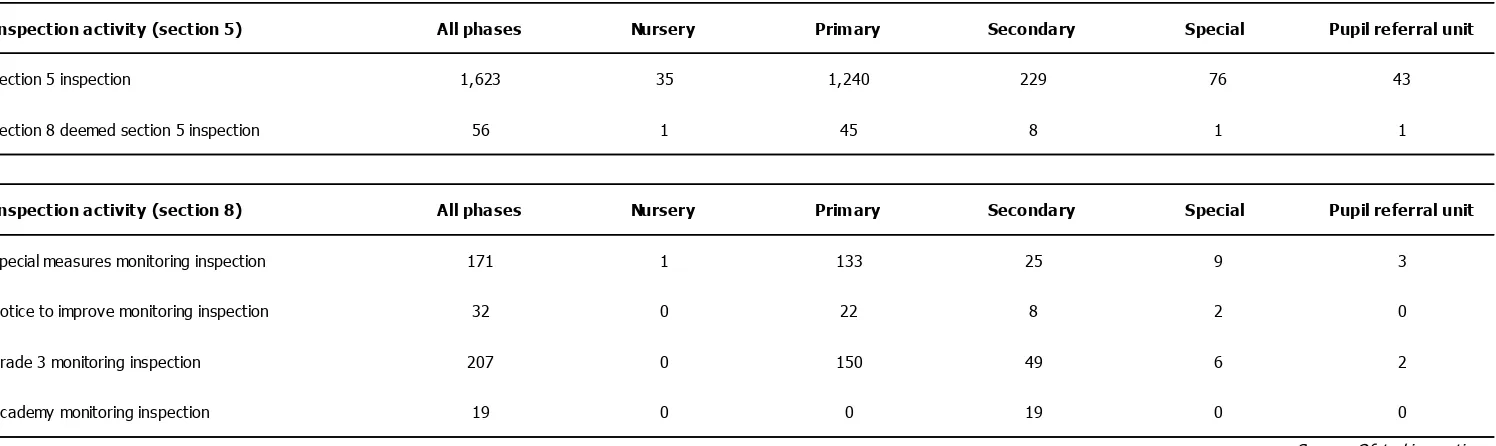
Table 1: Number of maintained schools inspected between 1 October 2011 and 31 December 2011, by inspection type (provisional) 1 2
Number of schools
Inspection activity (section 5) All phases Nursery Primary Secondary Special Pupil referral unit
Section 5 inspection 1,623 35 1,240 229 76 43
Section 8 deemed section 5 inspection 56 1 45 8 1 1
Inspection activity (section 8) All phases Nursery Primary Secondary Special Pupil referral unit
Special measures monitoring inspection 171 1 133 25 9 3
Notice to improve monitoring inspection 32 0 22 8 2 0
Grade 3 monitoring inspection 207 0 150 49 6 2
Academy monitoring inspection 19 0 0 19 0 0
Source: Ofsted inspections 1. Primary, secondary and special academy converters included with primary, secondary and special phases respectively.
17
Table 2: Inspection outcomes of maintained schools inspected between 1 October 2011 and 31 December 2011 (provisional) 1 2 3
Number % Number % Number % Number %
Overall effectiveness: how good is the school 1,679 294 18 769 46 517 31 99 6
Outcomes for individuals and groups of pupils/children 1,679 344 20 723 43 519 31 93 6
The school's capacity for sustained improvement 1,679 279 17 894 53 448 27 58 3
Pupils' achievement and the extent to which they enjoy their learning 1,679 260 15 807 48 518 31 94 6
Pupils' attainment 2 3 1,622 200 12 428 26 809 50 185 11
The quality of pupils' learning and their progress 1,679 192 11 887 53 522 31 78 5
The quality of learning for pupils with special educational needs and/or disabilities and
their progress 1,679 227 14 898 53 489 29 65 4
The extent to which pupils feel safe 1,679 635 38 967 58 74 4 3 0
Pupils' behaviour 1,679 424 25 1,074 64 176 10 5 0
The extent to which pupils adopt healthy lifestyles 1,679 470 28 1,073 64 136 8 0 0
The extent to which pupils contribute to the school and wider community 1,679 471 28 969 58 238 14 1 0
The extent to which pupils develop workplace and other skills that will contribute to
their future economic well-being 1,679 257 15 739 44 610 36 73 4
Pupils' attendance 2 1,679 414 25 659 39 536 32 70 4
The extent of pupils' spiritual, moral, social and cultural development 1,679 441 26 1,000 60 236 14 2 0
The quality of teaching 1,679 173 10 932 56 515 31 59 4
The use of assessment to support learning 1,679 174 10 860 51 582 35 63 4
The extent to which the curriculum meets pupils' needs, including, where relevant,
through partnerships 1,679 307 18 908 54 426 25 38 2
The effectiveness of care, guidance and support 1,679 693 41 829 49 141 8 16 1
The effectiveness of leadership and management in embedding ambition and driving
improvement 1,679 320 19 870 52 429 26 60 4
The leadership and management of teaching and learning 1,679 253 15 923 55 441 26 62 4
The effectiveness of the governing body in challenging and supporting the school so
that weaknesses are tackled decisively and statutory responsibilities met 1,679 215 13 882 53 520 31 62 4
The effectiveness of the school's engagement with parents and carers 1,679 456 27 965 57 255 15 3 0
The effectiveness of partnerships in promoting learning and well-being 1,679 498 30 907 54 243 14 31 2
The effectiveness with which the school promotes equality of opportunity and tackles
discrimination 1,679 321 19 832 50 459 27 67 4
The effectiveness of safeguarding procedures 1,679 311 19 1,055 63 302 18 11 1
The effectiveness with which the school promotes community cohesion 1,679 237 14 885 53 547 33 10 1
The effectiveness with which the school deploys resources to achieve value for
money 1,679 330 20 735 44 521 31 93 6
Overall effectiveness of the Early Years Foundation stage 1,260 199 16 816 65 238 19 7 1
Outcomes for children in the Early Years Foundation Stage 1,260 199 16 827 66 227 18 7 1
The quality of provision in the Early Years Foundation Stage 1,260 199 16 824 65 230 18 7 1
The effectiveness of leadership and management of the Early Years Foundation
Stage 1,260 213 17 817 65 224 18 6 0
Overall effectiveness of the sixth form 204 37 18 85 42 77 38 5 2
Outcomes for students in the sixth form 204 37 18 84 41 78 38 5 2
The quality of provision in the sixth form 204 40 20 93 46 66 32 5 2
The effectiveness of leadership and management of the sixth form 204 47 23 93 46 60 29 4 2
Overall effectiveness of the residential or boarding provision4 8 3 .. 3 .. 1 .. 1 ..
Outcomes for residential or boarding pupils4 8 3 .. 5 .. 0 .. 0 ..
The quality of residential or boarding provision and care4 8 2 .. 4 .. 2 .. 0 ..
Residential and boarding pupil's safety4 8 3 .. 3 .. 1 .. 1 ..
Leadership and management of the residential or boarding provision4 8 2 .. 4 .. 1 .. 1 ..
Source: Ofsted inspections 1. Percentages are rounded and may not add to 100.
2. The judgements for pupils' attainment and pupils' attendance are high, above average, average and low. 3. Not all special schools are given an attainment grade due to insufficient evidence.
4. Perecenatges are not shown where total numbers are small.
Total number inspected
Inadequate
18
Table 3: Inspection outcomes for selected judgements of maintained schools inspected at their most recent inspection at 31 December 2011 (provisional) 1 2 3
Outcome Number % Number % Number % Number % Number % Number %
Overall effectiveness: how good is the school 4 Outstanding 4,531 21 230 55 3,016 18 811 26 399 38 75 19
Good 10,633 49 174 41 8,545 51 1,264 41 454 44 196 51
Satisfactory 6,027 28 16 4 4,825 29 912 30 168 16 106 27
Inadequate 440 2 2 0 330 2 82 3 16 2 10 3
Total 21,631 100 422 100 16,716 100 3,069 100 1,037 100 387 100
Outstanding 1,546 11 142 42 935 9 287 14 172 22 10 3 Good 6,743 49 178 53 5,072 49 850 43 453 58 190 63 Satisfactory 5,033 37 14 4 4,015 39 768 39 143 18 93 31
Inadequate 407 3 1 0 309 3 77 4 12 2 8 3
Total 13,729 100 335 100 10,331 100 1,982 100 780 100 301 100
How well do learners achieve? 5 6 Outstanding 2,569 33 51 59 1,919 30 434 40 143 56 22 26
Good 4,364 55 35 40 3,674 58 515 47 93 36 47 55 Satisfactory 969 12 1 1 792 12 138 13 21 8 17 20
Inadequate 0 0 0 0 0 0 0 0 0 0 0 0
Total 7,902 100 87 100 6,385 100 1,087 100 257 100 86 100
Aggregate achievement 4 5
Outstanding 4,115 19 193 46 2,854 17 721 23 315 30 32 8
Good 11,107 51 213 50 8,746 52 1,365 44 546 53 237 61
Satisfactory 6,002 28 15 4 4,807 29 906 30 164 16 110 28
Inadequate 407 2 1 0 309 2 77 3 12 1 8 2
Total 21,631 100 422 100 16,716 100 3,069 100 1,037 100 387 100
The quality of teaching 4 Outstanding 3,366 16 217 51 2,397 14 393 13 307 30 52 13
Good 12,216 56 188 45 9,509 57 1,729 56 550 53 240 62
Satisfactory 5,774 27 16 4 4,591 27 904 29 172 17 91 24
Inadequate 275 1 1 0 219 1 43 1 8 1 4 1
Total 21,631 100 422 100 16,716 100 3,069 100 1,037 100 387 100
Pupils' behaviour 4 7
Outstanding 7,904 37 300 71 6,130 37 854 28 523 50 97 25
Good 12,066 56 120 28 9,547 57 1,733 57 441 43 225 58
Satisfactory 1,585 7 2 0 998 6 458 15 66 6 61 16
Inadequate 56 0 0 0 25 0 20 1 7 1 4 1
Total 21,611 100 422 100 16,700 100 3,065 100 1,037 100 387 100
Outstanding 5,054 23 238 56 3,358 20 946 31 426 41 86 22
Good 11,518 53 166 39 9,154 55 1,520 50 463 45 215 56
Satisfactory 4,768 22 16 4 3,976 24 560 18 137 13 79 20
Inadequate 291 1 2 0 228 1 43 1 11 1 7 2
Total 21,631 100 422 100 16,716 100 3,069 100 1,037 100 387 100
1. Data based on Edubase at the end (or as close to) the end of each reporting month and the data may differ from that stated in the other tables of this release. 2. Data includes the most recent judgements for predecessor schools of academy converters that has not been inspected as an academy converter.
3. Percentages are rounded and may not add to 100.
4. Inspections include pilot inspection outcomes occuring in the 2010/11 academic year.
7. In May and June of the 2006/07 academic year Ofsted completed a number of Phase 2 Reduced Tariff inspections which had no comparable behaviour judgement.
Source: Ofsted inspections
Secondary
All phases Nursery
6. As a result of a proportionate inspection process, inspections of weaker schools are brought forward. These weaker schools will no longer have the 2005 achievement judgement and will instead have the 2009 judgement: 'Pupils' achievement and the extent to which they enjoy their learning'. 'How well do learners achieve?' judgement is, therefore, more positive.
Primary Special
The effectiveness of leadership and management in embedding ambition and driving improvement 4
5. Pupils' achievement and the extent to which they enjoy their learning judgement was introduced on 1 September 2009. Prior to this a different judgement, 'How well do learners achieve?', was made. While these judgements are not directly comparable, they have been aggregated in the table to present the state of the nation.
Pupil referral unit
19
Table 4: Most recent overall effectiveness outcome of maintained schools that closed between 1 October 2011 and 31 December 2011 (provisional) 1 2
Nursery Primary Secondary Special Pupil referral unit
Number Number Number Number Number
Outstanding 1 1 0 0 0 0
Good 6 0 0 3 0 3
Satisfactory 10 0 1 9 0 0
Inadequate 6 0 3 3 0 0
Total 23 1 4 15 0 3
Source: Ofsted inspections
1. School closing information based on Edubase as at 3 January 2012. 2. Excludes schools that have converted to academies.
3. Four schools closed as a result of amalgamation, 18 closed to become sponsor-led academies and one closed to become a local authority maintained nursery school. Overall effectiveness
20
Table 5: Number of maintained schools placed into, removed from and closed while in a category of concern between 1 October 2011 and 31 December 2011 (provisional) 1
Maintained schools placed in, removed from and closing while in special measures between 1 October 2011 and 31 December 2011
Phase of Education
Total subject to special measures at 1 October 2011 ²
Number made subject to
special measures 4 Number removed from special measures
Number closed while subject to special measures 5
Total subject to special measures at 31 December 2011
Nursery 3 0 1 0 2
Primary 221 40 48 2 211
Secondary 46 7 9 2 42
Special 10 1 1 0 10
Pupil Referral Unit 5 1 1 0 5
Total 285 49 60 4 270
Maintained schools placed in, removed from and closing while in notice to improve between 1 October 2011 and 31 December 2011
Phase of Education
Total requiring significant improvement 1 October 2011 ³
Number given a notice to
improve 4 Number removed from notice to improve
Number closed while subject to notice to improve 5
Total requiring significant improvement at 31 December 2011
Nursery 0 0 0 0 0
Primary 111 37 28 1 119
Secondary 44 10 13 1 40
Special 6 1 1 0 6
Pupil Referral Unit 8 0 3 0 5
Total 169 48 45 2 170
2. Schools subject to special measures are those that, when inspected, were failing to give their pupils an acceptable standard of education and in which the persons responsible for leading, managing or governing the school were not demonstrating the capacity to secure the necessary improvement in the school.
3. Schools requiring significant improvement are those that, when inspected, although not requiring special measures, were performing significantly less well than they might in all the circumstances reasonably be expected to perform. Ofsted issues such schools with a notice to improve.
1. Seven primary schools and one secondary school that were previously in notice to improve were found to require special measures after reinspection this quarter.
5. Information on closed schools based on Edubase as at 3 January 2012.
21
Table 6: Most recent overall effectiveness for schools inspected at 31 December by local authority and government office region (provisional) 1 2 3
Number % Number % Number % Number %
21,631 4,531 21 10,633 49 6,027 28 440 2
1,168 247 21 608 52 297 25 16 1
39 10 26 21 54 7 18 1 3
281 60 21 151 54 69 25 1 0
85 24 28 44 52 16 19 1 1
38 9 24 20 53 9 24 0 0
54 12 22 28 52 14 26 0 0
100 20 20 48 48 30 30 2 2
80 22 28 34 43 24 30 0 0
179 37 21 106 59 35 20 1 1
59 11 19 30 51 17 29 1 2
64 12 19 30 47 21 33 1 2
72 14 19 41 57 17 24 0 0
117 16 14 55 47 38 32 8 7
3,142 740 24 1,595 51 765 24 42 1
74 7 9 48 65 17 23 2 3
41 4 10 23 56 14 34 0 0
124 26 21 57 46 39 31 2 2
85 17 20 47 55 19 22 2 2
149 42 28 76 51 28 19 3 2
155 34 22 87 56 31 20 3 2
325 51 16 186 57 85 26 3 1
65 23 35 27 42 14 22 1 2
60 11 18 39 65 9 15 1 2
632 128 20 319 50 177 28 8 1
166 40 24 87 52 39 23 0 0
163 42 26 66 40 53 33 2 1
97 26 27 49 51 21 22 1 1
90 22 24 46 51 19 21 3 3
97 16 16 50 52 31 32 0 0
108 40 37 59 55 9 8 0 0
68 18 26 33 49 16 24 1 1
114 34 30 60 53 19 17 1 1
92 14 15 39 42 35 38 4 4
95 51 54 34 36 9 9 1 1
87 27 31 34 39 24 28 2 2
130 33 25 62 48 33 25 2 2
125 34 27 67 54 24 19 0 0
2,253 396 18 1,131 50 671 30 55 2
95 13 14 46 48 30 32 6 6
201 28 14 99 49 67 33 7 3
102 23 23 49 48 25 25 5 5
124 25 20 54 44 39 31 6 5
151 17 11 78 52 50 33 6 4
99 11 11 49 49 34 34 5 5
189 36 19 102 54 49 26 2 1
263 48 18 130 49 82 31 3 1
61 7 11 26 43 27 44 1 2
82 6 7 49 60 26 32 1 1
387 74 19 221 57 89 23 3 1
125 26 21 58 46 40 32 1 1
170 33 19 80 47 53 31 4 2
140 32 23 59 42 44 31 5 4
64 17 27 31 48 16 25 0 0
2,045 343 17 1,017 50 637 31 48 2
103 11 11 44 43 44 43 4 4
418 70 17 198 47 140 33 10 2
108 14 13 50 46 40 37 4 4
283 53 19 156 55 72 25 2 1
356 53 15 181 51 116 33 6 2
320 52 16 151 47 108 34 9 3
98 18 18 48 49 27 28 5 5
338 66 20 177 52 87 26 8 2
21 6 29 12 57 3 14 0 0
2,371 410 17 1,126 47 784 33 51 2
424 94 22 190 45 128 30 12 3
115 10 9 52 45 51 44 2 2
109 17 16 53 49 36 33 3 3
102 21 21 54 53 25 25 2 2
119 22 18 53 45 42 35 2 2
158 19 12 76 48 61 39 2 1
82 24 29 35 43 22 27 1 1
392 55 14 203 52 127 32 7 2
92 20 22 42 46 28 30 2 2
74 16 22 24 32 34 46 0 0
117 25 21 44 38 48 41 0 0
240 40 17 122 51 77 32 1 0
107 19 18 48 45 35 33 5 5
240 28 12 130 54 70 29 12 5
Total number inspected Northumberland Good ENGLAND NORTH EAST Outstanding Sunderland Stockton-on-Tees South Tyneside Redcar and Cleveland Durham
Darlington
Blackpool NORTH WEST Blackburn with Darwen
Satisfactory Inadequate
North Tyneside Newcastle upon Tyne Middlesbrough Hartlepool Gateshead Halton Cumbria Cheshire East
Cheshire West and Chester Bury Bolton Tameside Stockport Liverpool Lancashire Wirral Wigan Warrington Trafford Knowsley St. Helens Sefton Salford Rochdale Oldham Manchester
YORKSHIRE AND THE HUMBER Barnsley
North East Lincolnshire East Riding of Yorkshire
Kirklees
Kingston upon Hull City of
Leeds Doncaster Wakefield York Calderdale Bradford North Lincolnshire North Yorkshire Rotherham Sheffield Rutland Nottinghamshire Nottingham EAST MIDLANDS Derby Leicester Derbyshire Lincolnshire Leicestershire Northamptonshire Coventry Birmingham WEST MIDLANDS Walsall Shropshire Sandwell Herefordshire Dudley Wolverhampton Worcestershire Solihull Staffordshire
Telford and Wrekin Stoke-on-Trent
22
Number % Number % Number % Number %
2,546 516 20 1,238 49 729 29 63 2
78 24 31 39 50 13 17 2 3
244 47 19 125 51 68 28 4 2
138 37 27 68 49 31 22 2 1
557 98 18 261 47 179 32 19 3
524 145 28 250 48 121 23 8 2
70 18 26 35 50 16 23 1 1
420 49 12 213 51 148 35 10 2
70 11 16 31 44 25 36 3 4
54 13 24 27 50 11 20 3 6
337 66 20 169 50 93 28 9 3
54 8 15 20 37 24 44 2 4
2,459 688 28 1,168 47 566 23 37 2
58 8 14 27 47 21 36 2 3
118 47 40 61 52 10 8 0 0
77 9 12 37 48 29 38 2 3
86 17 20 39 45 29 34 1 1
95 27 28 41 43 25 26 2 2
60 21 35 30 50 9 15 0 0
1 1 100 0 0 0 0 0 0
117 28 24 51 44 34 29 4 3
88 17 19 46 52 24 27 1 1
89 23 26 40 45 25 28 1 1
86 17 20 43 50 25 29 1 1
71 18 25 26 37 27 38 0 0
54 22 41 22 41 10 19 0 0
85 22 26 30 35 27 32 6 7
63 28 44 28 44 6 10 1 2
83 14 17 48 58 17 20 4 5
93 24 26 45 48 23 25 1 1
71 16 23 37 52 18 25 0 0
64 16 25 40 63 8 13 0 0
37 20 54 13 35 4 11 0 0
50 23 46 19 38 8 16 0 0
86 26 30 44 51 16 19 0 0
88 21 24 46 52 20 23 1 1
55 10 18 29 53 15 27 1 2
92 25 27 43 47 24 26 0 0
75 23 31 36 48 14 19 2 3
48 22 46 21 44 5 10 0 0
100 33 33 41 41 23 23 3 3
64 17 27 41 64 6 9 0 0
96 28 29 48 50 19 20 1 1
75 14 19 39 52 19 25 3 4
79 31 39 37 47 11 14 0 0
55 20 36 20 36 15 27 0 0
3,329 701 21 1,575 47 966 29 87 3
38 7 18 19 50 10 26 2 5
70 24 34 25 36 19 27 2 3
230 66 29 107 47 50 22 7 3
189 32 17 104 55 48 25 5 3
528 126 24 255 48 134 25 13 2
44 6 14 27 61 10 23 1 2
587 97 17 251 43 222 38 17 3
100 5 5 53 53 38 38 4 4
112 24 21 55 49 32 29 1 1
294 45 15 143 49 99 34 7 2
67 11 16 25 37 25 37 6 9
51 12 24 19 37 18 35 2 4
47 15 32 18 38 11 23 3 6
82 16 20 34 41 30 37 2 2
398 109 27 179 45 100 25 10 3
83 10 12 54 65 18 22 1 1
281 63 22 143 51 72 26 3 1
65 17 26 34 52 13 20 1 2
63 16 25 30 48 17 27 0 0
2,318 490 21 1,175 51 612 26 41 2
78 24 31 39 50 15 19 0 0
37 8 22 14 38 13 35 2 5
146 31 21 54 37 54 37 7 5
278 57 21 149 54 69 25 3 1
365 63 17 206 56 91 25 5 1
179 69 39 84 47 25 14 1 1
296 73 25 142 48 74 25 7 2
1 0 0 1 100 0 0 0 0
76 13 17 43 57 20 26 0 0
91 17 19 44 48 28 31 2 2
41 15 37 16 39 8 20 2 5
273 42 15 132 48 96 35 3 1
106 17 16 60 57 26 25 3 3
76 17 22 36 47 23 30 0 0
42 11 26 21 50 9 21 1 2
233 33 14 134 58 61 26 5 2
Source: Ofsted inspections
1. Percentages are rounded and may not add to 100.
2. Local authority information based on Edubase at the end of the reporting month
3. Data includes the most recent judgements for predecessor schools of academy converters that has not been inspected as an academy converter.
Total number inspected
Good
Outstanding Satisfactory Inadequate
Bedford
EAST OF ENGLAND
Thurrock Suffolk Southend-on-Sea Peterborough Norfolk Luton Essex Central Bedfordshire Cambridgeshire Camden Bromley Brent Bexley
Barking and Dagenham
LONDON
Haringey
Hammersmith and Fulham Hackney Greenwich Barnet Hertfordshire Enfield Ealing Croydon City of London
Brighton and Hove Lambeth Merton Lewisham Harrow
Kensington and Chelsea Islington
Hounslow Hillingdon Havering
Kingston upon Thames
Westminster Wandsworth Waltham Forest Tower Hamlets Sutton Southwark
Richmond upon Thames Redbridge Newham Portsmouth SOUTH EAST Oxfordshire Milton Keynes Medway Kent Isle of Wight Hampshire East Sussex Buckinghamshire SOUTH WEST Bracknell Forest Wokingham
Windsor and Maidenhead West Sussex West Berkshire Surrey Southampton Slough Reading Bournemouth
Bath and North East Somerset
Dorset Devon Cornwall Bristol City of
23
Glossary
Section 5 Inspection
1. Under Section 5 of the Education Act 2005, Ofsted is required to inspected all
schools to which Section 5 applies at prescribed intervals Since 1September 2009, Regulations5 require all maintained schools to be inspected within five
school years6 of the end of the school year in which they were last inspected.
2. The schools subject to Section 5 inspection are:
community, foundation and voluntary schools
community and foundation special schools
maintained nursery schools
academies7
city technology colleges
city technology colleges for the technology of the arts
certain non-maintained special schools approved by the Secretary of State
under Section 342 of the Education Act 1996.
3. When conducting an inspection under Section 5 Ofsted is required to report on:
the quality of the education provided in the school
how far the education meets the needs of the range of pupils at the school
the educational standards achieved in the school
the quality of the leadership in and management of the school, including
whether the financial resources made available to the school are managed effectively
the spiritual, moral, social and cultural development of the pupils at the school the contribution made by the school to the well-being8 of those pupils
the contribution made by the school to community cohesion.
5 Education (School Inspection (England) Regulations 2005 as amended 6 A school year begins on 1 August for these purposes.
7 This includes all academy family schools: sponsor-led academies, academy converter schools, academy special schools, free
schools, university technical colleges, and studio schools.
8 The term ‘well-being’ is set out in the Children Act 2004 as relating to: pupils’ physical and mental health and emotional well-being;
24
Categories of concern
The Education Act 2005 defines categories of schools causing concern. The two statutory categories of concern are:
where a school is failing to give its pupils an acceptable standard of education and the persons responsible for leading, managing or governing the school are not demonstrating the capacity to secure the necessary improvement in the school, the school will be made subject to special measures.9
where a school requires significant improvement, Ofsted will make the
school subject to a ‘notice to improve’ because either:
it is failing to provide an acceptable standard of education but is demonstrating the capacity to improve
or:
it is not failing to provide an acceptable standard of education but is performing significantly less well than it might, in all the circumstances, reasonably be expected to perform10.
Interim assessment
From September 2009 Ofsted has varied the frequency of schools’ inspections. We now inspect most schools judged to be good or outstanding11 at their most recent
inspection at approximately five-year intervals unless concerns are identified about a school’s performance. If Ofsted’s risk assessment confirms that a school has
maintained its performance for three years after its most recent inspection, the school may be issued with an interim assessment. This confirms that Ofsted is not intending to inspect a school for one year from the date of the assessment.
A school judged to be Satisfactory at its most recent inspection will be normally be inspected in the third school year after the end of the school year in which it was last inspected. Satisfactory schools may also receive a monitoring inspection.
Common terminology used by inspectors
Achievement: the progress and success of a pupil in their learning
and development taking account of their attainment.
Attainment: the standard of the pupils’ work shown by test and
examination results and in lessons.
9 Section 44(1) of the Education Act 2005 10 Section 44(2) of the Education Act 2005
11 The Education Act 2011 makes provision for amendment of the Education Act 2005. Current proposals are that regulations are to
25
Attendance the regular attendance of pupils at school and in
lessons, taking into account the school’s efforts to encourage good attendance.
Behaviour how well pupils behave in lessons, with emphasis on
their attitude to learning. Pupils’ punctuality to lessons and their conduct around the school.
Capacity to improve: the proven ability of the school to continue improving
based on its self-evaluation and what the school has accomplished so far and on the quality of its systems to maintain improvement.
Leadership and management: the contribution of all the staff with responsibilities,
not just the governors and headteacher, to
identifying priorities, directing and motivating staff and running the school.
Learning: how well pupils acquire knowledge, develop their
understanding, learn and practise skills and are developing their competence as learners.
Overall effectiveness: inspectors form a judgement on a school’s overall
effectiveness based on the findings from their inspection of the school.
Progress: the rate at which pupils are learning in lessons and
over longer periods of time. It is often measured by comparing the pupils’ attainment at the end of a key stage with their attainment when they started.
Safety how safe pupils are in school, including in lessons;
26 © Crown copyright 2012
You may re-use this information (not including logos) free of charge in any format or medium, under the terms of the Open Government Licence. To view this licence, visit
http://www.nationalarchives.gov.uk/doc/open-government-licence/ or write to the Information Policy Team, The National Archives, Kew, London, TW9 4DU or e-mail: