Level 2 National Vocational Qualifications:
the characteristics of those who obtain them,
and their impact on employment
and earnings growth
Eileen Goddard and Charley Greenwood
Office for National Statistics
Level 2 National Vocational Qualifications:
the characteristics of those who obtain them,
and their impact on employment
and earnings growth
Eileen Goddard and Charley Greenwood
Office for National Statistics
The views expressed in this report are the authors’ and do not necessarily reflect those of the Department for Education and Skills.
© Office for National Statistics 2007 ISBN 978 1 84478 877 4
Contents
Summary of key findings
1
Background and sampling
1
1.1 Background 1
1.2 Sampling strategy 1
The Labour Force Survey sample Sample design of the follow-up survey
2
Fieldwork and achieved sample
3
2.1 The interview 3
The questionnaire Fieldwork
2.2 Response 3
Response rates Response bias
3
The path to learning
5
3.1 The Level 2 NVQ 5
3.2 Characteristics of those with a Level 2 NVQ 5
Personal characteristics Employment circumstances
Qualifications obtained before the first Level 2 NVQ
3.3 Circumstances in which the qualification was undertaken 6 Relevance of the NVQ to the job held at the time
Reasons for undertaking a Level 2 NVQ
3.4 Where training was undertaken, and how it was funded 7 Mode of learning
Funding
Tables 3.1-3.19 9
4
The NVQ Level 2 course
20
4.1 Features of the training 20
Course length Intensity of study
4.2 Effect of the training on the respondent’s work 20 Effect of studying on work at time of acquisition
4.3 Effect of the NVQ training on future study 21
Qualifications obtained since the NVQ Current studies and future plans
5
The effect on employment of obtaining a Level 2 NVQ
28
5.1 Changes in employment since obtaining NVQ 28 5.2 Effect of the NVQ on the job held at the time it was acquired 285.3 Perceived benefits of obtaining NVQ 29
Job-seeking since acquisition of NVQ Job status, skills and responsibilities
Pay, promotion and job security
5.4 Employment at time of follow-up survey 30
Requirement of NVQ for current job NVQs among co-workers
5.5 Benefits of the NVQ not related to current job 31 Benefits not specifically relating to work
Tables 5.1-5.19 32
6
Impact of Level 2 NVQ on earnings growth
43
6.1 Introduction 43
6.2 The data 43
6.3 Descriptive analysis by higher qualification level 44
6.4 Regression analysis 45
6.5 The immediate impact of the Level 2 NVQ 46
List of tables
3 The path to learning
Table 3.1 Time since took NVQ, for all, by whether one or more, and if more than one, time since most recent
Table 3.2 Subject area of level 2 NVQ
Table 3.3 Gender by subject area of level 2 NVQ held Table 3.4 Age at acquisition by gender
Table 3.5 Age when Level 2 NVQ was acquired, by subject area
Table 3.6 Whether working at time of acquisition of Level 2 NVQ, by subject area Table 3.7 Whether employee or self-employed at time of acquisition of Level 2 NVQ, by
subject area
Table 3.8 Whether had qualifications before acquisition of Level 2 NVQ, by age at acquisition
Table 3.9 Prior qualifications by subject area of level 2 NVQ held
Table 3.10 Perceived relevance of Level 2 to job held at time of acquisition, by subject area
Table 3.11 Whether employer gave respondent a choice about doing an NVQ, by subject area
Table 3.12 Reason for taking Level 2 NVQ, by employment status at time of acquisition Table 3.13 Reasons for obtaining NVQ by subject area of study
Table 3.14 Mode of study by employment status at time of acquisition Table 3.15 Mode of study by subject area of Level 2 NVQ
Table 3.16 Mode of study by subject area of Level 2 NVQ (working at acquisition) Table 3.17 Types of workplace learning
Table 3.18 Sources of funding, by subject area of NVQ Table 3.19 Sources of funding, by subject area of NVQ
4 The NVQ Level 2 course
Table 4.1 Length of Level 2 NVQ course by employment status at time of acquisition Table 4.2 Length of Level 2 NVQ course by whether it was workplace- or college-based Table 4.3 Length of Level 2 NVQ course by subject
Table 4.4 Days per week studying or training on Level 2 NVQ course by employment status
Table 4.5 Days per week studying or training on Level 2 NVQ course by where course was based
Table 4.6 Days per week studying or training on Level 2 NVQ course by subject area Table 4.7 Reduction of paid hours of work due to Level 2 training by subject area Table 4.8 Whether colleagues were also doing Level 2 NVQ, by subject area Table 4.9 Whether acquired qualifications since Level 2 NVQ by subject area
Table 4.10 Plans for further study by whether qualifications acquired since Level 2 NVQ Table 4.11 Qualifications currently studied by age at follow-up
5 The effect on employment of obtaining a Level 2 NVQ
Table 5.1 Employment now and when acquired NVQ, by sex and age at time of acquisition
Table 5.2 Employment now and when acquired NVQ, by time since acquisition Table 5.3 Employment now and when acquired NVQ, by subject area
Table 5.4 Whether NVq made a difference to how job was done, and to level of responsibility given, by perceived relevance
Table 5.5 Whether NVq made a difference to how job was done, and to level of responsibility given, by age at acquisition
Table 5.7 Whether difference to doing job by NS-SEC category (job at time of acquisition)
Table 5.8 Whether tried to find new or different job since acquisition, by whether working at time of acquisition, and subject area
Table 5.9 Whether Level 2 NVQ has made difference when looking for work, by whether working at acquisition
Table 5.10 Reasons Level 2 NVQ did not help when looking for work
Table 5.11 Reasons for changing job by whether working at time of acquisition Table 5.12 Whether Level 2 NVQ provided skills required to do job by subject area Table 5.13 Whether Level 2 NVQ helped in getting promotion, by subject area Table 5.14 Whether Level 2 NVQ led to better pay and job security, by subject area Table 5.15 Whether Level 2 NVQ would be required for current job by length of time since
acquisition
Table 5.16 Whether Level 2 NVQ would be required for current job by whether in same job
Table 5.17 Whether Level 2 NVQ would be required for current job by subject area Table 5.18 Whether others doing same job have a Level 2 NVQ by reliance on
qualification
Table 5.19 Perceived benefits of Level 2 NVQ not related to current job, by whether had worked since acquisition
6 Impact of Level 2 NVQ on earnings growth
Table 6.1 Summary statistics of the ratio of average hourly pay at wave 5 to average hourly pay at wave 1
Summary of key findings
Introduction
The Department for Education and Skills commissioned the Office for National Statistics (ONS) to carry out a follow-up study of people who had participated in the Labour Force Survey (LFS). The sample for the follow-up survey comprised all those in the wave 1 LFS sample from March 2001 to February 2003 who could be identified from their first or final LFS interview as having a Level 2 NVQ.
Follow-up interviews with 2,216 respondents who met the sample criteria were carried out between December 2004 and February 2005.
The path to learning
Just over three fifths of those with a Level 2 NVQ were women 62%.The average age at acquisition was 32. Overall, 73% of those surveyed were working at the time they obtained their Level 2 NVQ: 22% of these respondents said that their employer had required them to study for the qualification, and 81% thought the NVQ was relevant to the job they had at the time. Employers were reported to have provided funding for 65% of those working when they studied for their NVQ – one half of all those taking a Level 2 NVQ.
The most commonly given reasons for gaining an NVQ were to improve work-related skills (62%), to prepare for further study (28%) and to adapt to new technology (22%).
The NVQ Level 2 course
The length of time people take to complete an NVQ Level 2 qualification varies quite considerably. Just over one in ten, 12%, reported completing their Level 2 NVQ in less than 6 months. A further 22% took between six months and a year, and 44% took between one and two years to achieve the
qualification. Only 4% took three years or more. Nearly everybody (94%) had spent at least one day a week studying or training towards their Level 2 NVQ.
One in four respondents had acquired other qualifications since their Level 2 NVQ, and around one person in six (17%) was studying towards a further qualification at the time of the follow-up survey interview.
The effect on employment of obtaining a Level 2 NVQ
Overall, 40% of respondents were in a different job at the follow-up survey interview from the one they had when they acquired their Level 2 NVQ. One quarter of the sample had stayed in the same job: half of this group said that the NVQ made a difference to the way they did their work, and 29% said that they were given more responsibility
Among those who had tried to find or change jobs since acquisition, 60% thought that the qualification had made a difference when they were looking for work. Among those working at the time of
acquisition, similar proportions gave the three most common reasons given for changing jobs: to obtain better pay (24%), to seek more interesting work (23%), and to improve career prospects (22%).
Impact of NVQ level 2 on earnings growth
1 Background and sampling
1.1 Background
The government’s Skills Strategy is set out in two White Papers:
• 21st Century Skills: Realising Our Potential (2003). and • Skills: Getting on in business, getting on at work (2005).
These recognised that the UK has a persistently poorer skills profile and productivity performance than some key competitor countries - analysis suggests that up to a fifth of the "productivity gap" with competitors is explained by our relatively poor skills, particularly at intermediate levels (ie around Level 2 and Level 3 qualifications);
The Skills Strategy gives a high (though not exclusive) focus for public subsidy to tackle the relatively large proportion of adults with basic literacy and numeracy problems and with low skills (defined as lacking a first, full Level 2 qualification). The Level 2 NVQ is recognised as a platform for employability and progression to higher skill levels.
It is thought that, currently, the benefits to individuals and employers from most Level 2
qualifications are not sufficient to incentivise private investment: this is part of the case for public subsidy, although reforming and improving the qualifications is another important strand of the Skills Strategy.
The Department for Education and Skills commissioned the Office for National Statistics (ONS) to carry out a follow-up study of people who had participated in the Labour Force Survey (LFS) and who had gained a Level 2 qualification in adult life.
The aims of the research were
• to provide information on the perceived benefits of a Level 2 NVQ; • to learn about the experience of Level 2 NVQ acquisition;
• to learn about the background and motivations of people obtaining Level 2 NVQs; • to relate these factors to the impact of the qualification.
1.2 Sampling strategy
The sampling strategy was to identify respondents with relevant characteristics who had been interviewed on the Labour Force Survey (LFS).
The Labour Force Survey sample
The Labour Force Survey (LFS) is a quarterly sample survey of households living at private addresses in Great Britain. Its purpose is to provide information on the UK labour market that can be used to develop, manage, evaluate and report on labour market policies.
Sample design of the follow-up survey
The sample for the survey comprised all those in the wave 1 LFS sample from March 2001 to February 2003 who could be identified from their first or final interview as having a Level 2 NVQ. Their characteristics were as follows:
• 3860 people were recorded as having a Level 2 NVQ and were interviewed at both wave one and wave five of the LFS1.
• 366 people were recorded as having a Level 2 NVQ but were only interviewed either at wave one or at wave five of the LFS.
In total, the follow-up study sample issued consisted of 4226 adults.
2 Fieldwork and achieved sample
2.1 The interview
The questionnaire
The survey questionnaire was drawn up in consultation with the Department for Education and Skills (DfES), and included the following topics:
• the Level 2 NVQ, including number, subject, and when acquired, and mode of learning, along with other information such as who initiated and paid for the training;
• employment status and employment details at the time of acquiring the Level 2 NVQ2; • qualifications obtained since the Level 2 NVQ and also those obtained since the LFS
interview;
• current employment;
• work history after acquisition of the Level 2 NVQ, including details of the first job acquired; • whether the NVQ made a difference, i.e. ways in which it contributed to employment and job
security, changing jobs, status, pay etc;
• current education and training;
• perceptions of current situation, and future intentions, in particular with regards to employment and future learning;
• general views on the Level 2 NVQ qualification.
Fieldwork
Interviewing was carried out by trained ONS interviewers over a ten-week period from December 2004 to mid-February 2005. Advance letters explaining the follow-up survey were sent to the sampled individuals.
Since the LFS sample is unclustered, face-to-face interviews would have been expensive, involving a great deal of travelling between addresses. Most interviewing was therefore done by telephone, and a face-to-face interview attempted only where no telephone number was available. The ten-week field period allowed the cost of the face-to-face interviews to be
minimised by scheduling them as far as possible around other survey work. The interview length averaged 15 minutes.
2.2 Response
Response rates
In recent years the response rate at wave 1 of the LFS has been in the region of 71%-75%, and after five waves,about 55%. The target response rate for the follow-up survey was set at 50%, as it was thought likely that response rates would be relatively low, due to
• the prior participation in the LFS (a series of five interviews);
• the younger than average age of the study group, which would make them harder than average to contact;
• the length of time since last contact (between 1 and 3 years) would also lead to a higher than average number of non-contacts.
The achieved response rate for the follow-up stage turned out to be slightly better than expected, with an overall response rate of 52%, giving 2,216 interviews with respondents who met the sample criteria. The response rate was similar for face to face and telephone interviews. However, it should be noted that the overall response rate, combining both the LFS and the follow-up, was no more than about 30-40%, and this should be borne in mind when interpreting the results.
Response bias
Since this was a follow-up survey, it is possible to compare LFS data for responders and non-responders. Comparison of the achieved sample with the set sample on a number of key background variables showed similar distributions. For example men made up 38% of the set sample, and 39% of the achieved sample. There was a difference in average age: that of people in the set sample was 35 while that of survey responders was 37 years of age, but this is largely due to the passage of time between the two surveys.
3 The path to learning
3.1 The Level 2 NVQ
Almost three fifths (59%) of those interviewed reported that their earliest (or only) reported Level 2 NVQ was obtained more than five years before. Only 2% were obtained within the previous year, but this is mainly because for most respondents, more than one year had elapsed since the Wave 5 LFS interview, and they could not have obtained their first Level 2 NVQ within the last year. For those with more than one Level 2 NVQ, however, 19% of the most recent qualifications were obtained within the 12 months prior to the NVQ survey. (Table 3.1)
Each Level 2 NVQ was coded into one of twelve major subject areas. In this report, data are shown separately for nine categories: the ‘other subject areas’ category includes the 41 cases that were in the remaining three areas3, and 11 cases where although the qualification appeared to be an NVQ, it was not possible to assign a subject code. Table 3.2 shows the number of people with their earliest (or only) Level 2 NVQ in each subject area in the achieved sample.
Throughout this report, except where specified, the Level 2 NVQ referred to is the earliest acquired Level 2 NVQ, if the respondent had more than one.
3.2 Characteristics of those with Level 2 NVQs
Personal characteristics
Just over three fifths of those with a Level 2 NVQ were women (62%), and, not surprisingly, the proportion varied considerably by subject area. For example, 94% of those with a Level 2 NVQ in construction were men, but only 4% of those with a Level 2 in hairdressing and beauty therapy. (Table 3.3)
The respondent’s age at the time of gaining the Level 2 NVQ was estimated using current age together with when the qualification was obtained, and in some cases the ages are estimates, because the respondent could remember the year, but not the month of acquisition. The average age was 32 (30 for men, 33 for women), and the highest was 67. Just over one quarter, 26%, had acquired their Level 2 before they were 20, while 18% acquired the NVQ after age 45. (Table 3.4)
As might be expected, the age at acquisition also varied considerably by subject area. Almost one half (48%) of those obtaining a Level 2 NVQ in hairdressing and beauty therapy were under 20 years of age, but the comparable proportion for those in health, social care and public services was much lower, at 15%. (Table 3.5)
Employment circumstances
Overall, 73% of those surveyed were working at the time they obtained their Level 2 NVQ, but the proportion varied according to the subject area of study, from 38% of those who had studied information and communication technology to 94% of those obtaining a Level 2 in retailing, customer services and transportation. (Table 3.6) Nearly all (96%) people working at the time they obtained their Level 2 were employees. Self-employment was relatively more common among those with NVQs in construction, land-based provision, and hairdressing and beauty therapy. (Table 3.7)
Qualifications obtained before the first Level 2 NVQ
Information about qualifications had already been collected in the LFS interviews. During the follow-up interview, therefore, people were asked only about more recent qualifications.
Combining this information, it was found that 55% had obtained qualifications before studying for their first Level 2 NVQ. The proportion with prior qualifications varied with age of acquisition, being highest, at 60% among those aged under 25 when they obtained their NVQ. (Table 3.8)
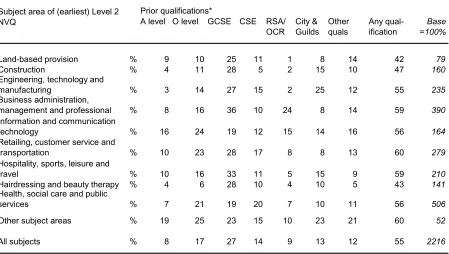
The range of previous qualifications held was wide (Table 3.9). The qualifications most commonly already held by people when obtaining a Level 2 NVQ were GCSEs (27%) and O level or equivalent (17%).
Although the likelihood of having a prior qualification did not vary greatly by subject area of the Level 2, ranging between 42% and 60%, the distribution of the most commonly held prior qualifications did differ. For example, 23% of those with a Level 2 NVQ in retailing, customer service and transportation had O levels compared with only 6% of those in hairdressing and beauty therapy. However, these differences are largely accounted for by the different age profiles of those studying the various subjects: it was shown earlier that those with an NVQ in
hairdressing were on average younger than other respondents, and therefore less likely to have taken O levels, which were replaced by GCSEs in 1988.
One quarter of those with a Level 2 NVQ in engineering had previously obtained a City & Guiilds qualification, and a similar proportion of those with a Level 2 in business administration had obtained an RSA qualification.
3.3 Circumstances in which the qualification was undertaken
Relevance of the NVQ to the job held at the time
Respondents who were working when they obtained their Level 2NVQ were asked whether they thought it was relevant to the job they had at the time, and 81% said that it was. Although assessment of the relevance or compatibility of a qualification to a job is not straightforward, inspection of respondents’ descriptions of the job held at the time of acquisition (no table shown) suggested that among the 20% who said that their Level 2 NVQ was not relevant to their job:
• in just over one half the cases, the Level 2 was in a subject which did appear relevant to the job they held at the time (although some of these were in an IT-related subject which could equally have been compatible with a different job)
• in just under one half the cases, the Level 2 was in a subject which was clearly not related to the job they held at the time: these may in some cases have been taken in support of non-work leisure pursuits, such as sports coaching.
Thus while one in five working respondents did not feel that their Level 2 NVQ was relevant to the job they had at the time, fewer than half of this group appear to have been obtaining a Level 2 to support a change in occupation.
Table 3.10 shows that the perceived relevance of the NVQ was related to the subject area. For most subject areas fewer than one quarter reported their Level 2 as not relevant, but for information technology and hairdressing the proportions were higher, at 34% and 37% respectively. The high figure for hairdressing is accounted for almost exclusively by probable career changers (only two out of 40 of those who thought the hairdressing NVQ irrelevant were actually working in the field).
on a voluntary basis rather than an interest in changing career, and the desire to acquire non-work related skills may of course also be true for other subject areas.
Reasons for undertaking a Level 2 NVQ
Among those working when they acquired their NVQ, 22% said that their employer had required them to study for the qualification: the proportion who said this was particularly high, at 34%, among those who took an NVQ in an engineering subject. (Table 3.11) Among those not currently working, 45% said it was to help them return to work after an absence. (Table 3.12)
Respondents were asked why they had undertaken NVQ training and many gave more than one of a variety of reasons. The most commonly given reasons were to improve work-related skills (62%), to prepare for further study (28%) and to adapt to new technology (22%). (Table 3.13)
Not surprisingly, the wish to adapt to new technology was most likely to be reported as a reason for acquiring a Level 2 NVQ in information technology (cited by 50% of people with this
qualification, compared with 30% or fewer for other subject areas). The proportions giving ‘preparing for higher study’ as a reason were highest, at 39%, for those with an NVQ in health, social care and public services.
The proportion of people who gave improving work-related skills as a reason for their Level 2 NVQ ranged from 70-80%, for most subject areas of qualification, but for those studying information technology and hairdressing, the figures were lower, (35% and 42% respectively), which is consistent with the lower levels of perceived relevance of their NVQ as reported earlier.
3.4 Where training was undertaken, and how it was funded
Mode of learning
NVQs can be studied for in a variety of ways. A third (35%) of Level 2 NVQs were acquired through college based training, a third (34%) through workplace based training, 27% through a combination of the two, and in the remaining small number of cases, through other means, such as self-directed or open learning, or on a government scheme. As would be expected, the proportions varied substantially by employment status. (Table 3.14)
There was also considerable variation in mode of study by subject area. Almost three-quarters, 73%, of those with Level 2 NVQs in Information and communication technology had been exclusively college based and only 6% workplace based, while by contrast, only 8% of those in retailing, customer service and transportation were wholly college based, but 74% were entirely workplace based. Level 2 NVQs in land-based provision, construction, hairdressing, and health and social care were the most likely to have been obtained through a combination of college and workplace learning (around one third for each subject area). (Tables 3.15, 3.16)
Of those reporting some workplace learning, 64% reported that training was given by people from the companies they worked in, and 4% said that the training involved placements with companies they were not employed by. People coming into the workplace from colleges and specialist training companies were involved in workplace training for 29% and 26% of respondents respectively. A number of other trainers were mentioned by small numbers of respondents, including representatives of trade or professional bodies, and employees of umbrella organisations, such as health authorities. (Table 3.17)
Funding
Table 3.1 Length of time since obtaining Level 2 NVQ
All with Level 2 NVQ Time since obtained L2 NVQ Those with one
L2 NVQ only
All respondents
Time since obtained first
Time since obtained most recent
Time since obtained only or first L2 NVQ
% % %
2 1 19 2
6 4 22 6
33 31 38 33
58 64 31 59
Base = 100% 1974 181 185 2155
5 years or more
Those with more than one L2 NVQ
Less than 1 year
1 year but less than 2 years 2 years but less than 5 years
Table 3.2 Subject area of Level 2 NVQ
All with Level 2 NVQ
Men Women Total
% % %
4 3 4
18 1 7
23 3 11
10 22 18
11 6 7
12 13 13
11 8 9
1 10 6
6 33 23
3 2 2
Base = 100% 838 1378 2216
Hairdressing and beauty therapy Health, social care and public services Other subject areas*
* Science and mathematics; visual and performing arts and media; humanities Business administration, management
and professional
Information and communication technology
Retailing, customer service and transportation
Hospitality, sports, leisure and travel Subject area of (earliest) Level 2 NVQ
Land-based provision Construction
[image:18.595.71.388.352.626.2]Table 3.3 Gender by subject area of Level 2 NVQ held
All with Level 2 NVQ Subject area of (earliest) Level 2 NVQ Men Women Base=100%
% 47 53 79
% 94 6 160
% 83 17 235
% 22 78 390
% 54 46 164
% 35 65 279
% 46 54 210
% 4 96 141
% 11 89 506
% 56 44 52
All subjects % 38 62 2216
Construction
Engineering, technology and manufacturing
Information and communication technology Land-based provision
Other subject areas
Hospitality, sports, leisure and travel
Retailing, customer service and transportation Business administration, management and professional
[image:19.595.72.448.102.320.2]Health, social care and public services Hairdressing and beauty therapy
Table 3.4
All with Level 2 NVQ
Age at acquisition Men Women All persons
% % %
under 20 29 26 27
20-24 17 11 13
25-34 19 19 19
35-44 19 24 22
45 or over 16 20 19
Average age 29 31 31
Base=100% 838 1378 2216
Table 3.5 Age when Level 2 NVQ was acquired, by subject area
All with Level 2 NVQ
Subject area of (earliest) Level 2 NVQ Age when Level 2 NVQ was acquired
Under 20 20-24 25-34 35-44 45 or over
% 25 16 13 29 16 79
% 29 23 22 14 13 160
% 32 13 15 23 16 235
% 37 17 17 16 12 390
% 18 8 24 27 23 164
% 22 16 21 19 22 279
% 35 16 13 20 15 210
% 48 12 20 16 4 141
% 15 7 20 30 28 506
% 21 15 25 17 21 52
All subjects % 27 13 19 22 19 2216
Hospitality, sports, leisure and travel Information and communication technology
Retailing, customer service and transportation
Other subject areas
Hairdressing and beauty therapy Health, social care and public services
Base =100%
Business administration, management and professional
Construction
Engineering, technology and manufacturing
[image:20.595.75.523.103.365.2]Land-based provision
Table 3.6
All with Level 2 NVQ
Subject area of (earliest) Level 2 NVQ Working at time of acquisition
Base =100%
% 62 79
% 62 159
% 84 235
% 55 389
% 38 164
% 94 279
% 81 210
% 67 141
% 87 506
% 73 52
All subjects % 73 2214
Health, social care and public services Hospitality, sports, leisure and travel Business administration, management and
Other subject areas
Retailing, customer service and transportation
Hairdressing and beauty therapy Construction
Whether working at time of acquisition of Level 2 NVQ by subject area
Information and communication technology Land-based provision
Table 3.7
All who were working when they acquired their NVQ
Subject area of (earliest) Level 2 NVQ
Employee Self-employed On a govt scheme
% 92 8 0 49
% 90 9 1 98
% 99 1 0 196
% 92 1 7 215
% 98 2 0 62
% 98 0 2 262
% 98 1 1 170
% 88 9 3 94
% 98 1 1 442
% 97 3 0 38
All subjects % 96 2 2 1626
Retailing, customer service and transportation Engineering, technology and manufacturing Construction
Base =100%
Other subject areas
Health, social care and public services
Whether employee or self-employed at time of acquisition of Level 2 NVQ by subject area
Information and communication technology
Hairdressing and beauty therapy
Percentage of those working who were
Hospitality, sports, leisure and travel Business administration, management and professional
Land-based provision
Table 3.8
All with Level 2 NVQ
Age at acquisition Had prior qualifications
Had no prior qualifications
Base =100%
Under 25 % 60 40 838
25-44 % 56 44 922
45 and over % 44 56 393
All ages % 55 45 2153
Table 3.9 Prior qualifications by subject area of level 2 NVQ held
All with Level 2 NVQ
Prior qualifications*
A level O level GCSE CSE RSA/ OCR City & Guilds Other quals Any qual-ification Base =100%
% 9 10 25 11 1 8 14 42 79
% 4 11 28 5 2 15 10 47 160
% 3 14 27 15 2 25 12 55 235
% 8 16 36 10 24 8 14 59 390
% 16 24 19 12 15 14 16 56 164
% 10 23 28 17 8 8 13 60 279
% 10 16 33 11 5 15 9 59 210
% 4 6 28 10 4 10 5 43 141
% 7 21 19 20 7 10 11 56 506
Other subject areas % 19 25 23 15 10 23 21 60 52
All subjects % 8 17 27 14 9 13 12 55 2216
* Note that respondents could have more than one type of qualification Subject area of (earliest) Level 2
NVQ
Health, social care and public services
Hospitality, sports, leisure and travel
Information and communication technology
Land-based provision
Business administration, management and professional Construction
Engineering, technology and manufacturing
Hairdressing and beauty therapy Retailing, customer service and transportation
Table 3.9 Prior qualifications by subject area of level 2 NVQ held
All with Level 2 NVQ
Prior qualifications*
A level O level GCSE CSE RSA/ OCR City & Guilds Other quals Any qual-ification Base =100%
% 9 10 25 11 1 8 14 42 79
% 4 11 28 5 2 15 10 47 160
% 3 14 27 15 2 25 12 55 235
% 8 16 36 10 24 8 14 59 390
% 16 24 19 12 15 14 16 56 164
% 10 23 28 17 8 8 13 60 279
% 10 16 33 11 5 15 9 59 210
% 4 6 28 10 4 10 5 43 141
% 7 21 19 20 7 10 11 56 506
Other subject areas % 19 25 23 15 10 23 21 60 52
All subjects % 8 17 27 14 9 13 12 55 2216
* Note that respondents could have more than one type of qualification Subject area of (earliest) Level 2
NVQ
Health, social care and public services
Hospitality, sports, leisure and travel
Information and communication technology
Land-based provision
Business administration, management and professional Construction
Engineering, technology and manufacturing
Table 3.11
Base = 100%
Yes No
Land-based provision % 86 14 49
Construction % 60 40 98
% 66 34 196
% 87 13 215
% 85 15 62
% 83 17 262
% 85 15 169
% 82 18 94
% 76 24 441
Other subject areas % 76 24 38
All subjects % 78 22 1624
Hospitality, sports, leisure and travel
Hairdressing and beauty therapy Health, social care and public services
Information and communication technology
Retailing, customer service and transportation
Whether employer gave respondent a choice about doing an NVQ, by subject area
All who were working when they acquired their NVQ
Engineering, technology and manufacturing
Business administration, management and professional
Whether employer gave respondent a choice Subject area of (earliest) Level 2
NVQ
Table 3.12
All with Level 2 NVQ
Reported reasons for taking Level 2 NVQ Working Not working All persons
% % %
To improve work-related skills 74 30 62
To prepare for further study 29 23 28
To adapt to new technology 20 30 22
To prepare to return to work after an absence 4 45 14
To obtain a promotion 14 1 11
Other reasons 18 21 19
Base=100% 1627 586 2214
* Percentages add to more than 100 as respondents could give more than one reason.
Table 3.13
To improve work skills
To prepare for further study
To adapt to new technology
To prepare to return to work
To obtain promotion
Base = 100%
Land-based provision % 53 20 15 16 6 79
Construction % 69 26 26 18 12 160
% 67 26 20 7 9 235
% 51 27 30 29 8 390
% 35 25 49 31 5 164
% 81 19 10 6 14 279
% 63 27 16 6 14 210
% 42 24 26 18 9 141
% 73 37 17 8 13 506
Other subject areas % 58 25 17 6 12 52
All subjects % 62 27 22 14 11 2216
* Percentages add to more than 100 as respondents could give more than one reason. Hospitality, sports, leisure and
travel
Hairdressing and beauty therapy Health, social care and public services
Information and communication technology
Retailing, customer service and transportation
Reasons for obtaining NVQ by subject area of study*
All with Level 2 NVQ
Engineering, technology and manufacturing
Business administration, management and professional
Reason for obtaining NVQ Subject area of (earliest) Level 2
Table 3.14
All with Level 2 NVQ
Mode of study Solely college based
Solely workplace based
Combined college and workplace
Other / don’t know
Base =100%
Under 25
Working % 24 30 44 1 610
Not working % 79 2 12 7 224
All % 39 23 36 3 834
25 and over
Working % 19 54 25 2 970
Not working % 73 2 11 14 345
All % 33 40 21 5 1315
All persons*
Working % 21 45 32 2 1625
Not working % 75 2 11 12 586
All % 35 34 27 5 2211
* includes those for whom age at acquisition could not be estimated
Age and employment status at time of acquisition
Table 3.15 Mode of study by subject area of Level 2 NVQ
All with Level 2 NVQ
Solely college based Solely workplace based Combined college and workplace Other/ don’t know Base =100%
% 46 16 34 4 79
Construction % 46 15 32 7 159
% 24 47 25 4 234
% 51 16 26 6 389
% 73 6 12 9 164
% 8 74 16 3 279
% 35 35 23 7 209
% 64 3 32 1 141
% 18 43 36 2 506
Other subject areas % 37 40 17 6 52
All subjects % 35 34 27 5 2212
Subject area of (earliest) Level 2 NVQ
Business administration, management and professional
Engineering, technology and manufacturing
Health, social care and public services Hairdressing and beauty therapy Hospitality, sports, leisure and travel Information and communication technology
Land-based provision
Retailing, customer service and transportation
Table 3.16 Mode of study by subject area of Level 2 NVQ
All who were working when they acquired their NVQ
Solely college based Solely workplace based Combined college and workplace Other / don’t know Base
% 35 22 43 0 49
Construction % 24 23 50 2 98
% 14 56 29 2 196
% 33 28 36 3 215
% 60 15 26 0 62
% 5 78 16 1 262
% 27 43 25 6 169
% 51 4 43 2 94
% 12 49 38 1 442
Other subject areas % 18 55 24 3 38
All subjects % 21 45 32 2 1625
Subject area of (earliest) Level 2 NVQ
Business administration, management and professional
Engineering, technology and manufacturing
Land-based provision
Health, social care and public services Hairdressing and beauty therapy Hospitality, sports, leisure and travel Information and communication technology
[image:26.595.71.523.452.730.2]Table 3.17 Types of workplace learning*
All whose NVQ was wholely or partly work-based
%
Instruction by others from the respondent's company 64 College trainers coming in to the respondent'scompany 29
Work placement with another company 4
Instruction from a training company 26
Base=100% 1285
Types of workplace learning
* Percentages add to more than 100 as some respondents received more than one type of workplace learning
Table 3.18 Sources of funding, by whether working at time of acquisition
All with Level 2 NVQ
Employer Government or LA
Respondent Other Base= 100%
% 33 37 23 8 79
Construction % 38 44 8 9 160
% 70 24 5 1 235
% 30 50 8 12 390
% 12 59 17 12 164
% 76 18 1 6 279
% 44 27 17 12 210
% 16 43 30 11 141
% 66 21 8 5 506
Other subject areas % 52 31 6 12 52
All subjects % 49 33 10 8 2216
Health, social care and public services Hairdressing and beauty therapy Hospitality, sports, leisure and travel Information and communication technology
Retailing, customer service and transportation
Subject area of (earliest) Level 2 NVQ
Business administration, management and professional
Engineering, technology and manufacturing
[image:27.595.74.524.347.603.2]Table 3.19 Whether was funded by employer at time of acquisition
All who were working when they acquired their NVQ
Whether funded by employer
Yes No
% 51 49 49
Construction % 62 38 98
% 81 19 197
% 53 47 215
% 29 71 62
% 81 19 262
% 54 46 170
% 22 78 94
% 76 24 442
Other subject areas % 68 32 38
All subjects % 65 35 1627
Subject area of (earliest) Level 2 NVQ
Business administration, management and professional
Engineering, technology and manufacturing
Land-based provision
Base =100%
Health, social care and public services Hairdressing and beauty therapy Hospitality, sports, leisure and travel Information and communication technology
4 The NVQ Level 2 course
4.1 Features of the training
Course length
The length of time people take to complete an NVQ Level 2 qualification varies quite
considerably. Just over one in ten, 12%, reported completing their Level 2 NVQ in less than 6 months. A further 22% took between six months and a year, and 44% took between one and two years to study for the qualification. Only 4% took three years or more. (Table 4.1)
There was little difference in the average length of the course for those working or not working, but courses that were based in a combination of the workplace and a college were less likely to be short than were those that were solely college-based or workplace-based. (Table 4.2)
There was rather more difference in relation to the subject area studied: for example, one quarter of course in information technology had lasted for less than six months, compared with fewer than 5% of those in land-based provision or hairdressing. (Table 4.3)
Intensity of study
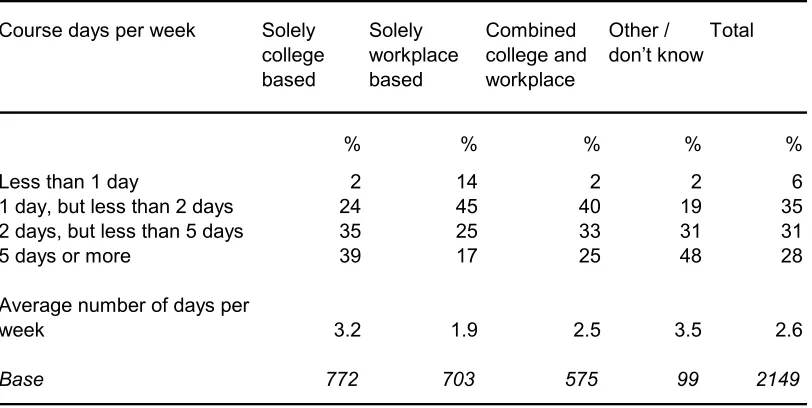
Nearly everybody (94%) had spent at least one day a week studying or training towards their Level 2 NVQ. Around a third, 35%, spent a day or day and a half, slightly fewer, 31%, spent 2-4 days, and 28% said they spent 5 or more days a week training or studying. (Table 4.4)
Not surprisingly, perhaps, those not working at the time of acquisition studied or trained for almost twice as many days per week as those who were working (on average 3.9 compared with 2.2 days). More than half of those without a job studied for 5 or more days a week, compared with only 18% of those who were in employment. (Table 4.5)
Table 4.6 shows that studying was more concentrated for courses that were college-based than for those for which training took place only in the workplace: 39% of college-based courses had been full-time (five days a week or more) over the period of the course, compared with only 17% for those that were solely workplace-based. There was also considerable variation according to the subject area studied: 42% of IT courses were full-time, compared with only 19% of courses in retailing.
There was no association between the intensity of study and the length of the course (no table shown).
4.2 Effect of the training on the respondent’s work
Effect of studying on work
For those in paid employment while studying for their NVQ, hours worked and pay can be affected. Among those in work at the time of acquisition, 14% reported working fewer hours for their employer as a result of their studies, but only half of these (7% of those in work) said that this led to them earning less than they otherwise would have. The likelihood of hours and pay being affected varies according to the subject of the NVQ: 23% of those obtaining a Level 2 NVQ in hairdressing said they had lower pay as a result of time spent training, compared with 5% or fewer of those with a Level 2 in health, and social care, business administration, engineering, or retailing. (Table 4.7)
variation in the number of employees at the workplace may account for some of the differences. (Table 4.8)
4.3 Effect of the NVQ training on future study
Qualifications obtained since the NVQ
One in four respondents had acquired other qualifications since their Level 2 NVQ, ranging from 13% of those with an NVQ in retailing to 32% of those with an NVQ in construction or in health and social care. The further qualifications gained ranged from Basic Skills qualifications to degrees and diplomas, but the most common qualification was another Level 2 NVQ, obtained by 8% of respondents. (Table 4.9)
Current studies and future plans
Around one person in six (17%) was studying towards a qualification at the time of interview, and a further 29% said that although they were not currently studying they had definite plans to do so. One third of respondents had no plans for further study. (Table 4.10)
Table 4.1
All with Level 2 NVQ
Course days per week Employment status at time of acquisition Working Not working All
% % %
Less than 6 months 11 13 12
6 months, but less than 1 year 22 21 22 1 year, but less than 2 years 44 45 44 2 years, but less than 3 years 19 16 18
3 years or more 4 5 4
Base 1430 526 1956
Length of Level 2 NVQ course by employment status
Table 4.2
All with Level 2 NVQ
Length of Level 2 NVQ course Solely
college based
Solely workplace based
Combined college and workplace
Other / don’t know
All courses
% % % % %
Less than 6 months 11 15 7 18 12
6 months, but less than 1 year 17 28 19 28 22
1 year, but less than 2 years 45 44 44 39 44
2 years, but less than 3 years 23 10 25 6 18
3 years or more 4 3 5 9 4
Base 707 640 517 90 1954
Table 4.3
All with Level 2 NVQ
Less than 6 months
6 months, but less than 1 year
1 year, but less than 2 years
2 years, but less than 3 years
3 years or more
Base =100%
% 3 13 57 13 14 70
% 11 14 28 38 9 146
% 16 23 38 15 7 214
% 8 24 54 14 1 348
% 25 29 37 6 4 141
% 21 29 39 10 1 235
% 9 18 43 25 4 182
% 2 6 33 53 7 131
% 10 23 50 13 4 445
Other subject areas % 11 16 50 20 2 44
All subject areas % 12 22 44 18 4 1956
Length of Level 2 NVQ 2 course by subject area
Information and communication technology
Retailing, customer service and Hospitality, sports, leisure and travel
Land-based provision Construction
Engineering, technology and Business administration, management and professional
Health, social care and public services
Subject area of (earliest) Level 2 NVQ
[image:32.595.71.524.103.360.2]Hairdressing and beauty therapy
Table 4.4
All with Level 2 NVQ
Course days per week Employment status at time of acquisition Working Not working All
% % %
Less than 1 day 8 1 6
1 day, but less than 2 days 44 11 35
2 days, but less than 5 days 30 32 31
5 days or more 18 56 28
2.2 3.9 2.6
Base 1567 581 2148
Days per week studying or training on Level 2 NVQ course by employment status
Table 4.5
All with Level 2 NVQ
Course days per week Solely college based Solely workplace based Combined college and workplace Other / don’t know Total % % % % %
Less than 1 day 2 14 2 2 6
1 day, but less than 2 days 24 45 40 19 35
2 days, but less than 5 days 35 25 33 31 31
5 days or more 39 17 25 48 28
3.2 1.9 2.5 3.5 2.6
Base 772 703 575 99 2149
Average number of days per week
Days per week studying or training on Level 2 NVQ course by whether course was workplace- or college-based
Table 4.6
All with Level 2 NVQ
Less than 1 day
1 day, but less than 2 days
2 days, but less than 5 days
5 days or more
Base =100%
% 4 34 35 27 79
% 1 29 30 39 153
% 7 40 26 27 225
% 5 31 28 36 387
% 1 28 29 42 161
% 10 47 24 19 267
% 8 33 32 27 206
% 1 27 40 32 141
% 8 36 35 21 483
Other subject areas % 6 45 32 17 47
All subject areas % 6 35 31 28 2149
Business administration, management and professional
Health, social care and public services
Subject area of (earliest) Level 2 NVQ
Hairdressing and beauty therapy
Days per week on NVQ 2 course (derived) by subject area
Information and communication technology
Retailing, customer service and Hospitality, sports, leisure and travel
Land-based provision Construction
[image:33.595.79.523.395.667.2]Table 4.7 Reduction of paid hours of work due to Level 2 training by subject area
Those who worked while acquiring NVQ Fewer hours of
paid work, and lower pay
Fewer hours of paid work, but same pay
No fewer hours of paid work
Base =100%
% 16 10 73 49
% 15 6 79 96
% 4 12 84 195
% 4 9 87 215
% 11 6 82 62
% 2 6 92 260
% 12 5 83 169
% 23 7 69 94
% 5 5 90 442
Other subject areas % 5 8 87 38
All subjects % 7 7 86 1620
Business administration, management and professional
Health, social care and public services
Information and communication technology
Retailing, customer service and transportation
Hospitality, sports, leisure and travel
Hairdressing and beauty therapy Subject area of (earliest) Level 2 NVQ
Land-based provision Construction
Table 4.8
Those who worked while acquiring NVQ
Someone else at work did same NVQ2 at same time
Base =100%
% 51 49
% 53 98
% 71 196
% 35 215
% 29 62
% 76 262
% 49 169
% 26 94
% 78 442
Other subject areas % 58 38
All subjects % 60 1625
Business administration, management and professional
Health, social care and public services
Subject area of (earliest) Level 2 NVQ
Hairdressing and beauty therapy
Whether colleagues were also doing NVQ2 at the same time
Information and communication technology
Retailing, customer service and transportation
Hospitality, sports, leisure and travel
Land-based provision Construction
Table 4.9
All those with a Level 2 NVQ
Further qualifications since Level 2 NVQ Any further
qualification
Further Level 2 NVQ
qualification
Base =100%
25 8 79
32 8 160
25 9 235
26 10 390
15 10 164
13 6 279
28 11 210
23 18 141
32 4 506
Other subject areas 37 8 52
All subjects 25 8 2216
Health, social care and public services Information and communication technology
Retailing, customer service and transportation
Hospitality, sports, leisure and travel Hairdressing and beauty therapy Engineering, technology and manufacturing
Business administration, management and professional
Whether acquired qualifications since Level 2 NVQ, by subject area
Land-based provision Construction
Percentages Subject area of (earliest)
Level 2 NVQ
Table 4.10
All those with a Level 2 NVQ
With other qualifications since NVQ2 No other qualifications since NVQ2 Total % % %
Currently studying 28 13 17
Has current plans 31 28 29
18 19 19
22 36 33
1 3 3
Base 513 1683 2196
Has no current plans, dk likelihood of further study
Has no current plans, but might want to study in the next 3 years
Has no current plans, and is unlikely to want to study in the next 3 years
Plans for further study by whether qualifications acquired since Level 2 NVQ
[image:36.595.73.435.547.758.2]5
The effect on employment of obtaining a Level 2 NVQ
5.1 Changes in employment since obtaining NVQ
Overall, 40% of respondents were in a different job at the follow-up survey interview from the one they had when they acquired their Level 2 NVQ. A rather smaller proportion, 24%, had stayed in the same job. The proportions in each category were similar for men and for women, except that women were more likely to have stopped working since obtaining the NVQ. This difference was particularly marked among younger women, and is probably accounted for by pregnancy or child-rearing. In fact, young women were generally less likely than young men to have been working both when they obtained the NVQ and at the follow-up interview. (Table 5.1)
Not surprisingly, perhaps, older respondents were less likely to have changed job – 27% of those aged 45 and over when they obtained their NVQ had done so, compared with about half of those aged under 25. One in twelve respondents (8%) were working neither when they obtained their NVQ nor at the follow-up interview. This proportion was significantly higher among those aged 25-34 than among other age groups. The more recent the qualification, the less likely
respondents were to have changed job since it was obtained. (Table 5.2)
There was also considerable variation in change in employment according to the subject studied for the NVQ. Those with an NVQ in health and social care were the most likely to be still in the same job (37% compared with only13% of those who had an NVQ in business administration or information technology). More than one half of those with an NVQ in retailing or hospitality, sports and leisure had changed jobs, compared with only 22% of those with an NVQ in
information technology. As many as 42% of those with an NVQ in information technology had not been working when they acquired their NVQ, but had found a job since. (Table 5.3)
5.2 Effect of the NVQ on the job held at the time it was acquired
It might be expected that vocational qualifications could make a difference to the way people carry out their work, although the Level 2 NVQ is sometimes taken to confirm and validate pre-existing skills.
Of those respondents who were in paid employment when they obtained their Level 2 NVQ, 89% (no table shown) continued to have the same job immediately afterwards, and they were asked if the NVQ had made any difference to the way they did their job, and to the amount of
responsibility they were given. Half of those who stayed in the same job said that the NVQ made a difference to the way they did their work, and 29% said that they were given more
responsibility. (Table 5.4)
Table 5.4 also shows, unsurprisingly, perhaps, that the more relevant the Level 2 NVQ to the job held at the time of acquisition, the more likely it was to have made a difference to the way they did their job: 70% of those who thought the qualification was very relevant, compared with only 5% of those who said it was not at all relevant, thought that the NVQ had made a difference to how they did their job. Similarly, those who thought the NVQ was relevant to their job were also much more likely to say they were given more responsibility after they obtained it.
There was little difference between age groups in the proportions saying the NVQ had affected they way they did their work, but those under age 25 were more likely than older respondents to say they had been given more responsibility (35% compared with 25% of those aged 25 and over). (Table 5.5)
Although the differences are not marked, there was some variation by subject area of the Level 2 NVQ in the proportions saying they did their job differently, ranging from 42% for retailing and engineering to 58% for health and social care. Again, there was more variation by NVQ subject in the likelihood of a change in the amount of responsibility given: 47% of those whose
It might be expected that those initially with the least skilled jobs would be most likely to report that the qualification had made a difference to the way they did their work. The National Statistics Socio-Economic Classification (NS-SEC) categorises occupations according to the skill and expertise associated with them, (and by extension to the accompanying managerial responsibility or status). There was little difference by NS-SEC category in the proportion reporting that the qualification made a difference to the way they did their job. (Table 5.7)
However, Table 5.6 also shows that the acquisition of the Level 2 NVQ was more likely to be accompanied by increased responsibility among some occupation groups than others. The proportion reporting increased responsibility was lower among those in professional and managerial occupations than among other groups. The group most likely to say they had more responsibility were those in lower technical craft occupations, 41% of whom said this was the case.
Those whose employer had required them to take the NVQ were no more likely than other respondents to say they were given more responsibility after they obtained it. (no table shown).
5.3 Perceived benefits of obtaining a Level 2 NVQ
Job-seeking since acquisition of NVQ
One potential reason for acquisition of a Level 2 NVQ is to help in the search for work – either to obtain work when unemployed, or to use the qualification to assist in changing jobs.
Respondents were asked if they had tried to find or change jobs since obtaining their Level 2 NVQ, and 62% had done so. As would be expected, the proportion was higher among those who were not working at the time of acquisition than among those who already had a job – 79%
compared with 56%. (Table 5.8)
Among those who had tried to find or change jobs since acquisition, 60% thought that the qualification had made a difference when they were looking for work. Those who said they had not found the qualification to be helpful in finding or changing job since acquisition were asked why. A wide variety of reasons were given, mostly reflecting a perceived lack of relevance of the qualification. The most common reason, given by 30%, was that the NVQ had been in an inappropriate subject, 13% said that employers did not view the qualification as useful, 12% said that the job they were seeking had not required the qualification, and 11% that the content of the course was not useful for the work they did. (Tables 5.9, 5.10)
Among those working at the time of acquisition, similar proportions gave the three most common reasons given for changing jobs: to obtain better pay (24%), to seek more interesting work (23%), and to improve career prospects (22%). The other main reasons mentioned were redundancy (17%), the desire to obtain better working conditions (14%), being offered better work (13%), and family or personal reasons (13%). Those not working when they obtained their NVQ gave similar reasons for looking for work, but, not surprisingly, perhaps, pay figured more often as a reason for doing so. (Table 5.11)
Job status, skills and responsibilities
One important aspect of a vocational qualification is the relevance of the skills it brings to the learner. About two thirds of respondents with Level 2 NVQs felt that the qualification had given them skills needed to carry out their work. There were no subject areas where the likelihood of reporting that the Level 2 NVQ provided skills required to do the job differed markedly from the average, although Level 2s in construction were perceived as the most likely, and those in hospitality, sports and leisure, and in engineering, perceived as the least likely, to provide skills required for work.
If learned skills are perceived as not relevant to the job held, this may not necessarily imply a problem with the qualification, but could mean that the respondent either was not being given chances at work to use their skills or that they had simply not yet found a job in the career for which they had trained. For some occupations, an enhanced understanding of an individual’s role and duties may be as important an outcome for a qualification as the acquisition of specific skills: 63% said that having the NVQ had increased their confidence at work, and 54% said that their qualification had given them a clearer understanding of their role at work. (Table 5.12)
Pay, promotion and job security
Whether the NVQ assists in career development, and in particular with gaining promotion, is a further area the study considered. Just over one third (35%) of respondents with Level 2 NVQs who had been employed at some point since obtaining the NVQ said that they had tried to obtain promotion at work since acquiring their qualification. About two thirds of this group (21% of all those who had worked since acquiring their NVQ) thought that the NVQ had been helpful in their attempt to get promotion.(Table 5.13)
One potential benefit which might accompany acquisition of a qualification is an increase in earnings. On the assumption that any respondent might receive pay increases, regardless of whether they took active steps to obtain one, all respondents were asked directly whether their Level 2 NVQ had been helpful in getting better pay. Just over one third (36%) reported that it had been helpful in this way. Different kinds of Level 2 NVQ have a different likelihood of being perceived as helping lead to better pay. Those with an NVQ in construction were much more likely than respondents with all other subjects to feel that the Level 2 was helpful in getting better pay. The association between earnings and the Level 2 NVQ is discussed further in Chapter 6.
Another potential benefit of a qualification is to increase job security. In the follow-up study, 35% of respondents who had been in work at some point since acquiring their Level 2 NVQsaid that their qualificationhad given them greater job security. (Table 5.14)
5.4 Employment at time of follow-up survey
Requirement of NVQ for current job
One measure of the relevance of a qualification is whether it is required for carrying out a particular job. Just over one third (36%) of those currently working thought that they would need a Level 2 NVQ if they were to apply now for their current job. The proportion was higher, at 42-43%, for those who had completed their NVQ less than 5 years previously, compared with 32% among those whose NVQ had been obtained five years ago or earlier. (Table 5.15)
Among those who were also working when they obtained their NVQ, those who had changed jobs since they acquired their Level 2 were less likely to think their NVQ would be required for their current job than were those still in the same job. (29% compared with 48%). (Table 5.16)
There was considerable variation by subject area of NVQ in the proportions thinking that the Level 2 NVQ would be required if they applied for their current job today, ranging from 53% for those whose qualification was in health and social care, to only 14% for those with an NVQ in retailing. Although 36% said that their NVQ would be required if they were to apply for their job now, 74% thought they could successfully carry out their job without having done the
NVQs among co-workers
Four fifths of respondents said that there were other people working in the organisation doing the same job, and 69% of this group (55% of all those with a Level 2) said that some of those who were doing the same work did not have a Level 2 NVQ. Even among those who had said that they couldn’t do their job without the NVQ, about half (52%) said that there were other people at work doing the same job without the Level 2 qualification. (Table 5.18)
5.5 Benefits not related to the current job
All respondents were asked about potential benefits of the Level 2 NVQ that were not directly related to a current job. More than half of those interviewed thought it had given them skills that were useful outside work, that it had given them confidence when seeking work, and encouraged them towards further study. Almost as many, 49% said that it had given them ideas about different types of work they could do. Rather fewer, 33% said that the NVQ had given them confidence outside the working environment: the proportion saying this was much higher among those who had not worked since getting the NVQ than among those who had (52% compared with 32%). (Table 5.19)
The reported examples of skills being useful outside of work were:
• Doing odd jobs around the home, in the garden, on the car for family or friends (23%) • Improved computer skills, along with typing, operating fax etc. (14%)
• Better writing and communication skills (13%)
• Better interpersonal skills, and ability to think about others (13%) • The ability to share knowledge, advice and training with others (11%) • Specific knowledge relating to first aid or health and safety issues (9%) • Generally improving confidence, assertiveness and self image (13%) • Better ability to cook and prepare food at home (6%)
• Increased ability and insight with regard to caring for children (6%)
• Skills required to carry out private work and apply for work / transferable skills (10%) • Skills and insights relating to caring for the elderly (4%)
• General organisational skills (4%) • Budgeting / financial skills (3%)
• Provided skills / opportunities to help with voluntary work / charities / clubs (2%) • Skills and insights in caring for those with disabilities (2%)
Table 5.1 Employment now and when acquired NVQ, by sex and age at time of acquisition
All those with an NVQ
In same job as when acquired NVQ
In different job from when acquired NVQ Working now, not when acquired NVQ Working when acquired NVQ, but not now
Not working now or when acquired NVQ
Base =100%
Men
Under 20 % 23 45 22 5 5 232
20-24 % 21 54 15 6 4 136
25-34 % 21 34 27 5 12 154
35-44 % 30 37 22 4 7 153
45 and over % 30 26 19 10 16 125
Total % 25 40 21 6 8 800
Women
Under 20 % 16 40 20 15 8 336
20-24 % 9 50 21 14 6 141
25-34 % 19 40 16 12 13 232
35-44 % 28 39 18 9 6 308
45 and over % 42 27 10 14 7 260
Total % 24 38 17 13 8 1277
All persons
Under 20 % 15 47 21 11 6 533
20-24 % 14 52 19 10 6 254
25-34 % 22 37 19 9 13 402
35-44 % 32 37 19 7 6 463
45 and over % 38 27 13 13 10 368
Total % 24 40 18 10 8 2020
Age when NVQ was acquired
Table 5.2
All those with an NVQ
Time since acquired NVQ Level 2
<2 years 2-4 years 5+ years All
% % % %
53 35 14 24
25 39 42 40
7 12 23 18
8 8 11 10
8 6 10 8
Base = 100% 158 674 1189 2021
Not working now or when acquired NVQ
Employment now and when acquired NVQ by time since acquired earliest NVQ
In same job as when acquired NVQ In different job from when acquired NVQ Working now, not when acquired NVQ
[image:41.595.72.403.519.744.2]Table 5.3
All those with an NVQ
In same job as when acquired NVQ
In different job from when acquired NVQ Working now, not when acquired NVQ Working when acquired NVQ, but not now
Not working now or when acquired NVQ
Base =100%
% 21 28 24 11 16 75
% 30 27 26 5 12 150
% 28 47 13 8 4 224
% 13 34 34 7 11 366
% 13 22 42 4 19 159
% 25 55 3 15 2 264
% 21 54 14 7 5 198
% 18 35 17 15 15 131
% 37 37 8 14 4 462
Other subject areas % 25 40 19 6 10 48
All subjects % 24 39 18 10 8 2077
Employment now and when acquired NVQ, by subject area
Subject area of (earliest) Level 2 NVQ
Retailing, customer service and transportation
Hospitality, sports, leisure and travel
Hairdressing and beauty therapy Health, social care and public services
Land-based provision
Engineering, technology and manufacturing
Business administration, management and professional Information and communication technology
[image:42.595.73.525.98.348.2]Construction
Table 5.4
Those who stayed in the same job after obtaining the NVQ
Perceived relevance of NVQ
how the job was done
responsibility given
Base = 100%
Very relevant 70 44 632
Fairly relevant 46 23 536
Not very relevant 14 6 135
Not at all relevant 5 2 133
All 50 29 1436
.
Percentage reporting that Level 2 NVQ made a difference to:
Table 5.5
Those who stayed in the same job after obtaining the NVQ
under 20 53 36 321
20-24 51 33 171
25-34 47 25 270
35-44 49 27 346
45-54 52 23 247
55 and over 58 23 40
Total 51 29 1395
Age at which acquired first Level 2 NVQ
52 3