Harnessing Technology Local Authorities Survey 2008
Contents
Introduction ... 7
Background ... 7
Survey objectives ... 7
Survey procedures ... 8
Interpretation of tables ... 9
Report structure ... 10
1 Overview of results ... 11
1.1 General overview ... 11
1.2 Strategies on ICT use ... 11
1.3 Every Child Matters agenda ... 12
1.4 Support for headteachers and schools ... 12
1.5 Technical support for schools ... 12
1.6 Learning platforms ... 12
1.7 Views on Becta ... 13
2 Leadership and policy ... 14
2.1 Vision and strategy ... 14
2.1.1 Formulation of strategy ... 14
2.1.2 Review of strategy ... 17
2.1.3 Aspects of strategy ... 18
2.1.4 Strategy for safeguarding children online ... 19
2.1.5 Strategic Leadership of ICT programme ... 20
2.1.6 School improvement partners ... 20
2.2 Policy priorities ... 21
2.2.1 Prioritised elements of strategy ... 21
2.2.2 Areas prioritised for ICT support ... 22
2.2.3 National policy initiatives ... 26
2.3 Every Child Matters agenda ... 27
2.4 Summary... 30
3 Resources and organisation ... 32
3.1 Organisation ... 32
3.1.1 Responsibility for technical support/advice ... 32
3.1.2 Management information systems ... 33
3.1.3 Managed services provision... 33
3.1.4 Learning platforms ... 34
3.1.5 Curriculum advisers and ICT strategy managers ... 35
3.2 Procurement ... 36
3.3 Funding streams ... 40
3.3.1 Importance of funding streams ... 40
3.3.2 Capacity to support schools ... 41
3.4 Summary... 43
4 Support and development ... 44
4.1 Monitoring ... 44
4.1.2 Monitoring ICT standards in schools ... 45
4.1.3 Monitoring broadband bandwidth in schools ... 45
4.2 Support and continuing professional development ... 46
4.2.1 Provision of training and continuing professional development... 46
4.2.2 Prioritisation of skills in the professional development of headteachers .. 47
4.2.3 Assessment of headteachers’ CPD needs ... 48
4.2.4 Advice and services provided to schools ... 49
4.3 E-safety and e-security ... 53
4.4 Communication ... 55
4.5 Summary... 58
5 Becta and the self-review framework ... 60
5.1 Becta ... 60
5.1.1 Services provided by Becta... 60
5.1.2 Past experience with Becta ... 62
5.1.3 Communicating with Becta... 62
5.2 The self-review framework ... 63
5.3 Suggestions for improvements in ICT use in schools ... 64
5.4 Summary... 66
Appendix A ... 67
Additional analysis ... 67
Appendix B ... 77
Glossary ... 77
List of tables and figures
Table 2.1: Whether a written strategy was in place for the use of ICT in schools 14 Table 2.3: Whether schools were actively involved in formulating strategy ... 17 Table 2.2: National priorities incorporated within strategy ... 16
Table 2.4: Whether strategy was reviewed on a systematic basis ... 18 Table 2.5: Rating of importance of monitoring/evaluating aspects of strategy
during review process ... 19 Table 2.6: Whether local authority has a written vision/strategy for the
safeguarding of children online... 20 Table 2.7: Whether headteachers are encouraged to participate in the Strategic
Leadership of ICT programme... 20 Table 2.8: Extent to which school improvement partners have been valuable in
supporting the use of ICT in schools ... 21 Table 2.9: Elements given priority in strategy ... 22 Table 2.10: Single most important factor in prioritising ICT support in local
authority ... 23 Table 2.12: Main reason for selecting curriculum area as a priority ... 26 Table 2.11: Curriculum areas with highest priority for ICT support ... 25
Figure 2.1: National policy initiatives being evaluated by the local authority ... 27 Figure 2.2: Aspects of the Every Child Matters agenda to which ICT made the
greatest contribution ... 28 Table 2.13: Impact of Every Child Matters agenda on local authority’s capacity to
provide ICT support to schools ... 29 Table 2.14: Whether local authority has a fully operational ContactPoint database
for the collection of Every Child Matters indicator data from schools . 29 Table 3.1: Responsibility for co-ordinating/monitoring the provision of technical
support services ... 32 Table 3.2: Whether local authority’s management information systems are
integrated with the systems of its schools ... 33 Table 3.3: Local authority’s position on managed services provision for ICT
resources in schools ... 34 Figure 3.1: Whether local authority runs a learning platform for its schools ... 35 Table 3.4: Whether local authority has a designated ICT curriculum adviser/ICT
strategy manager ... 36 Table 3.5: Whether local authority offers to procure ICT resources on behalf of
schools ... 37 Table 3.6: Frameworks used to conduct ICT procurement competitions ... 38 Table 3.7: Proportion of local authority ICT spend procured using Becta
frameworks by type of spend... 39 Table 3.8: Which Becta frameworks local authority anticipates using in the next
12 months ... 39 Table 3.9: Importance of different funding streams in supporting the use of ICT in
Table 4.2: Formal processes in place to monitor ICT standards in schools ... 45 Table 4.3: Best description of the provision of training and CPD in using ICT in
schools at local authority ... 47 Table 4.4: ICT skills that are most important/second most important in the
professional development of headteachers ... 48 Table 4.5: How headteachers’ CPD needs in the field of ICT are assessed ... 49 Table 4.6: Whether local authority provides schools with advice about their ICT
infrastructure ... 49 Figure 4.1: Whether local authority supports an area-wide e-portfolio system for
learners to record their progress ... 50 Table 4.7: Whether local authority provides advice or recommendations to subject teachers on digital resources for use in the curriculum ... 51 Table 4.8: Whether local authority enables teachers to share digital learning
resources among each other ... 51 Table 4.9: Whether local authority provides online support for 14- to
19-year-olds ... 52 Table 4.10: How does the local authority promote the use of ICT for hard-to-reach
learners/learning difficulties and/or disabilities ... 53 Table 4.11: Services provided by the local authority for enhancing e-safety/
e-security ... 54 Table 4.12: Ways in which Becta’s e-safety advice is used/promoted in local
authority ... 55 Table 4.13: Purpose and types of media that the local authority uses in
communicating with schools ... 56 Table 4.14: Whether local authority convenes a school leader group/network to
discuss ICT development and best practice ... 57 Figure 5.1: Extent to which respondent is aware of the support Becta can
provide ... 60 Table 5.1: Areas in which Becta’s services could be helpful to the local
authority ... 61 Table 5.2: What respondent would say about Becta in conversation with
colleagues ... 62 Table 5.3: Preferred mode of communication with Becta ... 63 Table 5.4: Effectiveness of self-review framework as a tool for assessing
standards of ICT leadership and use in schools ... 63 Table 5.5: Suggestions for improving use of ICT in education within schools in the local authority ... 65
Appendix A
Whether local authority enables teachers to share digital learning resources
among each other by region ... 68 Whether local authority runs a learning platform for its schools by number of
Whether local authority has a fully operational ContactPoint database for the
collection of Every Child Matters indicator data from schools by region ... 71 Whether local authority has a fully operational ContactPoint database for the
collection of Every Child Matters indicator data from schools by percentage of
Introduction
Background
This report presents the findings of the 2008 Harnessing Technology web survey of local authorities conducted by the National Centre for Social Research (NatCen) on behalf of the British Educational Communications and Technology Agency (Becta). This is a follow-up to the 2007 study, also carried out by NatCen (Sinclair and Mortimer, Harnessing Technology Local Authorities Survey 2007).
Becta is responsible to the Department for Children, Schools and Families (DCSF) for the Harnessing Technology e-strategy and a key feature of this work focuses on improving educational institutions’ use of technology for learning. This study forms part of Becta’s wider Harnessing Technology research strand.
The purpose of this study was to develop an understanding of how local authorities support the use of ICT in schools and how they can best be assisted in doing this. An additional aim of the 2008 survey was to try to measure change and progress among local authorities in their support for the use of ICT in education.
Survey objectives
The survey’s aims included attempting to understand the extent to which certain key objectives (listed below) were being achieved:
• Institutions and providers plan and manage technology for learning effectively and sustainably
• Technology-enabled learning environments are secure, supported and interoperable
• There is good use of information to support learner transitions between institutions and sectors.
The survey was conducted from 30 November 2007 to 4 February 2008. Data was collected via an online questionnaire hosted by Gide. The questionnaire was
developed jointly by Becta and NatCen and piloting was carried out by NatCen with two directors of children’s services.
The questionnaire focused on the following key areas: • Local authorities’ support for ICT in their schools
• The capacity of local authorities to provide this support on an ongoing basis
The questionnaire comprised four key modules covering the above points. These modules covered: leadership and policy issues; resources and organisation; support and development; and the role of Becta and the self-review framework.
Survey procedures
Representatives of 153 local authorities (those in England plus Jersey, Guernsey and the Falkland Islands) were invited to take part. The initial contacts for the survey were the directors of children’s services in each local authority in England plus their equivalents in Jersey, Guernsey and the Falkland Islands. In many cases, the director of children’s services involved, or delegated to, other colleagues in the task of completing the questionnaire or parts of it.
Following an initial advance letter, respondents were sent an email at the start of fieldwork on 30 November 2007 with a link to the questionnaire and a unique access password for their local authority. This was followed by a number of reminders – letters, emails, two rounds of telephone chasing and a round of chasing by Becta staff too. The purpose of the reminders was to try to drive the response rate as high as possible and to maximise the extent of question coverage within responses. Respondents could access the questionnaire at any time during the fieldwork period and could save their answers to return at another time. This enabled them to find answers that might not be immediately available and to refer the survey, or parts of it, on to colleagues who might be better placed to answer some questions.
Respondents could move freely through the questionnaire and were not forced to give an answer to one question before moving on to another. While this had the advantage of avoiding a situation where a respondent might give up, it also meant that it was not possible to check that all relevant questions were answered.
Response rates were higher than for the 2007 survey, reflecting the additional resources devoted to reminding respondents. Calculating a response rate for the survey is complicated. In total, 105 respondents out of the 153 contacted (68 per cent) accessed the survey’s ‘welcome page’, and this would be the highest estimate of response. However, some of these answered no questions, or very few, and these have been discounted. Eighty respondents (52 per cent) reached the final page of the questionnaire and submitted their questionnaire, and this would be the lowest estimate of response.
In determining which partial responses to include as valid cases for analysis, we set a minimum of 10 questions which covered most of the first module of the
Interpretation of tables
Weighting has not been applied to the figures presented in this report. The purpose of non-response weighting is to correct for known bias in a dataset. For example, certain groups may be over-represented because they were more likely to respond. Data in this report was checked for bias due to differential response and no evidence of bias was found, meaning that weights were not required. As such, tables and figures in this report show unweighted percentages, means and base sizes. The following symbols have been used in the tables in this report:
[ ] to indicate a percentage based on fewer than 50 respondents • to indicate a percentage value of less than 0.5 per cent
- to indicate a percentage value of zero
n/a to indicate that the answer option was not included in a particular year. Non-responders have been excluded from the bases of all tables and figures. Respondents who entered the questionnaire but answered fewer than 10 questions have also been excluded.
Answers given by all respondents are taken to reflect the policies of the local authority and not the personal views or opinions of the respondent. The terms ‘respondent’ (as in ‘approximately a quarter of respondents…’) and ‘local authority’ (as in ‘the majority of local authorities…’) are used interchangeably throughout the report.
The majority of questions that were asked in the 2007 survey were repeated in 2008. The wording of some of these questions was changed in response to policy
developments or to improve question clarity.
Where appropriate, tables show the 2007 figures for comparison. Any differences made to the question or answer options which are likely to have a minor effect on comparability with the 2007 data are noted with a table footnote. The 2007 figures have not been included in the table where the question or answer options were amended significantly and thus compromised comparability.
difference is statistically significant. Findings statistically significant at the 95% confidence level are referred to as ‘statistically significant’ and at the 99% level as ‘highly statistically significant’ in the footnote text.
Report structure
1
Overview of results
1.1 General overview
The increased level of response to the 2008 survey sets a positive backdrop for this report. The higher response also means that the results reported are more robust. The findings suggest that the majority of local authorities that responded to the
survey were continuing to remain genuinely engaged with their local schools over the use of ICT in teaching and learning and were working closely with the schools to support ICT use.
Recent government initiatives, such as Computers for Pupils and learning platform funding, have put local authorities at the forefront of the ICT agenda. This report has therefore focused on any progress highlighted by the trend data.
Overall, the general picture has changed little. This is not surprising given that the 2008 study was launched less than a year after the 2007 fieldwork closed. There was some evidence to suggest retrograde steps and some signs of progress. The area of the technical support provided to schools by local authorities has seen the most progress; learning platforms, for example, are being rolled out to more schools in local authorities’ remits.
Becta continues to be well regarded and is considered helpful by the majority of local authorities. Indeed, the findings suggest that local authorities are becoming more aware about the type of support that Becta can provide.
1.2 Strategies on ICT use
All local authorities had a written strategy on ICT use in schools or were preparing one. Almost all local authorities with a strategy in place involved at least some schools in drawing it up. Nearly all local authorities reviewed (or planned to review) their strategy on a systematic basis. In terms of frequency of review, the proportion of authorities reviewing their strategy on an annual basis or more often decreased from about half in 2007 to a third in 2008.
1.3 Every Child Matters agenda
There were mixed views regarding the impact of the Every Child Matters agenda on local authorities’ capacity to provide ICT support to schools. This finding may part explain why only 40% of local authorities with an ICT strategy in place combined this strategy with Every Child Matters or the Children and Young People’s Plan. While around a half of authorities felt that the Every Child Matters agenda had a broadly positive impact on their provision of ICT support, about a third felt it made no difference and 12% commented that it had a negative impact on the authority’s capacity to provide support. Almost all local authorities were either using or planned to integrate a ContactPoint database for the collection of Every Child Matters
indicator data from schools.
1.4 Support for headteachers and schools
The level of support and provision for the professional development and training of headteachers in the use of ICT shifted between 2007 and 2008. There was an increase in the proportion of headteachers that had their continuing professional development (CPD) needs assessed, but a decrease in the availability of formal training or CPD opportunities to them.
1.5 Technical support for schools
Early trend data indicates that the most progress has centred on the increased level of technical support provided to schools by local authorities.
The proportion of local authorities mainly responsible for co-ordinating and
monitoring the provision of technical support services for schools increased between 2007 and 2008, representing a shift away from shared responsibility with the
schools.
Furthermore, the use of a single management information system (rather than multiple compatible systems) within schools increased significantly between 2007 and 2008.
Again, as in 2007, the findings suggest that most authorities were closely involved in supporting, enabling and advising on the use of digital resources for teaching and learning in schools. All authorities provided at least some level of support and/or advice on e-safety and e-security issues.
1.6 Learning platforms
resources among each other, and are also mentioned as a method to provide online support to 14- to 19-year-olds.
The findings show that the availability of learning platforms had increased between 2007 and 2008. Furthermore, the implementation of learning platforms was identified by respondents as a general way to improve ICT use in schools. The continued roll-out of learning platforms could also add value to the Government’s home access strategy, by focusing home computer use towards educational purposes.
1.7 Views on Becta
Local authorities responding to the 2008 survey were more aware of the support Becta offered in relation to the use of ICT in education than in 2007. Indeed, the proportion of authorities that used Becta frameworks to procure ICT resources increased between 2007 and 2008 from 78% to 89%. Respondents also mentioned Becta’s self-review framework as a tool to help improve ICT in education.
All authorities made use of Becta’s support, particularly in the fields of ICT leadership, the self-review framework and e-safety.
2
Leadership and policy
This chapter presents findings on leadership and policy issues relating to the use of ICT in schools. Firstly, the chapter looks at ICT visions and strategies that are in place at the local authority. It then explores elements of policy and types of school that are prioritised under the ICT strategy or vision. The chapter concludes by
looking at the impact of the Government’s Every Child Matters agenda on the way in which support is provided to schools.
2.1 Vision and strategy
2.1.1 Formulation of strategy
Respondents were asked whether the local authority had a written1 strategy or vision in place for the use of ICT in schools (hereafter referred to simply as strategy)2. As Table 2.1 shows, three-quarters of local authorities reported having a strategy in place, with the remaining quarter not having one. Generally, these figures were similar in 2007. However, the proportion that said the strategy was not written by the local authority increased from 1 per cent in 2007 to 7 per cent in 20083.
[image:14.595.73.528.467.612.2]Sixty-eight per cent said the strategy was written by the local authority. A quarter reported that they did not have a strategy in place but indicated that one was being planned.
Table 2.1: Whether a written strategy was in place for the use of ICT in schools
2007 %
2008 %
Yes, but it was not written by the local authority 1 7 Yes, and it was written by the local authority 73 68 No, but it was being planned/prepared 24 25 No, and it was not being planned/prepared 1 -
Base 74 96
Base: All respondents answering.
In 2008, one respondent did not answer this question.
1
The term ‘drafted’, which was used in the 2007 survey, was replaced with ‘written’ in the 2008 answer options.
2
In the Harnessing Technology Schools Survey of 2007, 98 per cent of primary schools and 91 per cent of secondary schools had a written strategy for ICT. Nearly all headteachers (94 per cent primary, 83 per cent secondary) said that the local authority had provided information and advice that influenced the school’s e-learning strategy.
3
As with all tables, percentages have been calculated from the responding base.
Local authorities with a strategy in place were asked to identify the national priorities that were incorporated within it.
All local authorities reported that the strategy incorporated the Every School Connected broadband initiative (Table 2.2). Nearly all reported that the strategy incorporated learning platforms (97 per cent) and an online learning space for every child (96 per cent), while 90 per cent reported that it incorporated internet safety. The same proportion (71 per cent) indicated that the strategy incorporated the Building Schools for the Future programme and access to the National Education Network. The most notable changes between 2007 and 2008 were the decreases in the
proportion of authorities that incorporated the Computers for Pupils initiative (from 64 per cent to 50 per cent4) and e-assessment priorities (58 per cent to 43 per cent5).
4
The decrease from 64 per cent to 50 per cent is highly statistically significant.
5
Table 2.2: National priorities incorporated within strategy
2007 %
2008 %
Every School Connected 98 100
Learning platforms 95 97
An online learning space for every child/e-portfolio
91 96
Internet safety1 n/a 90
Building Schools for the Future 62 71
Access to the National Education Network1
n/a 71
Single sign-on1 n/a 64
Universal access to technology for learners at home
55 57
Computers for Pupils 64 50
Interoperability standards1 n/a 49
E-assessment 58 43
Narrowing the Gap1 n/a 40
Primary Capital Programme1 n/a 35
One School Pathfinders1 n/a 14
None - -
Base 55 72
Base: All respondents reporting that a strategy was in place for the use of ICT in schools.
1
New answer option added in 2008.
Percentages sum to more than 100 as respondents could select more than one category.
As with all tables, percentages have been calculated from the responding base.
In 2008 a new question was asked of those local authorities reporting that they had an ICT strategy in place, in order to establish whether this strategy was part of Every Child Matters/Children and Young People’s Plan or stand-alone.
Forty per cent of local authorities reported that the strategy formed part of Every Child Matters/Children and Young People’s Plan, that is, they had no separate document outlining their educational ICT strategy. Sixty per cent said that they had a ‘stand-alone’ ICT strategic document.
Local authorities reporting that they had an ICT strategy in place were asked
Just over a quarter of local authorities (26 per cent) reported that all or most schools in their area had been actively involved in this process (Table 2.3). It was most common for local authorities to report that some schools had been involved, with 30 per cent saying that it was mainly schools selected by the local authority that had participated in the process and 37 per cent saying that it was mainly schools that had volunteered to take part. The general picture is that the majority of local authorities (93 per cent) reported that schools in their area had been involved in this process of strategy formulation to some extent.
Table 2.3: Whether schools were actively involved in formulating strategy
2007 %
2008 %
Yes, all or most schools 27 26
Yes, some schools, ie (mainly) schools selected for this process
42 30 Yes, some schools, ie (mainly) schools
that volunteered to participate
29 37
No 2 7
Base 55 70
Base: All respondents reporting that a strategy was in place for the use of ICT in schools.
As with all tables, percentages have been calculated from the responding base.
2.1.2 Review of strategy
Eighty-nine per cent of local authorities indicated that their strategy for the use of ICT in schools was reviewed on a systematic basis (Table 2.4).
Around a third of local authorities (32 per cent) said that their strategy was reviewed on at least an annual basis, while similar proportions reported that it was scheduled to be reviewed once every 1-2 years (30 per cent) or 2-5 years (27 per cent). Ten per cent of local authorities had not yet finalised their review system.
The proportion of authorities reviewing their strategy on an annual basis or more often decreased from 47 per cent in 2007 to 32 per cent in 20086.
6
Table 2.4: Whether strategy was reviewed on a systematic basis
2008 %
2008 %
Reviewed on a systematic basis 93 89
On an annual basis or more often 47 32
Every 1-2 years 22 30
Every 2-5 years 22 27
Less often than once every five years1 2 n/a
Review system not (yet) finalised2 n/a 10
It is not reviewed systematically 7 1
Base 55 71
Base: All respondents reporting that a strategy was in place for the use of ICT in schools.
1
Answer option removed in 2008.
2
New answer option added in 2008.
As with all tables, percentages have been calculated from the responding base.
2.1.3 Aspects of strategy
Local authorities reporting that they reviewed their strategy systematically were asked to rate the importance of monitoring and evaluating four aspects of strategy during the review process:
• Whether planned activities are being realised (timely and as agreed) • The extent to which the activities are effective in achieving their objectives • The extent to which the effects of the activities contribute to the local
authority’s vision
• How cost-effective are the planned activities being implemented.
All respondents considered the monitoring and evaluating of all four aspects to be important (either ‘fairly’ or ‘very’).
The proportion of respondents reporting that ‘implementation’ was a very important aspect of strategy to evaluate increased from 80 per cent in 2007 to 92 per cent in 20087 (Table 2.5). Conversely, the proportion that considered ‘impact’ to be a very important aspect decreased from 92 per cent in 2007 to 83 per cent in 20088.
7
The increase from 80 per cent to 92 per cent is highly statistically significant.
8
Of these four aspects of strategy, the cost-effectiveness of planned activities was rated the least important.
Table 2.5: Rating of importance of monitoring/evaluating aspects of strategy during review process1
2007 Very important
%
2008 Very important
%
Implementation – whether planned
activities are being realised (timely and as agreed)
80 92
Effectiveness – the extent to which the activities are effective in achieving their objectives
88 87
Impact – the extent to which the effects of the activities contribute to your vision
92 83 Efficiency – how cost-effective are the
planned activities being implemented
56 62
Base 50 63
Base: All respondents reporting that a strategy was in place for the use of ICT in schools and the strategy was reviewed systematically.
1
Please note that answer options ‘Fairly important’, ‘Neither important nor unimportant’, ‘Not very important’ and ‘Not at all important’ are not shown.
As with all tables, percentages have been calculated from the responding base.
2.1.4 Strategy for safeguarding children online
Table 2.6: Whether local authority has a written vision/strategy for the safeguarding of children online
2008 %
Yes 23 No 11
In development 67
Base 93
Base: All respondents answering.
Four respondents did not answer this question.
As with all tables, percentages have been calculated from the responding base.
2.1.5 Strategic Leadership of ICT programme
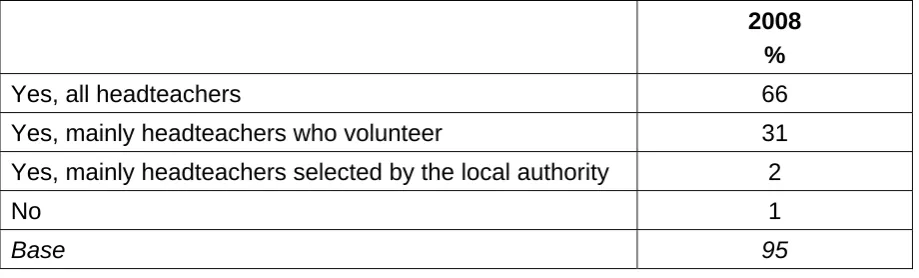
Almost all local authorities (99 per cent) actively encouraged headteachers to participate in the Strategic Leadership of ICT programme delivered by the National College for School Leadership (Table 2.7).
Table 2.7: Whether headteachers are encouraged to participate in the Strategic Leadership of ICT programme
2008 %
Yes, all headteachers 66
Yes, mainly headteachers who volunteer 31 Yes, mainly headteachers selected by the local authority 2
No 1 Base 95
Base: All respondents answering.
Answer options amended in 2008 so figures not comparable with 2007.
Two respondents did not answer this question.
As with all tables, percentages have been calculated from the responding base.
2.1.6 School improvement partners
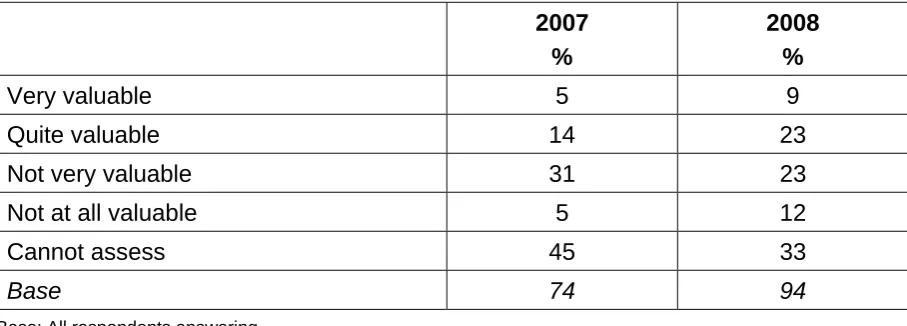
[image:20.595.72.532.436.575.2]Respondents’ views on the work of school improvement partners were evenly divided, with 32 per cent considering them to be valuable, 35 per cent not valuable, while 33 per cent could not assess. However, these views were more favourable than in 2007 when only 19 per cent of respondents found the work of school improvement partners to be valuable9.
Table 2.8: Extent to which school improvement partners have been valuable in supporting the use of ICT in schools
2007 %
2008 %
Very valuable 5 9
Quite valuable 14 23
Not very valuable 31 23
Not at all valuable 5 12
Cannot assess 45 33
Base 74 94
Base: All respondents answering.
In 2008, three respondents did not answer this question.
As with all tables, percentages have been calculated from the responding base.
Of the 33 respondents reporting that the work of school improvement partners was not valuable, 27 suggested that lack of specialist knowledge was a reason and 25 considered lack of time/competing interests to be a factor.
2.2 Policy priorities
2.2.1 Prioritised elements of strategy
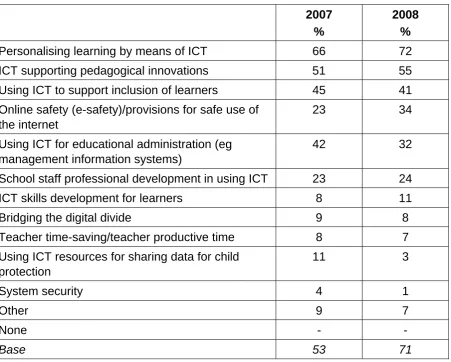
Local authorities with a written strategy for ICT in schools were asked to identify up to three elements that had been given priority in their strategy from the list shown in Table 2.9.
Seventy-two per cent identified ‘personalising learning by means of ICT’ and just over half (55 per cent) identified ‘ICT supporting pedagogical innovations’ as priorities. In 41 per cent of cases, ‘using ICT to support inclusion of learners’ was identified as a priority. About a third of local authorities considered that ‘online safety’ and ‘using ICT for educational administration’ were priorities (34 per cent and 32 per cent respectively). Overall, the strategy elements that local authorities prioritised were broadly similar in 2008 compared with 2007. However, the proportion of
9
respondents identifying online safety as a priority increased from 23 per cent in 2007 to 34 per cent in 200810.
Table 2.9: Elements given priority in strategy
2007 %
2008 %
Personalising learning by means of ICT 66 72 ICT supporting pedagogical innovations 51 55 Using ICT to support inclusion of learners 45 41 Online safety (e-safety)/provisions for safe use of
the internet
23 34 Using ICT for educational administration (eg
management information systems)
42 32 School staff professional development in using ICT 23 24
ICT skills development for learners 8 11
Bridging the digital divide 9 8
Teacher time-saving/teacher productive time 8 7 Using ICT resources for sharing data for child
protection
11 3
System security 4 1
Other 9 7
None - -
Base 53 71
Base: All respondents reporting that a strategy was in place for the use of ICT in schools.
In 2008, one respondent did not answer this question.
Percentages sum to more than 100 because respondents could select more than one category.
As with all tables, percentages have been calculated from the responding base.
2.2.2 Areas prioritised for ICT support
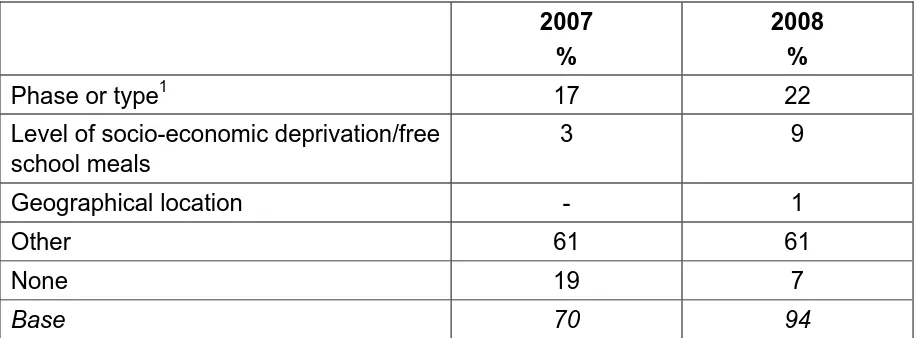
Respondents were asked to identify, from a list, the single most important factor in prioritising ICT support in their local authority.
The phase or type of schools (for example, foundation, nursery/early years, primary, middle, secondary, special/PRU) was considered to be the most important factor (Table 2.10).
10
However, as in 2007, the majority of respondents (61 per cent) reported that the most important factor for their local authority was something not listed (‘other’). When asked to specify these other factors, many of these respondents said that the varying needs of individual schools was the most important consideration. A few
respondents cited the Becta self-review framework as a tool to target support and identify need. Five local authorities reported that ICT support was based on service-level agreements with the schools. Seven per cent of respondents said that there was no single most important factor in prioritising ICT support.
There was a significant increase in the proportion of respondents identifying ‘level of socio-economic deprivation/free school meals’ as the most important factor in
[image:23.595.72.530.336.505.2]prioritising ICT support, increasing from 3 per cent in 2007 to 9 per cent in 200811. Table 2.10: Single most important factor in prioritising ICT support in local authority
2007 %
2008 %
Phase or type1 17 22
Level of socio-economic deprivation/free school meals
3 9
Geographical location - 1
Other 61 61
None 19 7
Base 70 94
Base: All respondents answering.
1
Answer option amended in 2008 to clarify phase or type of schools (eg foundation, nursery/early years, primary, middle stage, secondary, special/PRU).
In 2008, three respondents did not answer this question.
As with all tables, percentages have been calculated from the responding base.
Respondents reporting that phase of schooling was the single most important factor in prioritising ICT support were asked to identify the school type which was the main recipient of ICT support in their local authority. Of the 21 respondents that were asked this question, 18 reported that primary schools were the main recipients and three reported that secondary schools were the main recipients.
All respondents were then asked to select the main reason for focusing support on the specific school type (that is, phase, geographical location, deprivation or other reason) that they previously mentioned. About a quarter (23 per cent) reported
11
educational weakness in the sector and 18 per cent relative weakness in the management or use of ICT, while nearly half (45 per cent) cited ‘other’ reasons. Of the 38 respondents that reported other reasons, many, again, reported that the specific needs of individual schools were the key consideration when focusing
support on specific schools types. Reasons given for focusing support on the specific school types were ‘scarcity of resources’, ‘national and local policy’ and ‘raising standards’.
Respondents were asked to identify up to five curriculum areas that received the highest priority when deploying the local authority’s ICT support (across all
educational phases). Mathematics (87 per cent), English (86 per cent) and ICT (77 per cent) were prioritised most by local authorities (Table 2.11). Sixty-two per cent of local authorities reported that science was prioritised.
The prioritisation of curriculum areas for ICT support in 2008 was broadly similar to that in 2007, with the exceptions of ICT and design and technology, both of which fell in priority (85 per cent to 77 per cent12 and 29 per cent to 6 per cent13 respectively). However, the addition of three additional subjects to the answer option list in 2008 may have affected comparability.
12
The decrease from 85 per cent to 77 per cent is statistically significant.
13
Table 2.11: Curriculum areas with highest priority for ICT support
2007 %
2008 %
Mathematics 89 87
English 83 86
ICT 85 77
Science 59 62
Modern foreign languages 21 22
Design and technology 29 6
Citizenship education1 n/a 6
Geography 6 4
Art1 n/a 4
Music1 n/a 3
History 2 1
Physical education 3 -
Religious education - -
Base 66 77
Base: All respondents answering.
1
New answer option added in 2008.
In 2008, 20 respondents did not answer this question.
Percentages sum to more than 100 because respondents could select more than one category.
As with all tables, percentages have been calculated from the responding base.
For each curriculum area identified as a priority, respondents were asked to select a reason from the following list:
• Evidence says ICT is most effective/valuable in this subject
• For this subject, most ICT resources (for example, educational software) are available
• In this subject, there are most weaknesses in schools’ achievement • This subject is nationally prioritised/part of a national initiative
• Other reason.
Respondents tended to report that the national prioritisation of a subject was the main reason for it being prioritised for ICT support by their local authority. This
Table 2.12: Main reason for selecting curriculum area as a priority1
Evidence says ICT
most effective/
valuable
Most ICT resources
available
Weaknesses in schools’ achievement
Nationally prioritised/ national initiative
Other Base
Maths 9% 3% 12% 67% 9% 67
Science [15%] [6%] [8%] [54%] [17%] 48
English 6% - 14% 71% 9% 66
ICT 20% 8% 12% 42% 17% 59
Base: Respondents identifying subject area as ‘highest priority’.
1
Please note that percentages for answer options geography, history, religious education, physical education, citizenship education, music, art, and design and technology are not shown in the table due to small base sizes.
Percentages in this table should be read horizontally.
2.2.3 National policy initiatives
About three-quarters of local authorities reported evaluating at least one national policy initiative. Half of the local authorities indicated that the Computers for Pupils (52 per cent) and Building Schools for the Future (52 per cent) initiatives were being evaluated (Figure 2.1). Smaller proportions were evaluating the Hands On Support (26 per cent, down from 38 per cent in 2007) and Schools Whiteboard Expansion projects (21 per cent, down from 32 per cent in 2007)14.
Twenty-three per cent of local authorities said they were not evaluating any of the named initiatives.
14
Figure 2.1: National policy initiatives being evaluated by the local authority
Base: All respondents answering (2007 = 69, 2008 = 94).
Percentages sum to more than 100 because respondents could select more than one category.
2.3 Every Child Matters agenda
Every Child Matters is a government programme for a national framework to support the ‘joining up’ of children’s services to improve the well-being of children and young people from birth to age 19. The five key aspects of its agenda are:
• Stay safe
• Be healthy
• Enjoy and achieve
• Make a positive contribution • Achieve economic well-being.
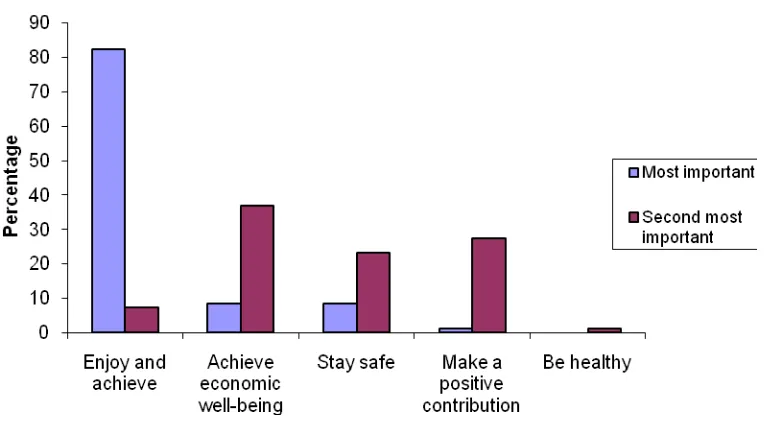
Respondents were asked to assess to which two aspects of the agenda ICT made the greatest contribution.
Local authorities felt ICT could make the most important contribution to the ‘enjoy and achieve’ aspect of the agenda, with 89 per cent selecting it as either the most important or second most important (Figure 2.2). This corresponds closely with the 2007 data where 90 per cent selected it as the most or second most important. Local authorities considered that ICT was least able to make an important
as the most important aspect and only 1 per cent selecting it as the second most important.
Figure 2.2: Aspects of the Every Child Matters agenda to which ICT made the greatest contribution
Base: All respondents answering (95).
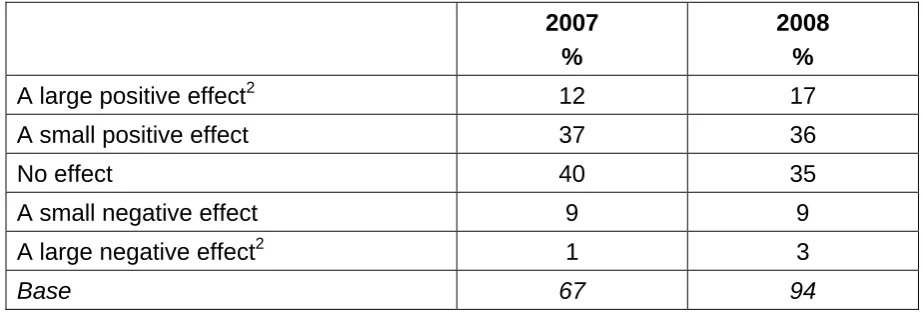
Table 2.13: Impact of Every Child Matters agenda on local authority’s capacity to provide ICT support to schools1
2007 %
2008 %
A large positive effect2 12 17
A small positive effect 37 36
No effect 40 35
A small negative effect 9 9
A large negative effect2 1 3
Base 67 94
Base: All respondents answering.
1
Minor amendments to question wording made in 2008.
2
The term ‘significant’ was replaced with 'large' in 2008.
In 2008, three respondents did not answer this question.
As with all tables, percentages have been calculated from the responding base.
Respondents were asked whether their local authority had a fully operational database for the collection of Every Child Matters indicator data from schools. Just under a fifth of local authorities (18 per cent) reported that they had such a database (Table 2.14). In 2007, 24 per cent of local authorities gave this answer.
Seventy-five per cent of local authorities reported that they did not have such a database at present but planning was underway for one. A small minority (7 per cent) said that they did not have one and no such plans were in place to implement one.
Table 2.14: Whether local authority has a fully operational ContactPoint
database for the collection of Every Child Matters indicator data from schools1
2007 %
2008 %
Yes 24 18
No, but we are planning for this 71 75
No, and this is not being planned 5 7
Base 63 89
Base: All respondents answering.
1
In 2007, the question did not specify a ContactPoint database.
In 2008, eight respondents did not answer this question.
2.4 Summary
Key findings
There is evidence to suggest a continued commitment among local authorities, in consultation with schools, to develop and implement an ICT strategy.
The theme of personalising learning through ICT is supported by the continued incorporation of learning platforms within local authorities’ strategies.
• Three-quarters of local authorities reported having a written strategy in place for the use of ICT in schools.
• Among local authorities with a strategy in place, all local authorities reported that the strategy incorporated the Every School Connected
broadband initiative. Almost all reported that the strategy also incorporated learning platforms (97 per cent) and an online learning space for every child (96 per cent), while nine in ten reported that it incorporated internet safety.
• Forty per cent of local authorities with a strategy in place reported that this strategy formed part of Every Child Matters/Children and Young People’s Plan while 60 per cent said that it was ‘stand-alone’.
• A large majority of local authorities with a strategy in place (93 per cent) reported that at least some schools in their area had been actively involved in formulating the strategy.
• Nearly all local authorities (99 per cent) indicated that their strategy for the use of ICT in schools was reviewed on a systematic basis or was
scheduled to be reviewed.
• The proportion of respondents reporting the work of school improvement partners to be valuable increased from 19 per cent in 2007 to 32 per cent in 2008.
• Among local authorities with a strategy in place, 72 per cent identified ‘personalising learning by means of ICT’ and 55 per cent identified ‘ICT supporting pedagogical innovations’ as priorities.
• Mathematics (87 per cent), English (86 per cent) and ICT (77 per cent) were prioritised most frequently by local authorities deploying ICT support resources. The national prioritisation of a subject was the main reason for it being prioritised for ICT support by local authorities.
• With regard to the five key aspects of the Government’s Every Child Matters agenda, local authorities felt they could make the most important contribution to the ‘enjoy and achieve’ aspect.
• Regarding the impact of the Every Child Matters agenda on their capacity to provide ICT support to schools, over half of local authorities (53 per cent) felt there had been a positive impact.
3
Resources and organisation
This chapter focuses on the supply of ICT hardware and support to schools, as well as ICT funding. It begins by looking at the organisation of technical support at the local authority, managed services provision agreements and learning platforms. The chapter then moves on to look at the procurement of ICT equipment before finally looking at funding streams.
3.1 Organisation
3.1.1 Responsibility for technical support/advice
Responsibility for co-ordinating and monitoring the provision of technical support services was shared between the local authority and schools in a third (32 per cent) of local authorities (Table 3.1). Among the remaining local authorities, schools were as likely as local authorities to be responsible (either mainly or wholly) for these tasks (27 per cent and 28 per cent respectively), indicating a fairly even split of responsibility. The proportion of local authorities mainly responsible for co-ordinating and monitoring the provision of technical support services increased from 14 per cent in 2007 to 28 per cent in 200815, representing a shift away from shared responsibility with schools.
Table 3.1: Responsibility for co-ordinating/monitoring the provision of technical support services
2007 %
2008 %
The local authority is mainly or wholly responsible
14 28 The schools are mainly or wholly
responsible
29 27 Responsibility is shared between the local
authority and the schools
47 32 A private sector provider under managed
services contract is responsible
6 5
Other 4 7
Base 70 96
Base: All respondents answering.
In 2008, one respondent did not answer this question.
As with all tables, percentages have been calculated from the responding base.
15
3.1.2 Management information systems
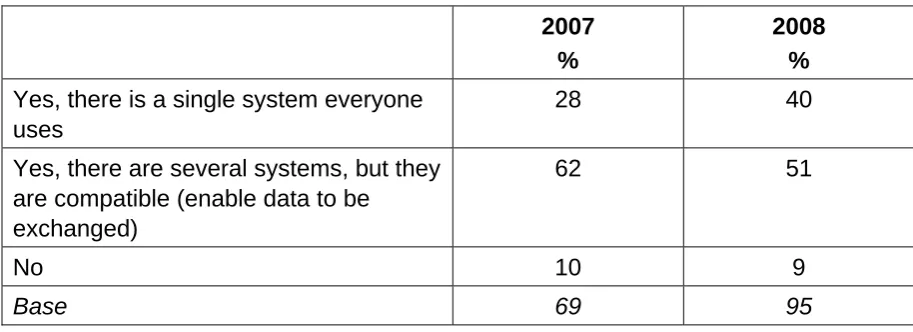
Ninety-one per cent of local authorities reported that their management information systems (MIS) were integrated with the systems in their schools (Table 3.2). Forty per cent had a single system that everyone used and just over half (51 per cent) reported that several compatible systems were used.
[image:33.595.71.528.355.521.2]In 2007, 28 per cent of authorities reported that a single MIS system everyone used had been introduced across all of its schools. This had increased to 40 per cent16 in 2008. Conversely, there was a decrease in the proportion of authorities that used multiple compatible MIS systems, from 62 per cent in 2007 to 51 per cent in 200817. Nine per cent of local authorities did not have MIS systems integrated with the systems of its schools.
Table 3.2: Whether local authority’s management information systems are integrated with the systems of its schools
2007 %
2008 %
Yes, there is a single system everyone uses
28 40 Yes, there are several systems, but they
are compatible (enable data to be exchanged)
62 51
No 10 9
Base 69 95
Base: All respondents answering.
In 2008, two respondents did not answer this question.
As with all tables, percentages have been calculated from the responding base.
3.1.3 Managed services provision
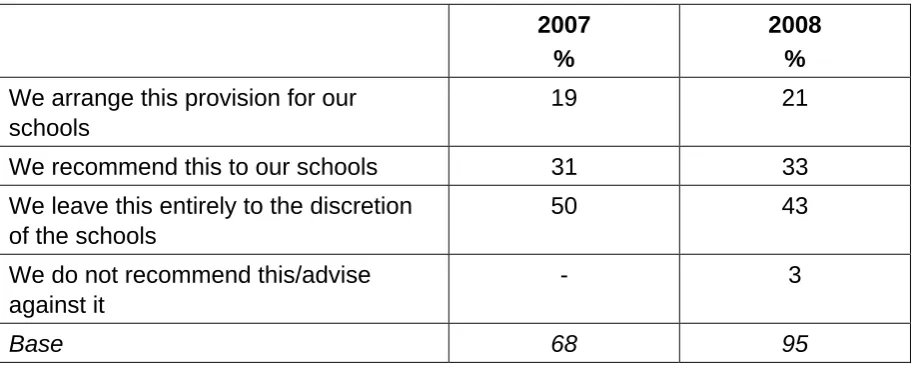
A managed services provision is an arrangement by which ICT resources are provided with full service, including technical support and maintenance.
Respondents were asked to indicate the local authority’s position on this type of provision for ICT resources in schools (Table 3.3). Twenty-one per cent arranged them for their schools, 33 per cent recommended them to schools but did not provide them, and 43 per cent left this decision to the schools themselves.
16
The increase from 28 per cent to 40 per cent is highly statistically significant.
17
Table 3.3: Local authority’s position on managed services provision for ICT resources in schools
2007 %
2008 %
We arrange this provision for our schools
19 21
We recommend this to our schools 31 33
We leave this entirely to the discretion of the schools
50 43 We do not recommend this/advise
against it
- 3
Base 68 95
Base: All respondents answering.
In 2008, two respondents did not answer this question.
As with all tables, percentages have been calculated from the responding base.
3.1.4 Learning platforms
The term ‘learning platform’ describes a broad range of ICT systems used to deliver and support learning. These systems can be accessed either from school/college or remotely. Local authorities are responsible for the implementation of learning
platforms for schools in their area.
The Government’s e-strategy set the expectation that:
• by spring 2008 every pupil should have access to a personalised online learning space with the potential to support an e-portfolio (provided by their local authority)
• by 2010 every school should have integrated learning and management systems (a comprehensive suite of learning platform technologies)18. Evidence suggests that learner home access to technology impacts negatively on attainment if not used for educational purposes (Fuchs and Woessmann 2005). The success of home access initiatives may therefore partly depend on the universal implementation of learning platforms and the integration of learning/teaching with home access.
Local authorities varied in their use of learning platforms for schools (Figure 3.1). Nearly half (48 per cent) reported that they ran a learning platform for all of their
18
schools, while 28 per cent reported that they ran a learning platform for at least some of their schools.
[image:35.595.92.508.315.524.2]This trend data illustrates progress with the implementation of learning platform systems in line with the Government’s e-strategy. In 2007, 37 per cent of authorities ran learning platforms in all the schools in their remit. This increased to 48 per cent in 200819. Conversely, the proportion of authorities reporting that they did not run a learning platform declined from 26 per cent in 2007 to 14 per cent in 200820. The overall picture is one of a shift towards local authority provision of learning platforms to more schools.
Figure 3.1: Whether local authority runs a learning platform for its schools1
Base: All respondents answering (96).
1
In 2007, the term ‘integrated learning platform’ was used.
3.1.5 Curriculum advisers and ICT strategy managers
Local authorities were asked whether they had a designated ICT curriculum adviser and strategy manager and, if so, the number of full-time equivalent (FTE) posts for each job title.
The vast majority of local authorities reported having a designated ICT curriculum adviser (88 per cent), with nearly three-quarters (74 per cent) saying they had at least one FTE post (Table 3.4). Local authorities were slightly less likely to report
19
The increase from 37 per cent to 48 per cent is statistically significant.
20
having an ICT strategy manager, although 82 per cent said they had someone in this role.
[image:36.595.72.528.247.383.2]These results are broadly similar to the 2007 figures (not shown). However, the proportion of authorities that reported they did not have a designated ICT curriculum adviser increased from 6 per cent in 2007 to 12 per cent in 200821.
Table 3.4: Whether local authority has a designated ICT curriculum adviser/ICT strategy manager
No/none Yes – less than one
FTE
Yes – one FTE
Yes – more than one
FTE
Base
ICT
curriculum adviser
12% 14% 41% 33% 92
ICT strategy manager
18% 19% 56% 7% 88
Base: All respondents answering.
In 2008, five respondents did not answer part a (re ICT curriculum adviser) and nine respondents did answer part b (re ICT strategy manager).
As with all tables, percentages have been calculated from the responding base.
Percentages in this table should be read horizontally.
3.2 Procurement
All local authorities were asked to indicate the proportion of schools in their area for which they offered to procure hardware, software and connectivity resources. Nearly all local authorities (99 per cent) provided a procurement service for at least some schools wishing to purchase connectivity (Table 3.5).
Thirty-two per cent of local authorities did not offer a hardware procurement service and 28 per cent did not offer to procure software.
21
Table 3.5: Whether local authority offers to procure ICT resources on behalf of schools
Yes – for all/most schools
Yes – for some schools
No Base
ICT equipment (hardware) 41% 27% 32% 94
Digital learning resources (software) 40% 32% 28% 94
Connectivity 93% 6% 1% 95
Base: All respondents answering.
In 2008, three respondents did not answer part a or b (re ICT equipment and digital learning resources) and two respondents did answer part c (re connectivity).
As with all tables, percentages have been calculated from the responding base.
Note that percentages in this table should be read horizontally.
Respondents were then asked to specify the frameworks that they used when running ICT procurement competitions and were allowed to select more than one category (as local authorities can use more than one framework). The overwhelming majority of local authorities used Becta frameworks (89 per cent), while regional broadband consortium (69 per cent) and ‘own procurement’ frameworks (54 per cent) were both commonly used by local authorities (Table 3.6).
Overall, there was an increase in the use of these frameworks to procure ICT resources on behalf of schools. The proportion of authorities that used Becta frameworks increased between 2007 and 200822. Furthermore, the use of regional broadband consortium frameworks and Office of Government Commerce
frameworks increased between 2007 and 200823.
22
The difference between 78 per cent in 2007 and 89 per cent in 2008 is highly statistically significant.
23
Table 3.6: Frameworks used to conduct ICT procurement competitions1
2007 %
2008 %
Becta frameworks 78 89
Regional broadband consortium frameworks
54 69
Own procurement framework 54 54
Office of Government Commerce frameworks
24 36 Regional buying consortium frameworks 32 26
Other 7 6
None of these - 2
Base 68 95
Base: All respondents answering.
1
Minor amendments made to wording and order of answer options in 2008.
In 2008, two respondents did not answer this question.
Percentages sum to more than 100 because respondents could select more than one category.
As with all tables, percentages have been calculated from the responding base.
Table 3.7: Proportion of local authority ICT spend procured using Becta frameworks by type of spend
None Less than
half
Around half
More than half
Base
Local authority direct spend 15% 68% 9% 9% 80 Local authority including
schools spend
6% 76% 10% 8% 79
Base: Respondents reporting they used Becta frameworks to conduct ICT procurement competitions.
As with all tables, percentages have been calculated from the responding base.
Percentages in this table should be read horizontally.
The 10 respondents that reported that they did not use Becta frameworks to conduct ICT procurement competitions were asked why they did not. Nine respondents indicated that Becta frameworks were not their preferred option. One respondent did not understand how to use the Becta frameworks.
Respondents were asked which Becta frameworks they anticipated using in the next 12 months. Just over half (52 per cent) reported that they would use the Learning Platform Services Framework and 44 per cent the Infrastructure Services Framework (Table 3.8). Approximately a quarter planned to use the Software Licensing
Framework (28 per cent) and Consultancy Framework (26 per cent) in the next 12 months.
Table 3.8: Which Becta frameworks local authority anticipates using in the next 12 months
2008 %
Learning Platform Services Framework 52 Infrastructure Services Framework 44
Software Licensing Framework 28
Consultancy Framework 26
None of these 19
Base 93
Base: All respondents answering.
In 2008, four respondents did not answer this question.
Percentages sum to more than 100 because respondents could select more than one category.
[image:39.595.70.527.516.678.2]3.3 Funding streams
3.3.1 Importance of funding streams
Local authorities were asked to indicate the importance of a number of funding streams in supporting the use of ICT in schools with regard to their total spending in this area. For each funding stream they were asked to evaluate its importance at present as well as their expectation of its importance in 1-2 years’ time.
With the exception of EC subsidies and EC funding, all listed funding sources were considered to be important at present as well as in 1-2 years’ time (Table 3.9). Standards funding was considered the most important current source of funding with almost all respondents (96 per cent) saying it was ‘very’ or ‘moderately’ important. Approximately three-quarters considered the central local authority budget (74 per cent) and buy-back (76 per cent) to be either ‘very’ or ‘moderately’ important. Broadly similar levels of importance were expected for the listed funding sources in 1-2 years’ time.
Ten respondents cited other sources of funding, of which five mentioned the Building Schools for the Future programme.
The proportion of authorities that reported central local authority budgets were a very important current source of funding increased from 34 per cent in 2007 to 51 per cent in 200824. Similarly, the proportion expecting that the central local authority budget would be a very important source of funding in 1-2 years’ time increased from 32 per cent in 2007 to 51 per cent in 200825.
24
The increase from 34 per cent to 51 per cent is highly statistically significant.
25
Table 3.9: Importance of different funding streams in supporting the use of ICT in schools1
Very important source of funding
Moderately important source
of funding
Base
Central local authority budget
Current2 51% 23% 91
In 1-2 years 51% 17% 90
Standards funding
Current2 92% 4% 92
In 1-2 years 82% 9% 91
Buy-back
Current2 52% 24% 92
In 1-2 years 63% 20% 90
EC subsidies/EC funding
Current2 4% 2% 81
In 1-2 years 3% 5% 77
Base: All respondents answering.
1
Note that percentages for answer options ‘Source of funding of limited importance’, ‘Insignificant/nil’ and ‘Cannot assess’ are not shown.
2
The term ‘present’ was replaced with ‘current’ in 2008.
Numbers of respondents not answering: ‘Central local authority budget’ – 6/7, ‘Standards funding’ – 5/6, ‘Buy-back’ – 5/7, ‘EC subsidies/EC funding’ – 16/20.
As with all tables, percentages have been calculated from the responding base.
3.3.2 Capacity to support schools
Taking all factors into account, respondents were asked whether their overall capacity to support schools in using ICT was higher or lower compared with two years ago.
Table 3.10: Whether overall capacity to support schools in using ICT was higher or lower than two years ago1
2007 %
2008 %
Higher 29 31
Roughly the same 38 38
Lower 33 31
Base 66 94
Base: All respondents answering.
1
Minor amendments made to question wording in 2008.
In 2008, three respondents did not answer this question.
As with all tables, percentages have been calculated from the responding base.
If the local authority’s capacity had changed compared with two years ago, respondents were asked the reasons why from a list of possible explanations. Where capacity was higher than two years ago (in 28 local authorities), the main reasons were:
• schools’ demand for ICT support (22 mentions) • (increased) DCSF finances/funding (20 mentions)
• organisational changes in the local authority (16 mentions).
Where capacity was lower than two years ago (in 36 local authorities), the main reasons were:
• (reduced) DCSF finances/funding (28 mentions)
3.4 Summary
Key findings
The significant increase in the proportion of local authorities that ran learning platforms between 2007 and 2008 supports local authorities’ reported commitment to implementation and personalising learning through ICT.
• There has been a shift away from shared responsibility between local authorities and schools for technical support to main local authority control. Overall, there was a fairly even split of responsibility with a third of
authorities sharing responsibility, a third having main or sole control and a third leaving main or sole control to their schools.
• Ninety-one per cent of local authorities reported that their management information systems (MIS) were integrated with the systems in their schools. The proportion of local authorities with a single MIS system that everyone used increased from 28 per cent in 2007 to 40 per cent in 2008. • Local authorities were split with regard to their position on managed
services provision: 21 per cent arranged them for their schools, 33 per cent recommended them to schools but did not provide them, and 43 per cent left this decision to the schools themselves.
• There has been a shift towards local authority provision of learning platforms and an increase in the level of their implementation.
• Eighty-eight per cent of schools reported that they had a designated ICT curriculum adviser and 82 per cent reported having an ICT strategy manager.
• Practically all (99 per cent) local authorities provided a procurement service for at least some schools wishing to purchase connectivity; 32 per cent of local authorities did not offer a hardware procurement service and 28 per cent did not offer to procure digital learning resources (software). • Becta frameworks were the frameworks most commonly used for running
ICT procurement competitions; the proportion of authorities using them increased from 78 per cent in 2007 to 89 per cent in 2008.
• The proportion of local authorities reporting that their central budget was a very important source of funding currently and/or expected to be in the next 1-2 years increased significantly between 2007 and 2008.
4
Support and development
This chapter examines how different aspects of ICT usage in schools are monitored as well as the support and training provided by the local authority. Firstly, it looks at formal processes in place to monitor ICT standards as well as local authorities’ views on the importance of monitoring different aspects of ICT usage. It then moves on to examine the provision of training and assessment for school staff. Next, the chapter looks at the provision of services designed to enhance e-safety and e-security, before finally looking at the means by which local authorities communicate with their schools.
4.1 Monitoring
4.1.1 Importance of monitoring aspects of ICT usage in schools
Respondents were asked to rank the relative importance of monitoring aspects of ICT usage in schools.
Clearly ranked as the most important aspect, with nearly all respondents (88 per cent) selecting it, was ‘use of ICT for learning and teaching’ (Table 4.1). The aspect of ICT usage considered the second most important was ‘use of ICT for
management and administration in schools’ (42 per cent). The aspects to monitor identified as important by fewest respondents were the ‘use of ICT for learner assessment’ and ‘use of ICT for inclusive practice/mainstreaming of SEN learners’. Overall, the areas that local authorities prioritised remained broadly similar in 2008 compared with 2007.
Table 4.1: Importance of monitoring aspects of ICT usage in schools
Most important %
Second most important
%
Use of ICT for learning and teaching 88 11 Use of ICT for management and
administration in schools
2 42
E-safety 8 22
Use of ICT for learner assessment 1 15
Use of ICT for inclusive practice/ mainstreaming of SEN learners
- 8
Base 92 92
Base: All respondents answering.
In 2008, four respondents did not answer this question.