A STUDY OF SLEEP PATTERN IN TYPE 2 DIABETES MELLITUS PATIENTS AND ITS CORRELATION WITH HbA1c
Dissertation submitted to
The Tamil Nadu Dr. MGR Medical University
In partial fulfillment of the regulations for the award of the degree of
M.D. PHYSIOLOGY Branch V
INSTITUTE OF PHYSIOLOGY & EXPERIMENTAL MEDICINE
Madras Medical College and Rajiv Gandhi Government General Hospital
CHENNAI –600003
THE TAMIL NADU DR. MGR MEDICAL UNIVERSITY
CHENNAI –600032
CERTIFICATE
This is to certify that the dissertation entitled “A STUDY OF SLEEP
PATTERN IN TYPE 2 DIABETES MELLITUS PATIENTS AND ITS
CORRELATION WITH HbA1c” by the candidate Dr. SARAVANAN.V, for
M.D Physiology is a bonafide record of the research done by him during the
period of the study (2015-2018) in the Institute of Physiology and Experimental
Medicine, Madras Medical College, Chennai- 600 003.
DEAN Director and Professor
Madras Medical College Institute of Physiology and
Chennai Experimental Medicine,
Madras Medical College, Chennai-600003
ACKNOWLEDGEMENT
I express my profound gratitude to Dr.R.NARAYANA BABU, M.D.,
DCH., Dean, Government Madras Medical College and Hospital, Chennai, for
permitting me to do this study and use all the needed resources for this
dissertation work.
I will forever be thankful to Prof. Dr.A.SHAKEELA BANU ,M.D., the
Director & Professor, Institute of Physiology & Experimental Medicine , Madras
Medical College, Chennai, for providing insightful discussions about the research
and giving me the opportunity to develop my own individuality and allowing me
to work with such independence.
I extend my sincere thanks to Prof.Dr. K.PADMA,M.D., Former Director
of Institute of Physiology, Madras Medical College, Chennai, for giving me the
motivation and initiative for doing this study
I sincerely express my grateful thanks to Prof.Dr.P.DHARMARAJAN,
M.D, D.Diab., Director, Institute of Diabetology, Rajiv Gandhi Government
General Hospital, Chennai, for granting me permission to recruit cases from the
I extend my sincere thanks to Prof. Dr.R.VIJAYALAKSHMI, M.D.,
Professor , Institute of Physiology and Experimental Medicine, Madras Medical
College, without whom it would have been totally impossible to accomplish this
work. I also sincerely thank her for her valuable guidance and motivation
throughout my study.
I extend my sincere thanks to Prof. Dr.C.THIRUPATHI, M.D.,D.C.H.,
Professor, Institute of Physiology, Madras Medical College, Chennai, for his
valuable suggestions and motivation throughout my study.
I extend my sincere thanks to Prof. Dr. A. PARIMALA, M.D., DCP.,
Professor, Institute of Physiology, Madras Medical College, Chennai, for her
valuable suggestions and motivation throughout my study.
I extend my sincere thanks to Prof. Dr.P.SATHYA, M.D.,D.G.O.,
Professor, Institute of Physiology, Madras Medical College, Chennai, for her
valuable suggestions and motivation throughout my study.
I extend my sincere thanks to Dr.J.RATNA MANJUSHREE, M.D.,
D.C.H., Associate Professor, Institute of Physiology, Madras Medical College,
Chennai, for her valuable suggestions and motivation throughout my study.
I extend my thanks to Dr. RAMADEVI, M.D., Professor and Director,
I express my sincere thanks to Dr. T.N.VIJAYALAKSHMI, M.D.,
Dr. SHANTHIMALAR,M.D., Dr.S.KAVITHA,M.D., Dr.K.AANANDHA
SUBRAMANIUM,M.D., Dr.V.GOWRI,M.D., Dr.INDHUMATHI.D, M.D.,
Dr.SYED SAFINA, M.D., Dr.ANITHA PONMALAR, M.D.,
Dr.V.SUMATHI, M.D., Assistant Professors ,Institute of Physiology and
Experimental Medicine, Madras Medical College, Chennai for their guidance and
support.
I express my sincere thanks to my Senior Post Graduates and my Co Post
Graduates in Institute of Physiology, Madras Medical College, Chennai.
I dedicate this work to my lovable family. I thank God Almighty for
CONTENTS
I. LIST OF TABLES
II. LIST OF GRAPHS
III.LIST OF PHOTOGRAPHS
IV.LIST OF FIGURES
V.ABBREVIATIONS
CHAPTER No. TITLE PAGE No.
1 INTRODUCTION 1
2 REVIEW OF LITERATURE 21
3 AIM AND OBJECTIVES 37
4 MATERIALS AND METHODS 38
5 RESULTS 61
6 DISCUSSION 77
7 CONCLUSION 81
8 SUMMARY 82
BIBLIOGRAPHY
ANNEXURES
(i) ETHICAL COMMITTEE APPROVAL
(ii) CONSENT FORM
(iii) PROFORMA
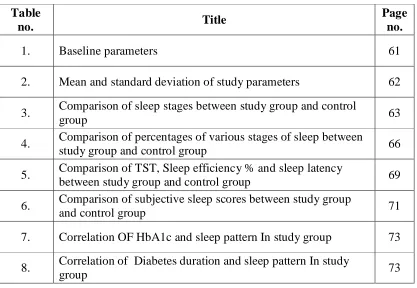
LIST OF TABLES
Table
no. Title
Page no.
1. Baseline parameters 61
2. Mean and standard deviation of study parameters 62
3. Comparison of sleep stages between study group and control
group 63
4. Comparison of percentages of various stages of sleep between
study group and control group 66
5. Comparison of TST, Sleep efficiency % and sleep latency
between study group and control group 69
6. Comparison of subjective sleep scores between study group
and control group 71
7. Correlation OF HbA1c and sleep pattern In study group 73
8. Correlation of Diabetes duration and sleep pattern In study
group 73
LIST OF PHOTOGRAPH
Photo
no. Title
Page no.
1. Storage samples of FBS, PPBS samples 40
2. Storage of HbA1c samples 42
3. Sleep study Polysomnography Instruments 45
4. Placing electrodes of Polysomnography to Diabetes patient 47
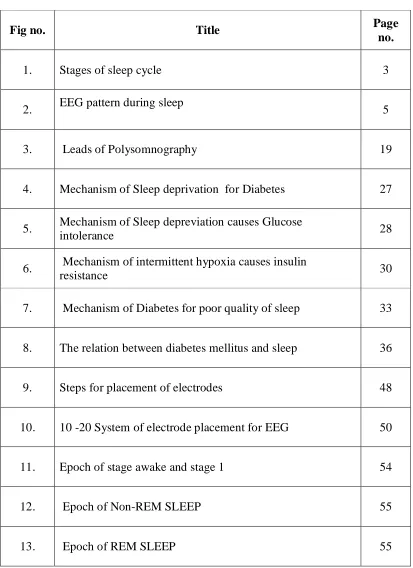
[image:7.612.111.528.92.380.2]LIST OF FIGURES
Fig no. Title Page
no.
1. Stages of sleep cycle 3
2. EEG pattern during sleep 5
3. Leads of Polysomnography 19
4. Mechanism of Sleep deprivation for Diabetes 27
5. Mechanism of Sleep depreviation causes Glucose
intolerance 28
6. Mechanism of intermittent hypoxia causes insulin
resistance 30
7. Mechanism of Diabetes for poor quality of sleep 33
8. The relation between diabetes mellitus and sleep 36
9. Steps for placement of electrodes 48
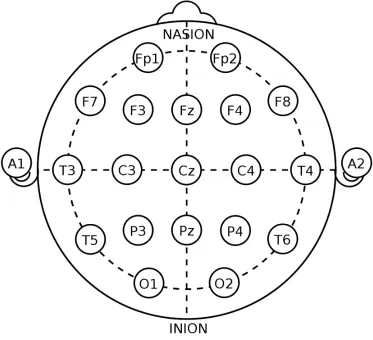
10. 10 -20 System of electrode placement for EEG 50
11. Epoch of stage awake and stage 1 54
12. Epoch of Non-REM SLEEP 55
LIST OF GRAPHS
Graph
no. Title
Page no.
1. Comparison of N1 sleep between study group and control
group 64
2. Comparison of N2 sleep between study group and control
group 64
3. Comparison of N3 sleep between study group and control
group 65
4. Comparison of REM sleep between study group and
control group 65
5. Comparison of N1% between study group and control
group 67
6. Comparison of N2% between study group and control
group 67
7. Comparison of N3% between study group and control
group 68
8. Comparison of REM% between study group and control
group 68
9. Comparison of TST (mins) % between study group and
control group 70
10. Comparison of Sleep efficiency% between study group
and control group 70
11. Comparison of Sleep latency(mins) between study group
and control group 71
12. Comparison of PSQI between study group and control
group 72
13. Comparison of ESS between study group and control
group 72
14. Correlation of HbA1c and sleep pattern in study group 74
15. Correlation of Diabetes duration and sleep pattern in study
ABBREVIATION
S.NO ABBREVIATION EXPANSION
1. AASM American Academy of Sleep Medicine
2. AHI Apnea-Hypopnoea Index
3. BMI Body mass Index
4. CSA Central sleep Apnea
5. DI Desaturation Index
6. ECG Electrocardiogram
7. EEG Electroencephalogram
8. EMG Electromyogram
9. EOG Electro-oculogram
10. LSAT Lowest saturation of oxygen in blood
11. NREM Non rapid eye movement
13. PSG Polysomnography
14. R&K Criteria Rechtschaffen and A.Kales
15. RDI Respiratory disturbance Index
16. REM Rapid eye movement
17. RERA Respiratory effort related Arousal
18. SDB Sleep disordered breathing
19. SWS Slow wave sleep
20. TRT Total recording time
21. TST Total sleep time
22. WASO Wake after sleep onset
23. FBS Fasting Blood sugar
24. PPBS Post Prandial Blood sugar
25. PSQI Pittsburgh sleep quality index
26. ESS Epworth sleepiness scale
CERTIFICATE - II
This is to certify that this dissertation work titled “A STUDY OF SLEEP
PATTERN IN TYPE 2 DIABETES PATIENTS AND ITS CORRELATION
WITH HbA1c” of the candidate Dr .SARAVANAN.V with registration Number
201515002 for the award of M.D in the branch of PHYSIOLOGY . I
personally verified the urkund.com website for the purpose of plagiarism Check.
I found that the uploaded thesis file contains from introduction to conclusion
pages and result shows 2 percentage of plagiarism in the dissertation.
1
INTRODUCTION
Sleep is a state of transient unconsciousness from which the person can be
aroused by sensory or other stimuli (1)
Till the middle of the 20th century, sleep was thought to be a passive
process. It was a common belief that our neurons become inactive and undergo a
dormant phase. But recent studies showed that “during sleep our neurons are
constantly in a firing state”.
The role of sleep in balancing the mental and physical wellbeing of the
individual is just beginning to gain importance as an area of research. Sleep is
under the control of circadian rhythm. But the normal day-night cycle of human
sleep is not seen nowadays. This has lead to the development of sleep medicine as
a separate speciality.
Duration of sleep:
The duration of sleep for an individual depends upon the age, gender,
occupation and various other factors. In general the duration of sleep declines
with age. Children sleep for longer hours in a day. This helps in the regulation of
hormonal secretion and thus the adequate growth of the child is ensured. Also
sleep is necessary for consolidation of memory which is responsible for effective
2
AGE GROUP SLEEP DURATION
Newborns (0–2 months) 12 to 18 hours
Infants (3–11 months) 14 to 15 hours
Toddlers (1–3 years) 12 to 14 hours
Preschoolers (3–5 years) 11 to 13 hours
School-age children (5–10 years) 10 to 11 hours
Adolescents (10–17 years) 8.5 to 9.25 hours
Adults, including elderly 7 to 9 hours
Also the Rapid eye movement (REM ) sleep duration depends on
age-declining as age advances. Apart from age and other characteristics of an
individual, emotions, food habits, daily activities, presence of illness and use of
medications are the factors that decide the pattern and adequacy of sleep so that a
person feels refreshed after waking up.
Sleep pattern may be disrupted by chronic illness and disrupted sleep
pattern may also lead to the development of chronic illness.
Sleep Physiology :
The total duration of sleep could be broadly divided into two phases based
on the electrophysiological parameters. They are REM and Non-Rapid eye
movement (NREM) sleep. This can be recorded by a instrument called
Polysomnogram. Polysomnogram is a instrument used to record biophysical
3
The polysomnographic recordings vary in these two phases. These
variations are cyclical that repeats every 90 minutes. Thus in a normal 6 to 8
hours sleep there occurs about four cycles.
SLEEP CYCLE :
Sleep cycle begins with NREM sleep, passes through four stages and ends
with REM sleep. NREM sleep is otherwise called slow wave sleep and occurs in
four stages 1 to 4. This cycle gets repeated every 70 to 90 minutes. The proportion
of time taken for each stage varies according to age. The pattern of sleep is also
characteristic for each individual. There also occurs brief periods of awakening of
[image:16.612.129.504.383.585.2]which the person is not aware (called stage W).
4
Usually in the early part of night, deep slow wave sleep predominates. The
first REM sleep may occur nearly after one hour of sleep onset. This interval
becomes progressively shorter in the later part of night. Generally, about 25% of
the total sleep period is occupied by REM sleep. As age advances the duration of
REM and stage 4 sleep decreases. Newborns and infants spend about 50% of their
sleep time in REM sleep.
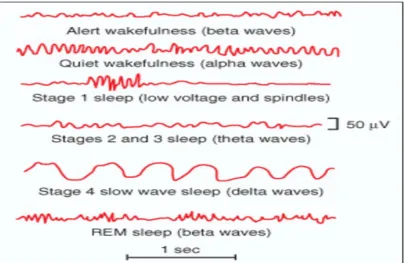
EEG pattern during sleep:
In 1953, Aserinsky, Dement and Kleitman described the phases of normal
sleep based on the EEG recordings. The normal recordings of EEG in different
stages of sleep are as follows.
Stage of sleep EEG findings
Wakefulness β-waves : 14-30 Hz
Stage 1 Alpha rhythm
Stage 2 Sleep spindles and K-complexes
Stage 3& 4 Delta waves (slow wave sleep)
REM High frequency, low amplitude waves,PGO spikes
Stage 2 sleep is considered to be the deep sleep. Delta waves are found to
5
Figure 2 EEG pattern during sleep
NREM sleep :
EEG changes differ in the four stages of NREM sleep according to the
depth of consciousness which increases as sleep progresses from stage 1 to 4.
Progressively the EEG waves become slower in frequency and higher in voltage.
But the thinking in NREM could not be recollected as it is very short and
rudimentary. Tone of the muscles is preserved and DTR could be elicited. EMG
activity could be recorded in chin and limbs.
Autonomic activities in NREM sleep are widely decreased, with
6
of hormones like Growth Hormone, Cortisol and Prolactin occurs. Also changes
like increase in serotonin secretion is noted
Thus the early periods of sleep is predominantly NREM and later period
shows a REM pattern with dream filled sleep which is comparatively lighter.
REM sleep:
This phase of sleep is characterized by rapid movement of eye ball and
profound atonia of limbs sparing the respiratory muscles. About 50% of our total
sleep is occupied by stage 2 sleep. Among the remaining half of the sleep duration
about 20% is REM sleep and other stages constitute 30%. But in infants about
half the duration is REM sleep. Recently it was proved that EEG findings in REM
sleep are due to activation of proceruleus area in pons and atonia is due to
activation of sublaterodorsal area.(Lu et al, 2006). These areas are called “REM
on” areas and the ventrolateral Periaqueductal gray (PAG) and lateral pontine
tegmentum are the “REM off” areas. These two areas mutually inhibit each other
and act as a flip-flop switch which controls smooth transition between REM and
NREM sleep. This switch is influenced by the balance between cholinergic
neurons on the on-side and Noradrenergic and serotonergic neurons on the
off-side of the REM sleep.
EEG shows more active pattern than NREM. Ocular movement artifacts
are commonly seen. EMG record shows a flaccid pattern. But other activities of
7
Sleep Latencies:
“Sleep latency is the time interval from the time of retiring to the time at
which the person falls asleep”. Normal sleep latency is about 10-20 minutes in an
otherwise healthy person. “ the interval from falling asleep to occurrence of the
first REM sleep in a sleeping individual is REM latency”. It may take about
90-120 minutes within one cycle.
Disorders like presenile dementia, sleep apnea affect these two latencies or
any one of them. Study of sleep latency gives a clue to diagnose those disorders.
DIABETES MELLITUS:
Diabetes is the most commonly occurring non-communicable disease in
the world.it is one of the oldest diseases known to mankind. though the essential
feature of diabetes is hyperglycemia, the causes are multifactorial and the disease
affects almost all the organ systems in the body. So it is actually a syndrome
resulting from interactions between genetic, environmental and behavioural
factors.
EPIDEMIOLOGY:
The WHO fact sheet for diabetes in the year 2014 states that around 422
million people are affected with diabetes. The global prevalence has increased
from 4.7% in 1980 to 8.5% in 2014. WHO predicts that Diabetes will be the 7th
8
INDIAN STATISTICS:
India topped the world with 31.7 million diabetics in the year 2000. It is
estimated that by 2030 the number of diabetics in India will become 79.4 million.
The etiology of diabetes in India is again multifactorial with increasing obesity
being the main cause. The rapid urbarnisation with lifestyle changes in the past
few decades have contributed for the escalating rates of occurrence of diabetes in
India. Also obtaining a uniform statistics is difficult due to wide variations in the
diet and cultural practices across the country.(3)
CLASSIFICATION OF DIABETES:
Diabetes is broadly classified as Type 1 and Type 2 diabetes. This
classification is based on the pathophysiology that leads to hyperglycemia.
Accordingly the etiological classification of diabetes is as follows. (4)
I.Type 1 diabetes (βcell destruction, usually leading to absolute insulin deficiency)
A. Immune mediated B. Idiopathic
II. Type 2 diabetes (may range from predominantly insulin resistance with relative insulin deficiency to a predominantly secretory defect with insulin resistance)
III. Other specific types
A. Genetic defects of βcell function
B. Genetic defects in insulin action C. Diseases of the exocrine pancreas D. Endocrinopathies
E. Drug or chemical induced F. Infections
G. Uncommon forms of immune-mediated diabetes
H. Other genetic syndromes sometimes associated with diabetes
9
TYPE 1 DIABETES MELLITUS: (Insulin dependent diabetes mellitus)
Type 1 diabetes is characterized by hyperglycemia produced due to
complex disease process that mostly occurs after sudden onset of an auto immune
process owing to genetic and environmental factors.The pancreatic β cells of the
islets of langerhans are destroyed during this process resulting in insufficient
insulin production .Administration of exogenous insulin remains the main stay of
treatment.
TYPE 2 DIABETES MELLITUS:
Previously known as non-insulin dependent diabetes or adult onset
diabetes. Individuals with this disorder have predominantly insulin resistance with
relative insulin deficiency. This accounts for about 90-95% of the diabetic
population in the world.
The stage before the development of overt diabetes is called impaired
glucose tolerance or prediabetes.The current diagnostic criteria for diagnosis of
Type 2 Diabetes mellitus is as follows. (5)
1. Casual plasma glucose ≥ 200 mg/dl plus classical symptoms.
or
2. Fasting plasma glucose (FPG) ≥ 126 mg/dl
or
3. 2- hr Plasma glucose ≥ 200 mg/dl on 75-gm oral glucose tolerance test or
10
RISK FACTORS:
Type 2 DM is a result of interplay between genetic and metabolic
factors.Ethinicity, family history of diabetes, unhealthy diet, physical inactivity
smoking and previous gestational diabetes increase the risk.
Family history of diabetes (i.e., parent or sibling with type 2 diabetes)
Obesity (BMI 25 kg/m2)
Physical inactivity
Race/ethnicity (e.g., African American, Latino, Native American, Asian American, Pacific Islander)
Previously identified with IFG, IGT, or an A1C of 5.7–6.4%
History of GDM or delivery of baby >4 kg (9 lb)
Hypertension (blood pressure 140/90 mmHg)
HDL cholesterol level <35 mg/dL (0.90 mmol/L) and/or a triglyceride level >250 mg/dL (2.82 mmol/L)
Polycystic ovary syndrome or acanthosis nigricans
History of cardiovascular disease
Of all the above risk factors Obesity is the often an associated feature or
the affected individuals atleast have increased percentage of body fat mainly
deposited around the abdomen. Obesity related complications are frequently
11
comorbidities like hypertension, obstructive sleep apnea etc. and also are more
likely to develop metabolic syndrome.
Obstructive sleep apnea(OSA) is frequently associated with obesity and as
obesity is a risk factor for diabetes, persons suffering from OSA tend to develop
diabetes mellitus.
COMPLICATIONS OF DIABETES:
Diabetic ketoacidosis and Non-ketotic Hyperosmolar coma are the acute
complications of Type 1 and Type 2 DM respectively. These two conditions are
treated as emergencies in diabetes.
Since the basic pathology is Hyperglycemia Diabetes Mellitus has impact
on almost all organs and systems of the body.the incidence of complications
increase with chronicity of the disease. Sometimes the complications may be the
presenting feature that leads to a diagnosis of diabetes.
Complications can be considered in two broad groups – vascular and
non-vascular compilcations. Vascular complications may be due to micronon-vascular
events or macrovascular events. The commonest chronic complications of
12
Microvascular
1. Eye disease
Retinopathy (nonproliferative / proliferative)
Macular edema
2. Neuropathy
Sensory and motor (mono- and polyneuropathy)
Autonomic
3. Nephropathy
Macrovascular
1. Coronary heart disease
2. Peripheral arterial disease
3. Cerebrovascular disease
Other
1. Gastrointestinal (gastroparesis, diarrhea)
2. Genitourinary (Infections/sexual dysfunction)
3. Dermatologic
4. Infectious
5. Cataracts
6. Glaucoma
7. Periodontal disease
13
Glycated Hemoglobin:(6)
These are minor variant of adult hemoglobin (HbA) to which glucose is
attached to the N-terminal valine residue of the β-chain. By chromatographic
techniques this group of molecules can be seperated into HbA1a(1.6%),
HbA1b(0.8%) and HbA1c(3-6%). Since the concentration of HbA1c forms the
major share, measurement of this fraction is considered as the total measure of
glycated hemoglobin.
Conversion of HbA to HbA1c is possible throughout the lifespan of RBC.
So its concentration is higher in older RBCs and the rate of conversion is greater
in diabetics as the plasma glucose levels are higher. So measurement of HbA1c
can be used to diagnose DM.
Also the life span of HbA1c is longer and so the levels of glycated
hemoglobin reflect the blood sugar levels over a period of 12 weeks. Thus
HbA1c measurement is a good parameter to assess diabetic control over the
previous 4-6 weeks. And these measurements correlate with the complications of
14
Methods to study normal sleep:
Sleep could be either studied by clinical observation or by recording the
physiological information using the instruments.
The instrumental recording of the physiological changes during sleep could
be done by recording a polysomnography.
Polysomnography as a term was coined in 1974 by Holland, Dement and
Raynall as this method employs recording of of Electro encephalogram (EEG),
Electro oculogram (EOG),Electromyogram (EMG), Electrocardiogram (EKG),
vital signs and breathing parameters.
Polysomnography is actually a technique of comprehensive recording of
biophysiological changes during sleep along with the analysis and interpretation
of results. Standardised scoring manual are available with universally uniform
terminology and specifications. A.Rechtschaffen and A.Kales in 1968 were the
first persons to bring out a manual for sleep study and its interpretation (popularly
known as R & K criteria).(8)
American Academy of Sleep Medicine (AASM) incorporated
15
The AASM terminologies are as follows. 1. N denotes NREM sleep
2. R denotes REM sleep
3. N1 and N2 are stage 1 and stage 2 4. N3 is sum of stage 3 and stage 4
5. The post auricular placement of electrodes are called M1 and M2 instead of A1 and A2.
Clinical polysomnography classically records the EEG during sleep with
the help of the electrodes placed on the scalp according to the standardized
international 10-20 system.(10)
In addition to this others parameters that are recorded are
1. EMG in the anterior tibialis muscle
2. Plethysmography to record respiratory effort
3. Nasal and oral airflow
4. Pulseoximetry to measure oxygen saturation
5. EOG to record the eye movements
6. Audiovisual means are used to record the gross body movements
7. ECG
Recording is done in a thermal paper like ECG. This paper length is
divided into segments of time for convenient reporting. Each segment is called an
EPOCH. The paper speed for recording is 10 mm/s and a 30 cm page represents
30 secs recording. This forms an epoch. Even after digitalization of the
16
Recording system includes :
Quality amplifier
Filter design and configuration
Independent filter selections for each channel
Adequate sampling rates and bit resolution for each recorded parameter
Input signal referencing capabilities
Provisions for standard calibration procedures and signal verification
Appropriate signal display
Analog type instrument or a digital instrument can be used for recording.
The digital recorders need computers for data analysis. Advantage of digital
instruments is that data could be store for future retrival. A typical device may PREREQUISITES FOR CONDUCTING POLYSOMNOGRAPHY
Air conditioned room with attached bathroom
Polysomnographic recording system
Computer
Amplifiers
Electrodes and application material
Pulse oximeter-to detect blood gas analysis
Abdominal and thoracic belts-to detect respiratory effort
Nasal airway pressure transducer- to detect nasal airflow
17
store upto 50 megabytes of data for an 8 hour recording. This data could be
downloaded to a computer and analysed using appropriate software.
Sources of signal
Three signalsources in polysomnography are:
1. Bio electric potentials like EEG, EOG, EMG, ECG
2. Trasnduced signals from the sensors attached to the patient like
plethysmography, body position sensors etc.
3. Ancillary equipment signals like pulseoximeter.
All the above mentioned instruments are provided with their own processor
circuits, display and output.
Amplifiers :
A direct amplifier records slowly changing potentials as from a pulse
oximeter. The alternating current amplifier records high frequency potentials as
from the EEG, EOG etc. A differential amplifier amplifies the difference between
electrode inputs instead of the absolute voltage at any electrode. The
contamination from the electrical noise is prevented by subtracting it out. This
ability of the amplifier to suppress an unwanted signal is called common
moderejection.
FILTERS:
Use of filters helps to remove the unwanted signals that escape the
18
Filters are of different types:
High frequency filter (HFF)- attenuates the higher frequency amplitude
signals above the cut off value and thus determines the highest frequency
that a channel would display.
Low frequency filter (LFF)-attenuates the lower frequency signals below
the cut off value and thus determines the lowest frequency that a channel
would display.
Notch filter – eliminates 50 or 60 Hz frequency interference from amplifier
output.
Digital filter –deltes selected frequencies after digital conversion of the
amplified signals using software algorithms.
DIGITAL SPECIFICATION FOR ROUTINE
POLYSOMNOGRAPHY (AASM GUIDELINES)
Electrode Desirable sample rate(Hz) Minimal sampling rate (Hz) High frequency filter (Hz) Low frequency filter (Hz) Maximum impedance (K Ohms)
EEG 500 200 35 0.3 5
EOG 500 200 35 0.3 5
EMG 500 200 100 10
EKG 500 200 70 0.3
Snoring 500 200 100 10
Airflow 100 25
Oximetry 25 10
Chest and abdominal movement
100 25
Body position
1
19
MEASUREMENT OF SIGNALS:
Signals recorded are measured according to
1. Frequency- the number of waves appearing per second that is cycles per
second or Hertz
2. Amplitude – Amplitude is the measure of the electrical voltage. Vertical
height of a wave represents the amplitude.
This independent on the sensitivity setting of the amplifier .Sensitivity is
the voltage needed to produce a set deflection of the pen. It is inversely
[image:32.612.203.426.362.669.2]proportional to the amplitude.
20
Thus the actual process by which the electrical signals from the patient are
21
REVIEW OF LITERATURE
Sleep – a necessity for survival.
“Why animals and humans sleep?” is a still unanswered question. However
our performance during wakefulness, physical and mental health is highly
dependent on the quality of our sleep. Brain development may be related to the
sleep pattern. This may be explained by longer duration of deep sleep among
infants.(11)
Functions of sleep:
Again the functions of sleep is also a query for which the answers are being
still formulated. But all animal species sleep and so sleep can be regarded as rest
period for the organ systems that were continuously working during wakefukness.
Cessation or reduction of the metabolic activity during sleep serves this purpose.
The brain is the most benefitted organ during sleep. This particular organ
replenishes its energy stores during sleep.so the most important function of sleep
is brain restitution. Sleep plays a role in learning and consolidation of memory.(1)
Physiological changes during sleep:
During sleep the physiological activities of the organ systems vary from
that of during wakefulness. There is increased parasympathetic tone with reduced
sympathetic activity. As a result the heart rate, blood pressure and respiratory rate
are lower during sleep. Due to muscle relaxation the upper airway resistance
22
especially during slow wave sleep. Sleep also has a important role in regulation of
hormone secretion.(12)
Sleep deprivation:
The condition when an individual does not get adequate sleep is called
sleep deprivation.this may be due to organic sleep disorders per se or may be a
behavioural disorder.
When an individual does not go bed according to their biological clock and
continue to be in the wakeful state than for an expected duration it is called total
sleep deprivation. This will be usually followed by compensatory sleep that
restores the normal sleep cycle.
Partial sleep deprivation is when an individual goes to bed but the quality
and quantity of sleep is not optimum. This partial deprivation of sleep can occur
in three ways. One is fragmentation of sleep (eg. Obstructive sleep apnea). This
condition is characterised by disrupted progression in the sequence of stages of
sleep. Second type of partial sleep deprivation is loss of specific stages of sleep
and can be denoted as selective sleep deprivation. Third type sleep restriction
which is typically reduced duration of sleep.(13,14)
Effects of sleep deprivation:
Brain is the primary organ that is highly dependent on sleep for its normal
23
chronic sleep deprivation is cognitive impairment. Apart from this sleep
deprivation also causes mood changes and neuroendocrine changes.(15)
As a result of these changes the metabolic processes of the body are also
altered when the individual suffers sleep deprivation particularly of the partial
type. Many physiological indices are altered due to short term sleep restriction.
Some of them are increase in BP, (16) sympathetic nervous system activation(17),
decreased levels of leptin(18), high production of inflammatory markers.(19)
Numerous endocrine metabolic changes are also seen after sleep
deprivation or sleep restriction. Some of these effects are increase in serum
cortisol levels in an evening sample, decreased thyrotropin activity and above all
the most important is the impaired glucose tolerance. (20)
This impaired glucose tolerance is the preliminary stage of diabetes mellitus.
SLEEP and DIABETES:
Behavioural sleep restriction has become a necessity nowadays due to
globalization, lifestyle changes and work pattern modifications.Currently there are
authenticated evidences that behavioural sleep restriction has increased the
incidence of obesity and diabetes. Three mechanisms are proposed for the
development of obesity and diabetes in sleep deprived individuals. 1. alterations
in glucose metabolism; 2. upregulation of appetite; 3. decreased energy
24
Sleep and Glucose metabolism:
As the overall metabolic rate decreases during sleep so does the glucose
metabolism. In the first half of night the metabolism of glucose is slower due to
predominance of slow wave sleep which is associated with lowered cerebral
glucose uptake and reduced peripheral glucose utilisation. These effects are
reveresed in the second half of the night which is characterised by increase in
frequency of REM sleep.(22,23)
Glucose tolerance is the ability of the body to secrete insulin according to
the plasma glucose levels so as to activate the glucose metabolism and return
blood glucose to normoglycemic levels. this is highly dependent upon the
pancreatic beta cell function to secrete required quantities of insulin and the
ability of the insulin to adequately metabolise the blood glucose. Reduced Insulin
sensitivity or insulin resistance is a condition which denotes the requirement of
larger amount of insulin to bring back the normoglycemic states when there is
altered levels of blood glucose. This glucose tolerance is at its minimum during
the night than in the morning and so insulin resistance is higher in the night. (24)
Sleep and appetite:
Food intake is normally regulated by two different neuronal areas in
hypothalamus – the appetite stimulating and appetite suppressing areas. These two
areas are influenced by two peripheral signals the leptin and ghrelin. Leptin
promotes satiety and decreases food intake while ghrelin induces hunger and
25
During normal conditions there is a nocturnal rise of plasma leptin and
ghrelin levels . the ghrelin levels come down in the later part of night and so the
appetite is suppressed during normal sleep. Sleep deprivation in rodents have
resulted in hyperphagia.
This is because of the action of another hormonal substance called orexin.
Orexin acts upon the lateral hypothalamus and stimulates the secretion of
neuropeptide Y which increases the food intake. Orexin also influences certain
neuronal areas that maintain wakefulness. Thus by maintaining wakefulness
orexin promotes eating behavior also.(28)
There is evidence of irregular eating habits, in between meal snacking,
execessive seasoning of food and less intake of vegetables associated with sleep
deprivation.(29)
A previous study conducted on 12 healthy volunteers with 2 days of sleep
restriction and 2 days of sleep extension under controlled intake of calories and
physical activity showed significant increase in hunger and food intake especially
of high calorie value with significant increase in ghrelin levels and decrease in
leptin levels. (30)
One another study examined the changes in energy intake and energy
expenditure along with leptin and ghrelin levels with respect to normal and
restricted sleep duration. Eleven healthy volunteers participated in this study in an
26
EEG, EOG and EMG. The results showed significant increase in consumption of
snacks and carbohydrate rich food during restriction of sleeping hours with no
significant changes in serum leptin and ghrelin levels (31). Thus sleep deprivation
causes increase in energy intake and decrease in energy expenditure which may
lead to obesity – an important predisposing factor for diabetes.
Sleep and energy expenditure:
Energy expenditure plays a major role in controlling increase in body
weight and development of obesity. Total energy expenditure (TEE) of the body
depends upon the resting basal metabolic rate(RMR), thermogenic effect of meals
(TEM) and activity related energy expenditure(AEE). In most persons this AEE is
determined by the non-exercise activity thermogenesis (NEAT) which is the
energy loss during normal physical activities ike sitting, standing, walking etc.(32)
Weight loss and prevention of obesity depends upon the AEE and NEAT. Obese
individuals have lower levels of NEAT than non obese individuals.(33) Subjects
with sleep disorders both organic and behavioural report execessive daytime
sleepiness and reduced physical activity which in turn would reduce the AEE.
Thus contributing to increase in weight gain.(34)
All the above discussions point that sleep deprivation through various
27
Fig 4 Mechanism of Sleep deprivation for Diabetes
Sleep disorders and diabetes:
So far we have discussed about the effect of behavioural sleep restriction
on diabetes.also organic sleep disorders may also lead to the development of
diabetes. The sleep disorders are classsified into seven broad categories according
to the international classification of sleep disorders (ICSD 3) (35) As follows.
1. insomnia disorders
2. sleep-related breathing disorders
3. central disorders of hypersomnolence
28
5. sleep-related movement disorders
6. parasomnias
7. other sleep disorders.
These sleep disorders when not adequately treated,through various
mechanisms lead to the development of diabetes as outlined in the following
figure.
Figure 5 Mechanism of Sleep depreviation causes Glucose intolerance
When the effects of sleep deprivation on HPA axis were studied in three
groups of subjects- one with normal sleep, second with partial sleep deprivation
and the third with total sleep deprivation the cortisol levels were measured during
the evening following sleep deprivation were higher in both the sleep deprived
29
sleepers there is no such increase.(36) this sleep deprivation induced HPA axis
hyperactivity is involved in metabolic consequences like obesity, diabetes etc.(37)
The circadian rhythmicity also plays a great role in metabolic processes
particularly glucose homeostasis. Nutrition has been identified as a potential
zeitgeber(38). In animal models melatonin and melatonin receptor agonist
administration influence the glucose homeostasis in various ways like increase in
glucose uptake by the tissues, increase in glucose induced insulin secretion, better
insulin sensitivity and lower rates of gluconeogenesis (39).
Also melatonin increase glycogen synthesis in liver(40), limits fat
accumulation and adiposity in humans(41), thus preventing obesity. So distruption
of the circadian rhythm due to various conditions like shift work, repeated travel
across time zones may result in metabolic derangements in glucose homeostasis.
Both cross-sectional and retrospective studies on shift workers show an increased
incidence of type 2 diabetes mellitus(42), glucose intolerance(43), insulin
resistance(44) and metabolic syndrome (45).
Obstructive Sleep Apnoea (OSA)is a common sleep disorder which is
increasing in prevalance with the increase in obesity. (46)
OSA is characterised by intermittent hypoxia and frequent arousals thus
causing disrupted sleep pattern. OSA being an independent risk factor for
cardiovascular disease is also implicated as a causative factor in various metabolic
derangements like dyslipidemia, insulin resistance, glucose intolerance and type 2
30
cause for these metabolic derangements evidenced by presence of insulin
resistance even in non- obese OSA patients. (49)
As outlined in the figure below intermittent hypoxia acts on different
insulin sensitive tissues and organs by various mechanisms and leads to
[image:44.612.164.460.224.522.2]development of diabetes.(50)
Figure 6 Mechanism of intermittent hypoxia causes insulin resistance
Intermittent hypoxia causes sympathetic activation and thus elevated levels
of circulating of catecholamines.(51,52). The epinephrine released during
sympathetic activation causes a trigger in glucose production and impairment in
31
Another hallmark finding in OSA is sleep fragmentation, a condition where
total sleep duration is not altered but there is discontinous sleep with altered
architecture. Experimental studies inducing sleep fragmentation with auditory and
mechanical stimuli showed a decrease in insulin sensitivity which is not
compensated by increase in insulin secretion suggesting that sleep fragmentation
alters glucose homeostasis(54,55). Also as evidenced by wrist actigraphy the type 2
diabetes patients manifest sleep fragmentation.(56) the actigraphy performed on
diabetics showing sleep fragmentation is associated with higher fasting blood
glucose when compared with non diabetics.(57)
Sleep and glycemic control:
There are evidences to show that sleep deprivation may cause increased
risk for developing diabetes. Sleep deprivation also causes some adverse changes
in existing diabetic status. A survey study done on 161 type 2 diabetes patients
concluded with a predicted increase of HbA1c for a 3 hour sleep debt per night as
1.1% above the median and 1.9% above the median for a 5 point increase in
Pittsburgh sleep quality index ( PSQI )scores.(49)
A previous study conducted on 118 subjects with type 2 diabetes found that
sleep duration and segments of short naps significantly predicted the HbA1c
levels. There was a reduction of HbA1c by 0.174% with an increase in duration of
sleep by onehour. So authors have concluded that increasing the duration of sleep
32
In another study conducted on geriatric diabetic patients the was a
relationship between sleep quality and glycemic control when the reference value
of HbA1c was fixed at 7% there was approximately a four fold increase in HbA1c
levels when there was an increase in Epworth sleepiness scale (ESS) scores.(51)
A cross sectional study conducted on 1022 japanese healthy adults in the
age group of 22-69 yrs. showed a significant positive linear correlation of high
HbA1c with insomnia symptoms like difficulty in maintaining sleep and early
morning awakening.(52)
In one another previous study 46 type 2 diabetes patients were investigated
for glycemic control with HbA1c and quality of sleep assessed using PSQI. After
adjusting for age, gender and BMI the PSQI scores significantly correlated with
HbA1c in the positive direction. (53)
Quality of life in diabetic patients was assessed with quality of life index
questionnaire and quality of sleep using PSQI. Quality of life in diabetics was
dependent upon the quality of sleep. In turn the sleep duration positively
correlated to HbA1c levels and fasting blood glucose. HbA1c negatively
correlated with PSQI scores suggesting that lower HbA1c is associated with good
sleep quality.(54)
Evidences are present for elevated HbA1c in diabetic patients engaged in
shift work and the insufficient glycemic control was linked to the duration of
33
In a previous study of polysomnography on 60 type 2 diabetes patients
about 77% of them had OSA and the severity of OSA was significantly
associated with poor glycemic control as evidenced by increased levels of
HbA1c.(56)
How diabetes affects sleep:
Sleep and diabetes has a bidirectional relationship. Poor sleep quality leads
to diabetes and presence of a diabetic state leads to poor quality of sleep. The
proposed mechanisms for poor sleep quality in diabetes can be summarized in the
[image:47.612.188.440.364.603.2]following figure.
34
Nocturia is waking up in the night to void.Nocturia causes sleep
disturbance by frequent awakening thus affecting both onset and maintenance of
sleep (57). Polyuria a feature of diabetes can lead to nocturia through distension of
bladder beyond its capacity or through solute diuresis. Another mechanism
involved is diabetic patients with associated OSA is the stretching of myocardium
due to the negative intrathoracic pressure resulting in release of Atrial Natriuretic
Peptide that causes excess sodium and water excretion (58). In a previous study
done on 74 type 2 DM patients nocturia was found to be associated with sleep
maintenance difficulties thus reflecting poor quality of sleep (59).
Another cause for sleep disturbance in diabetes may be nocturnal
hypoglycemia. This is more consistent with type 1 diabetes where hypoglycemic
episodes are frequent. Studies have shown that most of the hypoglycemic episodes
occur at night (60).
Restless Leg Syndrome (RLS) is a sensorimotor disorder characterised by
an irresistible urge to move the legs that is aggravated by rest and relieved by
movement, the symptoms classically worsen at night (61). Evidences show that
there is increased risk of RLS in diabetic patients (62). Type 2 DM patients with
co-morbid RLS report poor sleep quality and efficiency characterised by
prolonged sleep latency resulting in more daytime dysfunction than diabetics
35
Obstructive sleep apnea (OSA) is one of the sleep disordered breathing.
This leades to apneic episodes causing intermittent hypoxia, frequent arousals
causing sleep fragmentation, reduction in Total Sleep Time (TST) causing
daytime sleepiness.(64) the intermittent hypoxia in OSA patients has been
investigated as a chief cause of insulin resistance through increase in sympathetic
activation and serum cortisol levels.(65)
In a polysomnographic study conducted on 306 type 2 diabetes patients
about 86% of the participants had OSA with approximately 22% had severe OSA
and 30% had moderate OSA(66).
Another study on diabetic patients with poor glycemic control with HbA1c
≥ 7% revealed a prevalence of 37.2% for OSA among this group(67)
Diabetic patients both type 1 and type 2 have increased risk of
cardiovascular problems particularly congestive cardiac failure(68,69). These
diabetic patients with co morbid heart disease also have disturbed sleep due to
various reasons like dyspnea,orthopnea, paroxysmal nocturnal dyspnea,OSA,
pain, medication effects etc(70).
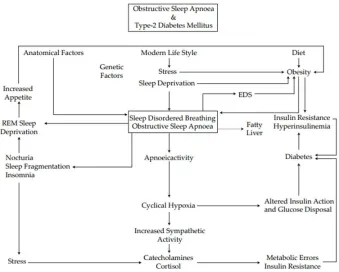
A review article published in 2012 states that there is a close relation
between sleep, aging and meatbolic syndrome. Diabetes being one of the
components of metabolic syndrome is closely associated with sleep disorders and
36
control in existing diabetes. The relation between diabetes and sleep could be
[image:50.612.144.483.137.409.2]expalined by the following flow chart(71).
37
AIM AND OBJECTIVE OF THE STUDY
The primary aim of the study is to investigate the sleep pattern in type2
diabetes mellitus patients in relation to their HbA1c.
OBJECTIVES :
1. To assess the polysomnographic parameters in type 2 diabetes mellitus
patients
2. To assess the sleep pattern relation with HbA1c level.
3. To assess the sleep pattern relation with duration of Type 2 diabetes
mellitus.
4. To assess subjective daytime sleepiness using Epworth Sleepiness Scale in
type 2 diabetes mellitus patients
5. To assess the quality of sleep using Pittsburgh Sleep Quality Index in type
38
MATERIALS AND METHODS
The place of the study was the Institute of Physiology and Experimental
Medicine, Madras Medical College. The study duration was May 2016-April
2017. Approval to conduct the study was obtained from the Institutional Ethics
Committee (IEC), Madras Medical College, Chennai.
Subjects for the study group were recruited from the Institute of
Diabetology, RGGGH, Chennai.
Subject selection:
Study population consists of 30 patients of both genders in the age group
of 40-60yrs diagnosed with and undergoing treatment for Type 2 diabetes
mellitus.
Thirty subjects matched for age and gender with normal blood sugar levels
and HbA1c levels were taken as controls.
Inclusion criteria:
Patients diagnosed with and on treatment for Type 2 Diabetes of any
duration, both men and women in the age group of 40 – 60 years were included in
39
Exclusion criteria:
Subjects with the following conditions were excluded from the study.
Type 1 diabetes mellitus
Patients regularly taking sleep medications
Psychiatric illness
Obstructive sleep disorder
Pregnancy and post-partum period
Patients with secondary infections
Neoplastic, hepatic, respiratory and any cardiovascular disorders
Other concurrent medical illness like renal failure, cardiac failure etc.
Subjects taking medications that influence sleep pattern
According to the above inclusion and exclusion criteria subjects were
recruited for the study after obtaining informed consent both in the verbal and
written form.
Study design: Cross sectional study
Methodology :
After obtaining informed consent, the participants of the study were
subjected to the following investigations.
Blood glucose levels- fasting and postprandial with Glycated Hemoglobin.
40
Sample collection
Under universal precautions 5 ml of venous blood sample was taken in the
fasting state.
The sample is centrifuged at 3000 rpm for 10 secs and serum separated and
stored in the deep freezer at -20°C. The samples were sent to the central
laboratory at RGGGH under the Institute of Biochemistry and analysed for FBS,
and HbA1c.
After 2 hours post prandial sample was also collected in the same manner for
estimation of PPBS.
41
Estimation of FBS and PPBS
FBS and PPBS was measured in the unhemolytic serum samples by
Trinder’s method using the principle of oxidation of glucose to gluconic acid and
hydrogen peroxide. A peroxidase enzyme generates a coloured quinonemine
complex whose absorbance is proportional to the concentration of glucose in the
sample.
The values were analysed according to the diagnostic criteria.
Subjects with FBS < 126 mg/dl and PPBS<200 mg/dl were considered as
non- diabetics.
Those with FBS>126 mg/dl and PPBS> 200 mg/dl were included in the
study group.
Estimation of HbA1c
Glycated hemoglobin was measured in a whole blood sample by particle
enhanced immuno turbidimetric method using mouse and goat IgG monoclonal
antibody. In this method HbA1c can be measured without measuring the total
hemoglobin.
Values were interpreted as follows.
Subjects with <6.5% were included in the non diabetic group.
42
Storage of HbA1c samples
Polysomnography
Digital polysomnography was done for the consented persons using the
MEDICAID SC32 in the human experiments laboratory of Institute of
Physiology and Experimental medicine. A battery of noninvasive tests were done
and the parameters measured are
Electroencephalogram (C4/A1, C3/A2)
Electro-oculograms (right & left)
Submental and leg myogram
Electrocardiogram
Thoracic and abdominal movements
Oxyhemoglobin saturation
Nasal airflow
43
Sleep efficiency (percent of time in bed spent asleep;SE)
Sleep latency (time from lights out to the ®rst epoch of any stage of sleep)
Percent of total sleep time of stages 1, 2, 3 and 4, REM sleep
Slow wave sleep (SWS)
Prior to the procedure participant was given a detailed information about
the purpose and procedure of polysomnography. He/she was made aware that they
will be monitored throughout their sleep and educated about when and how to
contact the technologist.
A complete medical history including a detailed sleep history was recorded
and a comprehensive clinical examination was done to record the basic vital
parameters.
A convenient date was fixed for recording.
Then the participant was given the following set of instructions to be
followed on the day of reporting.
To have an evening bath and a clean facial shave.
avoid applying oil to any part of the body
To dine at least an hour before the procedure
avoid alcohol on the day of procedure
44
Report with their routine sleep wear
Remove all ornaments
To bring all previous medical reports
Report at the appointed time
Patient tray was kept ready with the following things.
EEG paste
Measuring tape
Cotton swabs
Electrodes, sensors, and lead wires
Spirit
Micropore
Gloves
45
Polysomnogram with Head box
Procedure:
The procedure starts with Patient Hookup. It is nothing but the systematic
placing of various surface electrodes and sensors on the patient’s body.
Electroencephalogram:
EEG is the recording of the electrical activity of neurons using surface
electrodes. The pyramidal cells of the cerebral cortex generate EPSP and IPSP.
46
conductivity. It is noninvasive and the high temporal resolution enables even
subtle changes of few milliseconds to be effectively detected. But due to low
spatial resolution it requires a large group of neurons to discharge synchronously.
Artifacts like movements of eye, head and muscle, electrical signals from
surroundings could contaminate the EEG record and this should be eliminated
while making the interpretation. EEG recording is done using eight electrodes-six
“ exploring ” and two “reference” electrodes. The amplitude of the wave forms is
dependent on the distance between the two recording electrodes. In order to
maximize the inter electrode distance C3 or C4 electrodes used as reference
electrode in relation to the opposite mastoid. Always recording is done through
two channels so that one can be used as a backup record.
The electrodes used are cup electrodes plated with gold or silver chloride.
According to the R & K criteria the electrode sites are
Two mastoid/aural (A1, A2)
Two central (C3, C4)
47
Ideal electrical settings are
Electrode impedance Less than 500 ohms
Standard gain Deflection of 1cm for every 50μv
EEG deviations C4-A1, O2-A1
48
ELECTRODE PLACEMENT
[image:64.612.129.502.138.478.2]Done according to the International 10-20 system
Figure 9 Steps for placement of electrodes
The four landmark locations are-nasion, inion, left preauricular region, and right
preauricular region.
Steps to be followed for placement of electrodes are as below.
1. The distance between nasion and inion is measured.
2. Fpz is marked at 10% of this total distance from nasion.
3. Oz is marked at 10% of this total distance from inion.
49
5. Fpz ,Oz and Cz are along the line joining nasion and inion.
6. Fz is marked at 20% of distance from Cz in the front.
7. Pz is marked at 20% of distance from Cz in the back.
8. Distance between left and right preauricular point was measured (passing
through Cz).
9. C3 is marked at 20% distance from Cz on the left.
10.C4 is marked at 20% distance from Cz on the right.
11.T3 is marked at 10% the interauricular distance from the left mastoid
12.T4 is marked at 10% the interauricular distance from the right mastoid.
13.Head circumference is measured through all the 10% points (50% of which
coincides with Fpz& Oz in the front and back respectively).
14.O1 is 5% of the circumference to the left of Oz.
15.O2 is 5% of the circumference to the right of Oz.
16.Fp1 is 5% of the circumference to the left of Fpz.
17.Fp2 is 5% of the circumference to the right of Fpz.
18.C3 is 50% of the distance from Fp1to O1 on the interauricular line.
19.F3 is 25% of this distance in the front.
20.P3 is 25% of this distance in the back.
21.C4, F4 & P4 are corresponding points in the right.
22.T5 & T6 are 10% distance of circumference from O1 & O2 in the left &
right side respectively.
23.F7 &F8 are 10% distance of circumference from Fp1 & Fp2 in the left &
50
24.A1 and A2 are placed on the left and right mastoid processes.
Electrodes are placed in the above mentioned positions. Conventionally the
alphabets denote the Frontal, occipital, parietal, temporal ,auricular and central
regions.
Odd numbers are used to denote left sided electrodes and even numbers are
used for the right side.
[image:66.612.157.474.262.570.2].
51
Electro oculogram:
Records the potential difference between the retina and cornea.
The electrodes for recording are are placed as follows.
E1-1cm out and below the outer canthus of the left eye.
E2- 1 cm out and above the outer canthus of right eye.
Reference electrode is A2. Electromyogram
Recorded in the chin and leg.
Chin EMG needs two electrodes placed 2 cm below the chin; 2 cm right and left of the midline.
Limb movement is recorded through EMG of anterior tibialis muscle by placing electrodes in the outer aspect of lower half of each leg.
Sensors:
Sensors are used to measure airflow, oxygen saturation and snoring.
Non invasive finger probe is used to record the percentage hemoglobin saturated with oxygen.
Airflow is measured through nasal prongs. A pressure transducer connected to the prongs record the pressure on the prongs created due to
flow of air and thus gives an indirect measure of airflow.
52
The impedance and signals of all electrodes were checked after placing the electrodes and sensors.
Biocalibration of the physiological parameters were done at the beginning and end of the procedure. Steps of calibration are
Close eyes for 30 seconds to reveal α- activity.
Open eyes for 30 seconds to eliminate α- activity.
Subjects were instructed to hold head still in midline and move eyes to right and left to mimic REM sleep.
With head held still in midline ask the subject to move eyes up and down to differentiate horizontal and vertical eye movements.
Holding a deep breath for 5-10 seconds mimics central apnoea. Moving the chest and abdomen in and out while still breath holding mimics obstructive
apneoa.
Movement of feet are also calibrated. Documentation of the procedure
Apart from the recording the observer should document the duration of the
study procedure, methods of calibration, complaints from the patient , other
technical difficulties and measures taken to correct them.
On completion of the recording the data collected should be saved properly
53
Analysis of the data and Scoring
Events to be analysed and scored are
Stages of sleep
Arousal
Cardiac events
Respiratory events
Movements
SCORING BY EPOCHS
The polygraphic record is analysed in segments called epochs. Each epoch
is of 300 mm length and 30 seconds duration.
Each epoch should represent a sleep stage. When more than one stage is
present in an epoch the score is determined according to the stage that occupies
greater portion of the epoch.
SCORING OF SLEEP STAGES
Awake stage
The epoch consists of >50% of α EEG waves over theoccipital region when
eyes closed. If α waves are absent look for one of the following
Eye blinks (0.5-2Hz)
Slow conjugate eye movement followed by a rapid movement in the opposite direction,
54
Figure 11 Epoch of stage awake and stage 1
Stage-I-
More than 50% of the epoch is occupied by low amplitude waves of
frequencies between 4 to 7 Hz .
If α waves were absent in the awake stage the epoch would show Vertex
sharp waves of <0.5 seconds duration maximally over the central region and Slow
rolling eye movement.
Stage II-
The epoch consists of K complexes.
As spindles also accompany the K complexes spindles are pathognomonic
of this stage.
55
Stage III and IV –
[image:71.612.148.470.153.338.2]More than 20%of the epoch shows slow waves of 0.5-2Hz and >75uV amplitude.
Figure 12 Epoch of Non-REM SLEEP
REM
Epoch would be occupied by waves of low amplitude and mixed frequency.
EOG shows rapid eye movement.
EMG records a reduced tone.
[image:71.612.157.476.494.688.2]