Element behaviour in inundated actual acid sulfate soils, East Trinity, Cairns
156
0
0
Full text
(2) 3. GEOCHEMISTRY OF ACID SULFATE SOIL PROFILES 3.1 Introduction A number of authors have demonstrated that seawater inundation of AASS can neutralise soil acidity (e.g. Indraratna et al., 2005; Hicks and Fitzpatrick, 2003; Indraratna et al., 2002; Portnoy and Giblin, 1997a; b), yet none have described the geochemistry of the Inundated AASS (IAASS). A possible reason for the lack of a description is that IAASS was difficult to differentiate from PASS. Identifying IAASS is a critical first step in understanding the geochemical processes occurring during AASS inundation. Identification of IAASS allows for the development of a geochemical description, which can be compared with PASS and AASS to determine differences between the ASS types. Despite its ability to neutralise acidity, the geochemical effects of seawater inundation on AASS remain unclear. IAASS had not previously been described. Therefore, a method was developed to identify IAASS based on the geochemical properties of AASS from the inundated area of East Trinity. It follows that the objectives of this chapter are: 1) to describe the geochemistry of ASS from the Firewood Creek catchment; 2) to identify IAASS as a new ASS type; and 3) to assess the ASS (the combined population of PASS, AASS and IAASS) for element toxicity. The data and interpretations presented in this chapter provide insight into the geochemistry of ASS in the Firewood Creek catchment of East Trinity. Furthermore, a method is provided for the identification of IAASS. This is significant because IAASS has not been previously identified or described. Additionally, element concentrations in the AASS, IAASS and PASS are assessed for potential toxicity.. 3.2 Methods 3.2.1. Sampling. Soil cores were collected from the inundated and non-inundated ASS locations in the Firewood Creek catchment of East Trinity (Figure 2.9). The profile from the inundated ASS location was referred to as the “wet ASS profile” site. The profile from the non-inundated site was referred to as the “dry ASS profile” location. Soil samples were photographed and their colour described using Munsell colour charts (Munsell Color, 2000).. 79.
(3) 3.2.2 3.2.2.1. ASS Analysis Soil pH and Oxidised Soil pH Values. Fourteen samples from the dry ASS profile (DP2 core) and thirteen samples from the wet ASS profile (WP2 core) were examined for soil pH (pHF) and oxidised soil pH (pHFOx) values. The top 1.4 m of both ASS profiles were analysed as 10 cm sections of unprocessed core. Details of method used are provided in Section 2.3. The pHF and pHFOx values are given in Figures 3.1 and 3.2 for the dry and wet ASS profiles respectively. 3.2.2.2. Grainsize Analysis. Unprocessed samples (14 from the DP2 and 13 from the WP2 cores) were analysed for grainsize composition at James Cook University (Townsville). Details of grainsize sample processing and analysis are given in Section 2.4. Grainsize results are presented in cumulative percent by volume of clay, silt, very fine sand, fine sand, medium sand, coarse sand and very coarse sand (Table C.1, Appendix C).. 3.2.2.3. Mineralogical Analysis. Five samples from the dry ASS profile (core DP0) and eight samples from the wet ASS profile (core WP1) were examined for mineralogy using XRD techniques.. Details of the sample. preparation and analysis can be found in Section 2.5. 3.2.2.4. Elemental Analysis. Twenty-one ASS samples were analysed using XRF for elemental composition at the AAC (Townsville). Details of the ASS sample processing for XRF analysis can be found in Section 2.6. Elements determined in the ASS were the alkali metals (Na, K, Rb), alkaline earth metals (Mg, Ca, Sr, Ba), transition metals (Sc, Ti, V, Mn, Fe, Co, Nb, Ni, Cu, Y, Zn, Zr), other metals (Al, Ga, Pb), metalloids (Si, As) and non-metals (P, S). The XRF elemental determination of the samples from the dry ASS profile and the wet ASS profile are given in Tables C.2 and C.3, respectively, of Appendix C). Analytical accuracy of the XRF determination of the ASS was measured by inclusion of an aliquot of the international geochemical reference material TILL-1. The acceptable accuracy threshold was between a Relative Percent Difference (R%D) ± 30 of the SRM standard value for concentrations greater than 5 times the lower detection limit; and between R%D ± 50 of the TILL-1 standard value for concentrations less than 5 times the lower detection limit. No element failed the accuracy assessment (Table B.1 in Appendix B). Standard concentration values for Ga and LOI were not. 80.
(4) provided for the TILL-1 SRM. Therefore, the accuracy of Ga and LOI determinations could not be confirmed in the ASS samples. Gallium and LOI have been included in the ASS dataset, but caution must be exercised with their interpretation due to their accuracy being unconfirmed. Analytical reproducibility of the XRF determination of the ASS samples was measured by inclusion of replicate samples. The acceptable reproducibility threshold was between R%D ± 30 of the replicate mean for values greater than 5 times the lower detection limit; and between R%D ± 50 of the replicate mean for values less than 5 times the lower detection limit. The reproducibility was acceptable for all elements determined (Table B.2 in Appendix B). Chromium was removed from the ASS dataset because of potential contamination during sample milling. Therefore, ASS XRF dataset consisted of Al, As, Ba, Ca, Co, Cu, Fe, Ga, K, LOI, Mg, Mn, Na, Nb, Ni, P, Pb, Rb, S, Sc, Si, Sr, Ti, V, Y, Zn and Zr. 3.2.3. AASS Flushing Experiment. An AASS flushing experiment was conducted to examine the changes in pH of seawater that moved through AASS. Section 2.9 provides details of the AASS flushing experiment.. 3.3 Results 3.3.1. ASS Profile Descriptions. Photographs of the dry and wet ASS profiles show a distinct colour change with depth (Figures 3.1 and 3.2 respectively). The dry ASS profile was reddish-brown (2.5Y 3.5/3) with pale yellow mottles (2.5Y 7/6) and grades to greenish grey (10BG 3.5/1). The wet ASS profile was very dark greenish grey (10BG 3/1) in the upper part, dark yellowish-brown (10YR 3.5/4) and dark greenish-grey (5GY 4/1)/ dark bluish-grey (5B 4/1) at depth. No mottles were evident in the wet ASS profile. The light brown with yellow mottles was characteristic of AASS. The dark grey colours of the deeper parts of both profiles were typical of PASS. 3.3.1.1. Soil pH and Oxidised Soil pH Values. Soil pH from the dry and wet ASS profiles differed markedly, whereas the oxidised soil pH values were generally similar (Figures 3.1 and 3.2, respectively). The dry ASS profile was acidic (pH ≤ 4) above 0.7 m, whereas all samples from the wet profile had soil pH values above 5. With the exception of two samples, all H2O2 treated soil pH values from the dry ASS profile samples are below 3.2 (Figure 3.1). All 27 samples from the ASS profiles reacted and acidified on. 81.
(5) exposure to 30 % H2O2. Twenty-five of the samples acidified on oxidation to pH values ≤ 3.2. Acidification on oxidation confirmed that all samples are ASS. The two samples that did not acidify significantly on oxidation came from between 1.0 – 1.2 m bgl in the dry ASS profile. Considerable shell fragments were reported in the sample notes from this depth in the dry ASS profile. This suggested that the acidity generated during oxidation of the samples was effectively neutralised by carbonate buffering. Using the field test for ASS criteria (Hey et al., 2000), seven samples from the dry ASS profile were AASS (from between 0.0 and 0.7 m bgl), and five were PASS (from 0.7 to 1.0 m bgl and 1.2 to 1.4 m bgl). Two samples from the dry ASS profile were self-neutralising ASS (between 1.0 - 1.2 m bgl). All of the samples from the wet ASS profile were classified PASS because of their near neutral soil pH values and acidic oxidised soil pH values. 3.3.1.2. Mineralogy. The major mineralogy of all ASS samples examined by XRD was dominated by quartz, muscovite/illite and kaolinite (Figures 3.1 and 3.2). Potassium feldspar and Na plagioclase were also reported in all samples in major amounts. Jarosite occurred in all samples from the dry ASS profile and in the two deepest samples of the wet ASS profile (from 0.9 – 1.0 m bgl and 1.1 – 1.2 m bgl). The lack of jarosite in the samples from the upper parts of the wet ASS profile was in accordance with their reported near-neutral soil pH values. Jarosite becomes unstable at near-neutral pH values (White et al., 1997; Lowson, 1982). However, the occurrence of jarosite in the 0.9 - 1.0 m and 1.1 - 1.2 m bgl samples from the wet ASS profile is not consistent with the near-neutral soil pH values reported. The jarosite in these samples was noted during processing to occur along root tubes. Furthermore, the deep samples from the wet ASS profile that contained the jarosite were PASS, which on East Trinity have very low transmissivity (Smith et al., 2003b). Jarosite is known to occur along root tubes in PASS (Dent and Pons, 1993). Thus, jarosite occurrence in association with root tubes in the lower parts of the wet ASS profile is not related to AASS formation in the upper profile. It is likely that the jarosite formed in root tubes by O ingress during the draining of East Trinity and is consequently a relict maintained by limited soil-water movement due to the low transmissivity of the PASS. The lack of jarosite in the upper parts of the wet ASS profile may be due to the near neutral soil pH or redox conditions. Jarosite has been reported to be stable in ASS between pH values of 2 and 4 (where [FeT] = 10-5, [K] = 10-3.3, [SO42-]= 10-3.3; van Breemen, 1973).. Jarosite can also be. destabilised by reducing conditions. Chu et al. (2006) examined jarosite stability in AASS under. 82.
(6) reducing conditions using column experiments. Jarosite was found to dissolve under reducing soil conditions, even at low pH values. Hicks et al. (2003) showed that at East Trinity, seawater inundation had neutralised soil acidity and generated lower redox conditions in the upper parts of inundated ASS profiles. If this has also occurred in the wet ASS profile examined here, the near neutral or reducing soil conditions may have destabilised jarosite and caused its dissolution. In the dry profile, jarosite reported in all samples analysed by XRD (i.e. 0.0 to 1.1 m bgl), but was only visible to a depth of 0.5 m bgl in hand sample. It is possible that the jarosite reported in the dry profile from below 0.5 m bgl by XRD either occurred along root tubes (in a similar way to jarosite identified in the wet profile 0.9 – 1.0 m bgl and 1.1 – 1.2 m bgl samples), or that it was too fine grained/scarce to be visually identified during sampling. Pyrite occurs in the deepest three samples of the dry profile (0.5 – 0.7 m bgl (minor only), 0.7 – 0.9 m bgl and 0.9 – 1.1 m bgl). The presence of pyrite indicates that the ASS was not completely oxidised. Hematite was found in the surface sample from the wet ASS profile.. Bixbyite (Mn2O3). was reported in all samples from the wet profile below 0.7 bgl. Halite was identified in all samples from the wet ASS profile, but not in any of the dry profile samples. Halite likely formed from soil-waters during sample drying. The presence of halite indicates that that the wet ASS profile was inundated with seawater, or brackish water, at the time of sampling. 3.3.1.3. Grainsize Distribution. Grainsize in the dry ASS profile was dominated by silt (3.6 – 63.2 µm); though the sample from 0.8 - 0.9 m bgl was dominated by fine sand (126 – 252 µm) (Figures 3.1 and C.1). Samples from the wet ASS contain more silt (3.6 – 63.2 µm) than any other grainsize fraction (Figures 3.2 and C.2). Samples from the dry ASS profile were generally coarser than samples from the wet ASS profile. Grainsize analysis of the wet ASS profile showed a near uniform distribution of particle sizes. In contrast, the dry profile was more variable in particle size and consistently contained more coarse material. The coarser nature of the dry ASS profile compared to the wet ASS profile suggests that much of the dry ASS profile was deposited in a higher energy environment. The mineral most likely to constitute the coarser fractions is quartz, suggesting that the dry ASS profile will contain more SiO2 than the wet ASS profile. 3.3.1.4. Stratigraphy. Identification of stratigraphic units in the dry and wet ASS profiles was interpolated from the descriptions of Smith et al. (2003b) of cores 2, 3, 4, 5, 48, 49, 50, 51 and 53. The dry and wet ASS 83.
(7) profiles consisted of secondary estuarine infill organic muds overlying estuary/bay marine muds and sediments. In the dry ASS profile, the organic muds formed the top 0.9 m of the profile, followed by about 0.2 m of deltaic/prodeltaic laminate sandy muds marked by an increase in the medium sand content and shell grit, ending in estuary/bay marine muds. The wet ASS profile consisted of organic muds to a depth of 0.9 m and terminated in estuary/bay marine muds. 3.3.2. Geochemistry of East Trinity ASS. Elemental composition of the ASS samples (in terms of median, 10th percentile, 90th percentile, largest and smallest values) to a depth of 1.3 m bgl (n = 21) is given in Table 3.1. Major element geochemistry of the East Trinity ASS was dominated by Si, Al and Fe. Trace element geochemistry was dominated by Ba, Zr, Rb and Mn. Iron, Ca, Mg, Na, Mn, Zn, As, Pb, Ni, Cu and Co all displayed large concentration ranges. The large concentration ranges of some elements may be a result of mobilisation during PASS oxidation or AASS inundation. 3.3.3. Elemental Correlation in East Trinity ASS. Spearman’s coefficient of correlation was calculated for all samples from the dry and wet ASS profiles analysed (i.e. above 1.3 m bgl, n = 21). Correlation coefficients were calculated to identify elemental associations with other elements, grainsize, soil pH and H2O2 oxidised soil pH. A significant coefficient of correlation identifies that two components share a similar mode of occurrence; but it does not necessarily indicate a relationship.. Correlation coefficients were. calculated for depth (m bgl), soil pH, oxidised soil pH, 7 grain-size classes (clay, silt, very fine sand, fine sand, medium sand, coarse sand, very coarse sand), LOI and the XRF determined elements. The ASS correlation matrix is given in Appendix E, Table E.1. Calcium, Co, Mg, Mn, Ni, S, Y and Zn correlate positively with both soil pH and sample depth. Correlation with depth and soil pH indicates that Ca, Co, Mg, Mn, Ni, S, Y and Zn are depleted in acidic samples from the upper parts of the ASS profiles. In addition, Co, Mg, Mn, Ni and Zn all correlated positively with each other, reflecting their similar geochemical behaviour in ASS.. 84.
(8) Figure 3.1.. 85. Dry ASS profile sample depth, description, soil pH, oxidised soil pH, mineralogy and grainsize distribution..
(9) Figure 3.2.. 86. Wet ASS profile sample depth, description, soil pH, oxidised soil pH, mineralogy and grainsize distribution..
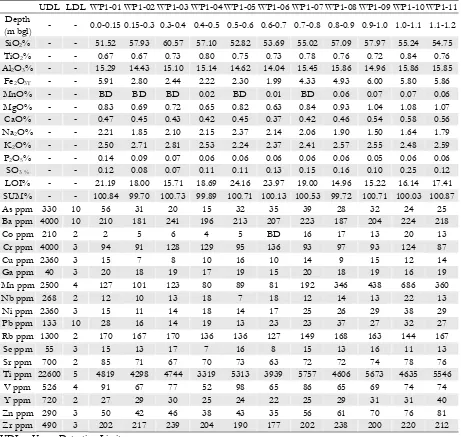
(10) Smallest. 5.49 15 175 0.18 1 6 1.39 15 1.76 0.19 80 0.65 7 11 223 13 127 24 7 22.84 61 2776 48 18 35 165. Al % As ppm Ba ppm Ca % Co ppm Cu ppm Fe % Ga ppm K% Mg % Mn ppm Na % Nb ppm Ni ppm P ppm Pb ppm Rb ppm S ppm Sc ppm Si % Sr ppm Ti ppm V ppm Y ppm Zn ppm Zr ppm. 6.70 20 187 0.24 1 7 1.61 15 1.97 0.24 89 0.79 10 11 231 16 136 44 10 24.69 67 3675 52 21 35 170. 10th %tile 7.99 25 213 0.32 6 12 3.26 18 2.15 0.46 138 1.12 13 19 257 26 167 416 14 27.10 72 4382 70 25 50 207. Median. East Trinity ASS. 8.57 41 242 0.67 20 16 4.20 20 2.64 0.67 459 1.65 18 34 415 33 179 1354 17 30.13 87 5057 92 32 81 238. 87. 90th %tile 9.20 56 252 2.79 20 16 4.92 21 2.76 0.80 686 1.76 22 38 611 37 206 4525 17 31.91 213 5246 98 40 83 241. Largest 8.00 2 430 3.00 25 60 5.00 17 2.60 2.10 900 2.40 20 80 1000 16 120 500 5 - 22 27.00 350 5000 150 30 70 160. Crustal Abundance (Smith and Huyck, 1999) 7.70 1.70 630 1.52 4 20 2.19 17 3.36 0.55 465 2.71 21 10 760 17 140 300 11 33.05 270 2300 66 38 50 150. (Faure, 1998). [Granite Av.]. 8.00 13 580 2.21 19 45 4.72 19 2.66 1.50 850 0.96 11 68 700 20 140 2400 13 7.30 300 4600 130 26 95 160. (Faure, 1998). [Shale Av.]. [Soil Av.]. 7 32.00 200 4000 100 50 50 300. 40 600 10 10. 7.10 5 430 1.37 8 30 3.80 14 0.83 0.50 600 0.63. (Lindsay, 1979). (discussed in Section 3.4.1). Values in bold fall between the 10th and 90th percentile of the ASS samples from Firewood Creek (East Trinity).. detection limit for the calculation of the statistics. Average element abundance in the crust, granites, shale and soil are provided for comparison. 21). Major are reported as element weight percent and trace elements as ppm. Below detection (BD) entries were replaced with values half the. 10th and 90th percentiles values. Elements were determined by XRF. Data were from ASS samples DP1-1 to DP1-10 and WP1-1 to WP1-11 (n =. Summary statistics of the ASS chemical composition (to a depth of 1.3 m bgl) from East Trinity. Data are reported as largest, smallest, median,. Element. Table 3.1..
(11) Aluminium, Cu and Pb correlated with sample depth; but not with soil pH.. The positive. correlation of depth with Al, Cu and Pb reflected decreasing concentration of the elements towards the top of the ASS profiles. Potassium and Si inversely correlated with soil pH, but did not correlate significantly with depth. No significant positive element correlation with soil pH occurred that was not also accompanied by a significant correlation with sample depth. The inverse correlation of K and Si with soil pH indicates that [K] and [Si] increase as the soil becomes more acidic. Furthermore, Si, K and Rb correlated positively with the medium sand fraction. The K, Rb, Si and medium sand fraction group correlation suggested that the K, Rb and Si are partly co-hosted by the same mineral (e.g. alkali feldspars) in medium sand sized grains. Arsenic, Ba, Fe, Ga, Na, Nb, Sc, Sr, Ti, V and Zr did not correlate significantly with either soil pH or sample depth. Sodium has a strong negative correlation with Si, K and Rb, indicating that Na is not hosted with K, Rb, or Si. However, Na correlates strongly (a = 0.001) with LOI; suggesting that Na occurrence may be related to hydrated minerals or organic matter. Iron’s only strong (a = 0.001+) correlation was with Pb. The lack of correlation with soil pH and sample depth shows that Fe occurrence in ASS was different from the other transition elements. Sulfur correlated strongly with LOI, Na, Mg, Ca, and weakly with Y, V, Ni, Cu, and Pb. The relationship between LOI, Na, Mg and Ca may be related to seawater, whereas the correlations with the transition metals and Pb may indicate a geochemical association. Barium correlated strongly (a = 0.001) with Zr and moderately (a = 0.01) with Nb and Ti. Zirconium’s only strong (a = 0.001) positive correlation is with Ba. The lack of correlation of Ba, Nb, Ti and Zr with depth or soil pH shows that these elements were not depleted with depth or soil acidification. 3.3.4. Elemental Comparison of Dry and Wet ASS Profiles. Median concentrations of chemical components in the dry and wet ASS profile were compared to identify if elemental (and LOI) abundances differed between the two profiles (Table 3.2). The bulk of the determined element median concentrations (15) vary between the profiles by less than 10 % (Al, Ba, Ca, Cu, Ga, Nb, P, Rb, Sc, Sr, Ti, V, Zn and Zr). Medians for Co, Fe, K, Mg, Ni, Pb, Si, Ti and Y vary between the profiles by less than 25 %. Only the medians for As, LOI, Mn, Na and S differ from each other by more than 25 %.. 88.
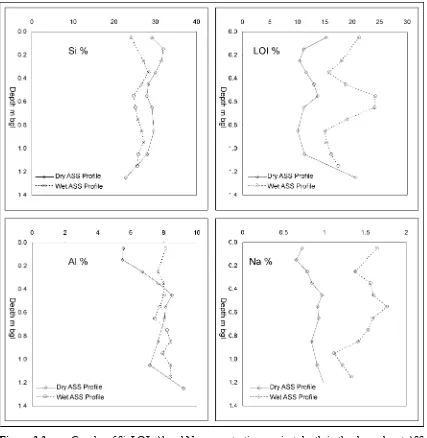
(12) The limited variation in the concentrations of 29 of 34 chemical components in the dry and wet ASS profiles shows that the two ASS profiles are geochemically similar. Chemical components that varied by more than 25 % were Na, As, LOI and Mn. A possible explanation for the large variation in [Na] and [S] is the influence of seawater. Seawater is known to inundate the wet ASS profile. In comparison, the dry ASS profile is inundated with seawater less frequently due to its increased elevation and distance from drainage features. The high concentration of Na in seawater may be reflected in the geochemistry of the wet ASS profile. Increased LOI abundance in the wet ASS profile may also be because of frequent seawater saturation, which could result in an increased abundance of hydrated minerals. Table 3.2.. Comparison of dry and wet ASS profile elemental and LOI median values. %Var was calculated by = (([largest]-[smallest])/[average of largest and smallest])*100.. Si % Ti % Al % 29.12 0.41 7.66 25.82 0.45 8.01 12 8 5 Sc ppm Ba ppm Dry 14 215.5 Wet 13 210 %Var 7 3 Ga ppm As ppm Dry 18 22.5 Wet 19 31 %Var 5 32. Dry Wet %Var. 3.3.5. Fe % Mg % Ca % Na % 3.41 0.41 0.30 0.88 3.03 0.50 0.32 1.53 12 19 7 54 V ppm Mn ppm Co ppm 67.5 207.5 7.5 74 127 6 9 48 22 Pb ppm Rb ppm Sr ppm 26 173 72 23 163 72 12 6 0. K% 2.51 2.10 18 Ni ppm 20.5 18 13 Y ppm 24.5 29 17. P% S % LOI % 0.02 0.01 11.45 0.03 0.05 18.00 10 122 45 Cu ppm Zn ppm 11.5 54 12 50 4 8 Zr ppm Nb ppm 210 13.5 204 13 3 4. Element Concentrations with Profile Depth. Silicon, LOI, Al and Na are plotted against depth to show concentration variation in the wet and dry ASS profiles (Figure 3.3). In both profiles, [Si] and [LOI] tend to have an inverse relationship that provides a relatively consistent background concentration (dry ASS profile: [SiO2]+[LOI] ranges between 69 % to 79 %; wet profile: [SiO2]+[LOI] ranges between 71 % to 78 %). The Al concentrations were similar in both dry and wet profiles below 0.5 m bgl, but above 0.5 m bgl Al concentrations were lower in the dry profile than in the wet profile. Increased dissolution of aluminosilicates due to extended acidic conditions is a possible reason for the decrease in [Al] in the upper part of the dry ASS. Silicon occurrence in both ASS profiles followed a similar trend, but Si is uniformly more abundant (~10 %) in the dry ASS profile. The larger [Si] in the dry ASS profile compared to the wet ASS profile is likely due to an increase abundance of quartz. It is unlikely that aluminosilicates are the source of the increased [Si] as a corresponding increase in the [Al] did not occur.. 89.
(13) Sodium concentrations were much higher in the wet profile compared to the dry ASS profile. Increased seawater inundation is the likely cause of the increased [Na] in the wet ASS profile. Barium, Ga, Ti and Zr concentrations are plotted against depth in the dry (82N) and wet (82S) profiles (Figure 3.4). Barium, Ga, Ti and Zr concentrations were similar in both the dry and wet ASS profiles. The similar concentration of Ba, Ga, Ti and Zr in the two ASS profile with depth suggests that oxidation, acidification and inundation have not altered the abundance of the elements.. Figure 3.3.. Graphs of Si, LOI, Al and Na concentrations against depth in the dry and wet ASS profiles.. Manganese, Zn, Ni and Co concentrations are plotted against depth in the dry and wet ASS profiles (Figure 3.5). Cobalt, Mn, Ni and Zn were found in their lowest concentrations above 0.7 m bgl in. 90.
(14) both ASS profiles. Cobalt’s highest concentrations were reported between 0.7 – 1.0 m bgl in both profiles. Manganese concentrations were approximately four times higher at 1 m bgl than in any sample from the top 0.5 m bgl of the profile. Nickel concentrations were twice as high below 1.0 m bgl as they were in the 0.5 m of both profiles. Oxidation and acidification of the upper parts of both ASS profile during the period when East Trinity was drained is the likely cause of the low concentrations of Co, Mn, Ni and Zn. Though Co, Mn, Ni and Zn are depleted in the upper part of both ASS profile, all the elements show a peak in concentration immediately below the zone of depletion. It is likely that Co, Mn, Ni and Zn are immobilised by a change in pH or redox conditions as they move down the ASS profiles.. Figure 3.4.. Graphs of Ba, Ga, Ti and Zr concentrations against depth in the dry and wet ASS profiles.. 91.
(15) Iron, As, Cu and Pb concentrations are plotted against depth in the dry and wet ASS profiles (Figure 3.6). Iron, As, Cu and Pb displayed a similar distribution in the ASS profiles. Iron, As, Cu and Pb generally occurred at their lowest concentrations between 0.2 – 0.7 m bgl in both ASS profiles. Arsenic differed from Fe, Cu and Pb in that it occurred in concentrations less than those between 0.2 – 0.7 m bgl below that depth, after increasing in concentration between 0.7 – 0.9 m bgl. Arsenic, Cu and Pb concentrations may relate to Fe because of adsorption onto Fe oxides.. Figure 3.5.. Graphs of Co, Mn, Ni and Zn concentrations against depth in the dry and wet ASS profiles.. 3.3.6. Comparison of AASS, IAASS and PASS. The IAASS and AASS were compared to determine whether geochemical differences existed between the two ASS types. However, a direct comparison of AASS with IAASS was not made because compositional differences would potentially obscure the geochemical differences. Instead,. 92.
(16) differences between the two groups were identified by comparing the composition of AASS and IAASS relative to their underlying PASS.. Figure 3.6.. Graphs of Fe, As, Pb and Cu concentrations against depth in the dry and wet ASS profiles from Firewood Creek.. 3.3.6.1. Classification of ASS Samples. Samples from each of the two ASS profiles were divided into two groups: oxidised ASS and PASS. This formed two sample groups for each ASS profile: an oxidised ASS group (consisting of either AASS or IAASS) and an unoxidised ASS group (consisting of PASS).. Cobalt and Mn. concentrations were used to differentiate the ASS samples into those that had been oxidised and those that had not. Cobalt and Mn concentrations were used to identify past oxidation because: 1) they (along with Ni and Zn) were depleted from the upper parts of both ASS profiles; 2) they are largely hosted in ASS by sulfide minerals (Åström, 2001b); and 3) they have been found to mobilise. 93.
(17) during PASS oxidation (Åström, 1998). Hence, relative Co and Mn concentrations in the ASS samples provide a profile-specific indication of ASS oxidation.. Relatively high Co and Mn. concentrations indicate that the ASS has not oxidised, whereas relatively low Co and Mn concentrations indicate that the ASS has oxidised. Scatter plots of [Mn] against [Co] in the samples from the dry and wet ASS profile showed distinct oxidised and un-oxidised ASS groups (Figure 3.7). Five samples from the dry ASS profile and six samples from the wet ASS profile plotted in the lower left corners of their respective graphs (Figure 3.7). The depleted [Mn] and [Co] of these 11 samples indicate that they have oxidised. The oxidised samples from the dry ASS profile were from the top 0.5 m of the profile (Figure 3.7, diagram A, closed diamonds). Similarly, the six oxidised samples from the wet ASS profile formed the top 0.7 m of that profile (Figure 3.7, diagram B, closed diamonds).. Figure 3.7.. Comparison of Co and Mn concentrations in the samples from the dry and wet ASS profiles.. Cobalt and Mn concentrations that were smaller relative to. underlying PASS were considered to have oxidised. Samples from the upper 0.5 m of the dry ASS profile (samples DP1-1 to DP1-5, closed diamonds, diagram A) and samples from the upper 0.7 m of the wet ASS profile (samples WP1-1 to WP1-6, closed diamonds, diagram B) plotted in the lower left corner of the graph. The samples that plotted in the lower left corner of the graphs formed the oxidised ASS groups of the dry and wet ASS profiles respectively. The remaining samples (DP1-6 to DP1-10 and WP1-7 to WP1-11, open diamonds) composed the PASS groups for the respective profiles.. 94.
(18) The five oxidised samples from the dry ASS profile were the only samples from either ASS profile to have soil pH values ≤ 4. These five samples were classified as AASS in line with the field test for ASS. However, the six oxidised ASS samples from the wet ASS profile had soil pH values > 4, indicating that they were not AASS. As the Co and Mn concentrations in these six samples indicated that they had previously been oxidised, but as their soil acidity had since been neutralised by seawater, they were classified IAASS. Therefore, the dry ASS profile was divided into an AASS sample group (0.0 - 0.5 m bgl, samples DP1-1 to DP1-5, n = 5), and the dry profile PASS (DP PASS) group (0.5 - 1.3 m bgl, DP1-6 DP1-10, n = 5). The wet ASS profile was split into the IAASS group (0.0 - 0.7 m bgl, samples WP1-1 to WP1-6, n = 6) and the wet profile PASS (WP PASS) group (0.7 - 1.2 m bgl, samples WP1-7 - WP1-11, n = 5). 3.3.6.2. Comparison of AASS and IAASS Geochemistry. The concentrations of chemical components in the IAASS and AASS groups are not directly compared. Instead, differences in component concentrations between the IAASS and AASS groups were identified by comparing the percentage of chemical component in the IAASS and AASS groups relative to the PASS group from the respective ASS profiles. Comparison of the AASS/DP PASS and IAASS/WP PASS percentages allowed for the rapid identification of differences in chemical component abundances between the AASS and IAASS, while taking into account slight compositional differences in the profiles. The AASS and DP PASS sample groups (from the dry ASS profile) are compared in Figures 3.8 (components reported as wt%) and 3.9 (elements reported as ppm). Geochemical composition of the IAASS and WP PASS groups (wet ASS profile groups) are compared in Figures 3.10 (components reported as wt%) and 3.11 (elements reported as ppm).. The data displayed in. Figures 3.8, 3.9, 3.10 and 3.11 are the median, 25th percentile, 75th percentile, smallest and highest values from the ASS groups. Chemical components are ranked in descending order of median abundance in each ASS profile’s PASS group. The median element concentration in the oxidised ASS (AASS and IAASS) relative to their respective PASS (i.e. the PASS relative concentration, PRC) expressed as a percentage are reported for each element. The AASS PRC was found using Equation 3.1, and the IAASS PRC was found using Equation 3.2.. [~x ] PASS relative concentration (PRC) % = ~ AASS × 100 [x ]DP PASS. Eq. 3.1. [~x ] PASS relative concentration (PRC) % = ~ IAASS × 100 [x ]WP PASS. Eq. 3.2. 95.
(19) Figure 3.8.. Logarithmic comparison of major chemical components of AASS and DP PASS sample groups from the dry ASS profile. Components are displayed in descending order of median concentration in the DP PASS group. Data displayed: median, 25th percentile, 75th percentile, smallest and largest values. The value at the end of each set of AASS group element data is the percentage of the DP PASS median that occurs in the AASS sample group median.. In the dry ASS profile, the AASS group median values for As, Ba, K, Nb, Rb, Sc, Sr, Si, Ti, Zr and LOI were all within ± 15 % of the DP PASS group medians. The Na median in the AASS was 87 % that of the DP PASS. No median element concentration in the AASS occurred at great than 115 % of the respective DP PASS median. Elements that occurred in the AASS at less than 85 % of the DP PASS median (in descending order) were Al (84 %), Y (84 %), Pb (82 %), Ca (81 %), Fe (80 %), V (78 %), Zn (58 %), Ni (56 %), Cu (54 %), Mg (46 %), Mn (26 %), Co (24 %) and S (17 %).. 96.
(20) Figure 3.9. Logarithmic comparison of trace elements of AASS and DP PASS sample groups from the dry ASS profile. Elements are displayed in descending order of median concentration in the DP PASS group. Data displayed: median, 25th percentile, 75th percentile, smallest and largest values. The value at the end of each set of AASS group element data is the percentage of the DP PASS median that occurs in the AASS sample group median.. In the wet ASS profile, the median values of the IAASS sample group for Al, Ba, Ga, K, Nb, Rb, Sc, Sr, Si, Ti and Zr were all within ± 15 % of the respective WP PASS medians. Component medians in the IAASS group that occur at more than 115 % of the respective median in the WP PASS were Na (120 %) and LOI (124 %). Elements that occur in the IAASS at less than 85 % of the WP PASS group median (in descending order) were Ca (82 %), Ti ppm (82 %), Cu (72 %), Mg (68 %), Pb (65 %), Zn (61 %), Ni (50 %), S (42 %), Fe (41 %), Co (29 %) and Mn (27 %). Comparison of the percentage of PASS chemical components in AASS and IAASS showed that the concentrations of Ba, Ga, K, Nb, Rb, Sc, Sr, Si, Ti and Zr vary from the PASS group medians by less than ± 15 %. In contrast, Ca, Co, Cu, Fe, Mn, Mg, Ni, Pb, S and Zn were all lost from AASS and IAASS in amounts great than 15 % relative to their respective PASS groups. No chemical component in the AASS group was enriched more than 15 % of the respective PASS concentration. However, LOI and Na were both enriched more than 15 % in the IAASS group. The [LOI] and [Na] in the IAASS group were 124 % and 120 % (respectively) of the WP PASS.. 97.
(21) Figure 3.10. Logarithmic comparison of major chemical components of IAASS and WP PASS sample groups from the wet ASS profile. Components are displayed in descending order of median concentration in the WP PASS group. Data displayed: median, 25th percentile, 75th percentile, smallest and largest values. The value at the end of each set of IAASS group element data is the percentage of the WP PASS median that occurs in the AASS sample group median.. Calcium, Co, Cu, Mn, Mg, S and Zn were lost from AASS more than from IAASS. Additionally, more than 15% of the Al, V and Y were lost from AASS relative to PASS. In comparison, Al, V and Y vary from the WP PASS median by less than 15% in the IAASS group. Iron, Ni and Pb differ from the other mobilised element in that they were lost in larger amounts from IAASS than AASS. 3.3.7. Results of AASS Flushing Experiment. An AASS flushing experiment was used to examine changes in the pH of seawater exposed to AASS.. The seawater used to flush the columns had a pH of 8.1. During the 28 days of flushing. 98.
(22) with fresh seawater, the leachate pH value decreased to a low of 5.3 on the third day before increasing to 6.4 on the 28th cycle (Figure 3.12). The pH of the leachate from the AASS flushed with recycled seawater rapidly dropped to a value of 3.8 on the sixth day and stabilised at between 2.8 - 3.0 after the 16th cycle.. Figure 3.11.. Logarithmic comparison of trace element components of IAASS and WP PASS sample groups from the wet ASS profile. Elements displayed in descending order of median concentration in the WP PASS group. Data displayed: median, 25th percentile, 75th percentile, smallest and largest values. The value at the end of each set of IAASS group element data is the percentage of the WP PASS median that occurs in the AASS sample group median.. The leachate pH from the AASS flushed with fresh seawater gradually increased. This suggests that the fresh seawater gradually neutralised acidity in the AASS. The later pH values of the leachate from the AASS flushed with fresh seawater were similar to the soil pH of the IAASS from the wet ASS profile. In contrast, the recycled seawater acidified significantly. This indicates that the neutralising capacity of the recycled seawater became exhausted after approximately 12 cycles.. 99.
(23) Figure 3.12.. Leachate pH from the AASS columns flushed with fresh seawater and recycled seawater. The columns were flushed with 28 flushing cycles that consisted of 6 hours of flooding followed by 18 hours of drainage. The initial pH value of the seawater was 8.1.. 3.4 Discussion 3.4.1. Comparison of East Trinity ASS with Other Geological Materials. The elemental composition of East Trinity ASS is compared with average crustal abundance, granite, shale, and soil chemical composition, published ASS data, the ANZECC and ARMCANZ (2000) sediment quality guidelines and the NEPC (1999) soil quality guidelines. Geochemical comparison of East Trinity ASS with averaged geological material and other ASS indicates element enrichment and depletion compared with other geological materials and ASS from other locations. Additionally, comparison with sediment and soil quality guidelines provides a general indication of the threat the East Trinity ASS pose to humans and the environment in terms of element toxicity. 3.4.1.1. Comparison with other Geological Materials. The elemental composition of East Trinity ASS is compared with the average element abundances in the crust, granites, shale, and soils to identify relative element enrichment/depletion (Table 3.1). Similarities between the geological materials and the East Trinity ASS were identified by the element average occurring between the 10th and 90th percentiles of the element concentration in the East Trinity ASS. Using this method, the East Trinity ASS occurrence of Co, Fe, Mn, Ti and Zn were found to be similar to the soil average; Al, Ga, K, S, Si, Ti, Y and Zn similar to crustal abundance; Al, Co, Fe, Ga, Mg, Pb, Rb, S, Sc, V and Zn similar to granite; and Al, Co, Ga, Na, Nb, Pb, Rb, Sc, Ti and Y similar to the shale average abundance. 100.
(24) Median concentrations of As, Rb, Pb, and Sc were higher in the East Trinity ASS than in any of the geological media. The higher than average occurrence of Rb and Sc likely reflects the high aluminosilicate (particularly clay) content of the ASS. Lead is likely accumulated in the ASS as sulfides. Natural As enrichment has been reported in ASS from Alberta (Bennett and Dudas, 2003). Enrichment of As in ASS is a product of pyrite formation during ASS genesis. Pyrite is the primary mineral host of As (Boyle and Jonasson, 1973) and so As is likely to accumulate in ASS by pyrite formation. Post genesis, the behaviour of As in unconsolidated sedimentary systems is largely the product of four hydrogeochemical processes (Smith et al., 2003e). These processes are: 1) the oxidation of As containing pyrite; 2) the reductive dissolution of Fe3+-rich oxyhydroxides; 3) the desorption of As from aluminosilicate minerals or Al oxides; and 4) competitive ligand exchange with PO4 anions. 3.4.1.2. Comparison with Other ASS. Few datasets have been published on the chemical composition of ASS. Table 3.3 provides a comparison of East Trinity ASS with ASS from Finland (Åström and Björklund, 1997). However, the validity of the comparison is questionable because the ASS from Finland were digested for analysis using aqua regia. Aqua regia digests frequently provide incomplete element values in sediments and the data are not generally comparable with total metal data (Loring and Rantala, 1992). Therefore, the comparison of the dataset from Åström and Björklund (1997) with the one generated here is of limited value. However, a tentative comparison can be made between the datasets conditional to the aqua regia derived data being considered minimum values at best. Of the compared elements, only the median concentrations in the East Trinity ASS of Fe, Mg, Ni and Zn were between the respective 10th and 90th percentiles of the ASS from Finland. This indicates that Fe, Mn, Ni and Zn occur in similar concentrations in ASS from both locations. In contrast, Al, Ba, Ca, Co, Cu, K, Mn, Na, P, Pb, Sr, Ti and V occur in dissimilar concentrations, as their median values in the East Trinity ASS were outside the respective 10th and 90th percentiles of the ASS from Finland. Additionally, the median concentrations of Co, Cu, Mn, Ni and Zn in the East Trinity ASS were approximately half that for the ASS from Finland. Lead differed from the other metals in that its median concentration in the East Trinity ASS was more than twice that of the ASS from Finland.. The significant difference in chemical composition between the ASS from East Trinity and from Finland reflects the different sediments that comprise the ASS. Åström and Björklund (1997) identify that the ASS from Finland are comprised of till and glaciofluvial material, marine and. 101.
(25) lacustrine clay and silts, littoral deposits and peat. By contrast, the East Trinity ASS were formed from sediments deposited by longshore drift, colluvial and fluvial material from the granites of the Murray Prior Range, and marine sediments and sediments from the Barron River (including material from the basalts and metamorphic rocks of the Atherton and Evelyn Tablelands). 3.4.1.3. Comparison with Sediment and Soil Quality Guidelines. The final comparison of the East Trinity ASS is with sediment and soil quality guidelines (Table 3.4). ANZECC and ARMCANZ (2000) provides Interim Sediment Quality Guidelines (ISQG) for As, Cu, Pb, Ni and Zn and the NEPC (1999) document gives a range of soil quality guidelines for As, Ba, Co, Cu, Pb, Mn, Ni, V and Zn. Table 3.3.. Comparison of chemical composition of East Trinity ASS (n = 21, determined with XRF) with ASS (determined by aqua regia digest, n = 317) from Finland analysed by Åström and Björklund (1997, Table 3). Values are in units of ppm unless otherwise indicated. Median concentrations from East Trinity ASS that are within the 10th and 90th percentile concentration range of the ASS from Finland are in bold.. Element Al ppm Ba ppm Ca ppm Co ppm Cu ppm Fe ppm K ppm Mg ppm Mn ppm Na ppm Ni ppm P ppm Pb ppm Sr ppm Ti ppm V ppm Zn ppm. Min 3500 14 2500 2 2 7800 700 1200 90 BD 6 40 BD 10 700 12 18. 10th%tile 9600 45 3700 7 14 22900 2800 4400 223 500 16 530 6 22 1300 28 43. ASS from Finland Median 20200 87 5000 13 27 38000 6000 10400 448 1000 31 640 12 36 2200 50 90. 90th%tile 29500 168 5800 18 46 48100 9400 14300 713 1900 42 840 17 48 2700 64 114. Max 35800 229 7500 31 65 57000 14000 18300 1147 3100 58 1810 25 60 3000 76 142. East Trinity Median 79900 213 3200 6 12 32600 21500 4600 138 11200 19 257 26 72 4382 70 50. The value of the comparison is questionable, because neither of the two guidelines take into account the bioavailable fraction of the elements being examined. Furthermore, the soil quality “A” guideline measures soil quality in terms of human exposure in a residential setting (NEPC, 1999). This guideline has little relevance to the ASS of East Trinity. The Ecological based Investigation Limit (EIL) for soil quality is potentially more relevant, but without data on the susceptibility of specific East Trinity organisms, the EIL values can only be used to provide a very general indication of potential for environmental harm. 102.
(26) The only elements to exceed any of the quality guidelines were As, Ni and V (Table 3.4). In the East Trinity ASS, more than 75 % of the As concentrations were greater than the ISQG-low and the soil EIL value. Nickel occurred in excess of the ISQG-Low value in more than 25 % of the ASS samples and V was greater than the soil EIL value in more than 75 % of the ASS samples. Elements that exceed the ISQG-low value (i.e. As and Ni) may cause harmful biological effects in the East Trinity ASS, however, these are expected to be limited. Similarly, the elements that exceed the soil EIL values (i.e. As and V) have the potential to cause problems in susceptible biota. Possible toxic effects of As, Ni and V are reported by Smith and Huyck (1999). Toxic effects of As include damage to the nervous system, liver and vascular system. Arsenic and Ni are known carcinogens. Vanadium has been found to have toxic effects on the respiratory, cardiovascular, gastrointestinal and central nervous systems.. However, without specific data on organism. sensitivity, attributing any human or ecological impact solely on high [As], [Ni], or [V], particularly in an ASS environment, is futile. Table 3.4.. Comparison of East Trinity ASS with Australian quality guidelines for sediments and soils. Sediment guidelines are from ANZECC and ARMCANZ (2000) and soil guidelines are from NEPC (1999). East Trinity ASS value in bold exceed the corresponding guideline value/s.. Sediment Quality Soil Quality East Trinity ASS Guidelines Guidelines ISQGISQGA3 EIL4 Smallest 25th %tile Median 75th %tile Largest Low1 High2 As ppm 20 70 100 20 15 21 25 32 56 Ba ppm 300 175 196 213 224 252 Co ppm 1 4 6 16 20 Cu ppm 65 270 1000 100 6 9 12 15 16 Pb ppm 50 220 300 600 13 19 26 27 37 Mn ppm 1500 500 80 97 138 371 686 Ni ppm 21 52 600 60 11 15 19 29 38 V ppm 50 48 65 70 78 98 Zn ppm 200 410 7000 200 35 42 50 71 83 1 Interim Sediment Quality Guideline (ISQG) - Low: “probable-effects concentration” threshold, below which biological effects rarely occur. 2. Interim Sediment Quality Guideline (ISQG) - High: “probable-effects concentration” threshold, below. which biological effects possibly occur. Concentrations at or above the ISQG-High represent concentrations within which frequent biological effects are expected. 3 Soils 4. A: Standard residential human exposure, see NEPC (1999) for details.. Ecological Investigation Level (interim urban), see NEPC (1999) for details.. 103.
(27) 3.4.2. IAASS Identification. Identification of IAASS using standard ASS techniques is impractical because no method identifies previous events of PASS oxidation. For example, the field test for ASS described by Hey et al. (2000) and Ahern et al. (1998) classifies ASS as AASS or PASS using soil pH and oxidised soil pH values (Table 3.5). IAASS cannot be identified using the field test for ASS because it has similar soil pH and oxidised soil pH characteristics to PASS. This is demonstrated by the classification of all the samples from the wet ASS profile as PASS. Furthermore, other more sophisticated ASS classification methods (e.g. acid-base accounting) are not suited to IAASS classification because they do not identify past events of PASS oxidation. However, depleted Co, Mn, Ni and Zn concentrations are indicative of AASS formation. Therefore, the depleted concentrations of Co, Mn, Ni and Zn in AASS have the potential to be used as a site-specific indication of PASS oxidation (i.e. AASS formation). Table 3.5.. Field test for ASS classification scheme (Hey et al., 2000 and Ahern et al., 1998).. ASS Type. Soil pH (pHF). PASS. >4. AASS. soil pH values of ≤ 4. Oxidised Soil pH (pHFOx) ≤ 4; and difference between soil pH and oxidised soil pH values > 1 -. Following from this, a procedure was developed to geochemically identify IAASS using pHF, pHFOx and element geochemistry. The procedure was based on the expected geochemical properties of IAASS. The hypothesised geochemical properties of IAASS were: 1) concentrations of elements mobilised during PASS oxidation (e.g. Co, Mn, Zn) similar to AASS; 2) a near neutral soil pH; and 3) significantly higher [Na] than AASS. The rationale for the IAASS hypothesis was that: •. IAASS was AASS before inundation. Thus, IAASS would have similar concentrations of elements mobilised during PASS oxidation (e.g. Co, Mn, Zn; Åström, 2001a; Åström, 1998; Åström and Björklund, 1997) to AASS;. •. Seawater inundation would neutralise soil acidity by buffering as well as by inducing Fe3+ and SO42- reducing reactions.. Consequently, IAASS would have near neutral soil pH values. (neutralisation would also cause the dissolution of jarosite); and •. The abundance of Na in seawater (10,500 mg/L; Hem, 1985) would enrich Na concentrations in the IAASS relative to AASS, particularly in the water-soluble fraction.. 104.
(28) 3.4.2.1. Testing of the IAASS Hypothesis. The IAASS hypothesis was tested by comparing ASS from locations that had oxidised during the reclamation of East Trinity, but that had since been either extensively inundated by seawater (the wet ASS profile) or infrequently inundated (the dry ASS profile). The sampling sites of the wet and dry ASS profiles were selected using field evidence of seawater inundation (i.e. relationships to drainage features, elevation and the presence and condition of Melaleuca leucadendra trees; see section 2.2.1). Using the IAASS hypothesis, samples from the top 0.7 m of the wet ASS profile were identified as IAASS. By contrast, the samples from the upper 0.5 m bgl in the dry ASS profile were AASS. The properties of these soil groups are compared. 3.4.2.1.1. Depleted Co, Mn and Zn Concentrations. The dry and wet ASS profiles showed [Co], [Mn], [Ni] and [Zn] trends with depth similar to ASS profiles described by Åström (1998). The ASS profiles examined by Åström (1998) consisted of three horizons each defined by pH and element concentrations. At the top, an oxidised and acidic horizon (i.e. consisting of AASS) was depleted in Co, Mn, Ni and Zn. In the middle, a narrow transitional zone was marked by an abrupt increase in soil pH and enrichment in Co, Ni and Zn. Below the transitional zone, a reduced horizon consisted of soil with near neutral pH values (i.e. PASS). Åström (1998) found that Mn was lost from the whole profile, whereas Co, Ni and Zn were precipitated at the AASS-PASS transition. Cobalt, Mn, Ni and Zn were reportedly lost from the upper profile due to sulfide mineral oxidation (Åström (1998). The enrichment of Co, Ni and Zn at the AASS-PASS transition was attributed to immobilisation by sorption onto various soil constituents and by oxide precipitation (Åström, 1998). At East Trinity, both the dry and wet ASS profiles display the concentration pattern for Co, Mn, Ni and Zn described by Åström (1998) i.e. depletion in AASS, enrichment at the AASS-PASS transition and ‘background’ concentrations in PASS. The pattern indicates that the upper parts of both ASS profiles from East Trinity had oxidised and acidified. 3.4.2.1.2. Near Neutral Soil pH Values. As expected in oxidised ASS, the samples from the upper 0.5 m bgl of the dry ASS profile were very acidic. However, all the soils from the wet ASS profile had near neutral soil pH values. Using the field test for ASS classification described by Hey et al. (2000) and Ahern et al. (1998), the top 0.7 m of the dry ASS profile was AASS. AASS forming the top 0.7 m dry ASS profile is consistent with the ASS history of East Trinity. The field test for ASS classified all of the samples from the wet ASS profile as PASS because of their near neutral soil pH values and acidic pH after oxidation. 105.
(29) Neutralisation by seawater is the likely mechanism for the near neutral soil pH values in the upper part of the wet ASS profile. Seawater contains approximately 2 mM of H+ neutralising capacity (Stumm and Morgan, 1996).. The ability of seawater to neutralise acidity in AASS was. demonstrated by the AASS seawater flushing experiment (Figure 3.12). The experiment showed that the pH of seawater AASS leachate increased from a low of 5 to 6.2 after 28 days of flushing. The fact that seawater is the neutralisation agent in the wet ASS profile is supported by the presence of halite and elevated [Na] in the upper parts of the wet ASS profile. Halite was identified with XRD in all samples from the wet profile, but it was not identified in any of the dry profile samples.. Halite was probably precipitated from seawater-saturated porewaters during sample. processing (drying). Sodium concentrations in samples from the wet profile were 1.5 to 2 times higher when compared to samples from similar depths in the dry profile. 3.4.2.2. IAASS Summary. IAASS was hypothesised to have a near neutral soil pH, elevated [Na] and to be depleted in concentrations of Co, Mn and Zn. The upper parts of the dry and wet AASS profile were found to be depleted in Co, Mn, Ni and Zn, indicating that oxidation had occurred. This was supported by the acidic nature of the soils from the upper parts of the dry ASS profile and the occurrence of Melaleuca leucadendra at both sample sites. By contrast, the upper parts of the wet AASS profile had near neutral soil pH values. The depletion of Co, Mn, Ni and Zn and near neutral soil pH values indicate that the upper parts of the wet ASS profile were once AASS, but that the soil acidity in the AASS has been neutralised. The likely mechanism of neutralisation in the upper parts of the wet ASS profile is seawater inundation. This is indicated by increased Na concentrations and the presence of halite. Additionally, the wet ASS profile was sampled from within dead Melaleuca leucadendra trees. Melaleuca leucadendra trees were shown to be tolerant of acidic soil conditions and freshwater inundation, but not inundation with saltwater (section 2.2.1). The increased [Na] and dead Melaleuca leucadendra trees further support the fact that the agent of soil acidity neutralisation in the upper part of the wet ASS profile was seawater. Finally, Co, Mn, Ni and Zn depletion must be used to identify IAASS because no other method exists that identifies past events of AASS formation (i.e. PASS oxidation).. 3.5 Conclusions The objectives of the chapter were: 1) to describe the geochemistry of ASS; and 2) to identify IAASS. Partly oxidised ASS profiles were collected from inundated and non-inundated areas of the Firewood Creek catchment on East Trinity. Samples taken from the ASS profiles were described in. 106.
(30) terms of soil pH, oxidised soil pH, mineralogy and chemical composition (Al, As, Ba, Ca, Co, Cu, Cr, Fe, Ga, K, Mg, Mn, Na, Nb, Ni, P, Pb, Rb, S, Sc, Si, Sr, Ti, V, Y, Zn and Zr). The geochemistry of the East Trinity ASS was dominated by Si, Al and Fe. The only elements that were found to exceed the interim sediment quality or soil quality guidelines were As, Ni and V. More than 75 % of the ASS samples contained As concentrations greater than the ISQG-Low and the soil EIL value. Nickel occurred in excess of the ISQG-Low value in more than 25 % of the ASS samples. Vanadium was greater than the soil EIL value in more than 75 % of the ASS samples. The elements that exceeded the ISQG-low value (i.e. As and Ni) in the ASS may cause harmful biological effects. Arsenic and V exceeded the soil EIL values, indicating that they have the potential to cause problems in susceptible biota. However, the identification of toxic effects purely from total element concentrations has major shortcomings. The availability of the “toxic” elements to organisms needs to be evaluated before environmental risk can be gauged. A hypothesis for the geochemical properties of IAASS was developed based on the expected geochemical outcomes of seawater inundation of AASS. The hypothesised geochemical properties of IAASS were: 1) a near neutral soil pH values (because of acid neutralisation by seawater); 2) enrichment in Na (from seawater); and 3) depletion in elements mobilised during PASS oxidation (i.e. Co, Mn and Zn). The hypothesis was tested using samples from the dry and wet ASS profiles. Only samples from the upper part of the wet ASS profile were found to conform to the hypothesised properties. The samples were consequentially considered IAASS. Elemental differences between AASS and IAASS were identified by comparison of the proportion of each element in AASS with IAASS relative to underlying PASS. The PASS relative element concentration in the AASS and IAASS was found by comparing their elemental concentrations with the PASS material from the same ASS profile. Arsenic, Ba, Ga, Nb, P, Si, Sr, Ti and Zr concentrations were similar to PASS in both AASS and IAASS. In contrast, Ca, Co, Cu, Fe, Mg, Mn, Ni, Pb, S, Y and Zn occurred in much smaller concentrations relative to PASS in both AASS and IAASS. Relatively less Al, Na, S, Sc and V occurred in AASS than IAASS, whereas, Fe and Pb were found in higher proportions in AASS than IAASS.. 107.
(31) Table B.11.. Reproducibility data for the plant soil EDTA extractions. Assessment for valid reproducibility was a R%D less than 30 where the value was five times greater than the detection limit and 50 for values less than five times the lower detection limit. The reproducibility of the elements in bold was not acceptable.. Element Al As Co Cr Cu Ni Pb Zn. Units µg/L µg/L µg/L µg/L µg/L µg/L µg/L µg/L. Replicate 16800 166 24.7 400 147 53.9 69.8 145. 19200 141 23.9 392 138 49.7 73.8 132. 305. R%D 13 16 3 2 6 8 6 9. Reproducibility Assessment OK OK OK OK OK OK OK OK.
(32) APPENDIX C. ASS SAMPLE DATA Table C.1.. Grain-size data for samples from the dry and wet ASS profiles. Values are percentage of sample volume passing the size class. The grain-size data are graphed in Figures C.1 and C.2 for the dry and wet ASS profiles, respectively.. Passing Size. % Clay 3.6 µm. % Silt 63 µm. Very Fine Sand 126 µm. Fine Sand 252 µm. Medium Sand 502 µm. DP2-01 DP2-02 DP2-03 DP2-04 DP2-05 DP2-06 DP2-07 DP2-08 DP2-09 DP2-10 DP2-11 DP2-12 DP2-13 DP2-14 WP2-01 WP2-03 WP2-04 WP2-05 WP2-06 WP2-07 WP2-08 WP2-09 WP2-10 WP2-11 WP2-12 WP2-13 WP2-14. 11 18 13 12 12 14 11 12 8 9 11 10 11 11 15 16 18 15 14 13 16 13 14 15 15 15 18. 55 55 48 48 58 72 60 61 35 43 58 47 57 60 75 80 81 75 69 69 72 66 65 71 75 73 79. 61 57 52 54 67 81 69 70 44 53 68 61 68 69 83 86 87 83 80 79 81 78 77 82 85 83 87. 71 68 66 69 81 91 84 87 76 79 85 79 81 81 90 92 93 90 88 88 91 93 88 91 91 91 93. 86 89 90 90 93 98 96 97 99 96 95 92 92 92 96 97 98 94 93 95 97 99 94 97 95 95 97. 306. Coarse Sand 1002 µm 98 99 100 99 99 100 100 100 100 100 99 98 100 99 99 99 100 98 98 99 99 100 98 100 99 99 100. Very Coarse Sand 2000 µm 100 100 100 100 100 100 100 100 100 100 100 100 100 100 100 100 100 100 100 100 100 100 100 100 100 100 100.
(33) Figure C.1.. Grainsize distribution for samples from the dry ASS profile.. 307.
(34) Figure C.2.. Grainsize distribution for samples from the wet ASS profile.. 308.
(35) Table C.2.. XRF data for the dry ASS profile samples DP1-1 to DP1-10 (n = 10). Data are presented as reported.. UDL LDL DP1-01 DP1-02 DP1-03 DP1-04 DP1-05 DP1-06 DP1-07 DP1-08 DP1-09 DP1-10 Depth 0.0 - 0.1 0.1 - 0.2 0.2 - 0.3 0.3 - 0.4 0.4 - 0.5 0.5 - 0.6 0.6 - 0.7 0.8 - 0.9 1.0 - 1.1 1.2 - 1.3 (m bgl) SiO2 % 62.27 68.27 67.30 64.13 60.51 59.79 62.33 63.37 59.83 48.85 TiO2 % 0.46 0.49 0.67 0.77 0.88 0.79 0.71 0.63 0.61 0.81 Al2O3 % 10.46 10.37 12.66 14.49 16.07 15.29 15.19 14.45 13.51 17.39 Fe2O3T 7.04 5.28 3.82 3.98 4.05 5.33 5.09 4.67 4.60 6.04 % MnO% 0.00 0.00 0.00 0.00 0.00 0.00 0.06 0.06 0.07 0.06 MgO% 0.32 0.32 0.39 0.52 0.67 0.71 0.76 0.89 0.86 1.33 CaO% 0.26 0.26 0.34 0.40 0.45 0.42 0.41 0.49 3.90 0.61 Na2O% 0.98 0.88 1.06 1.14 1.31 1.23 1.25 1.13 1.22 1.37 K2O% 3.05 3.15 3.09 3.01 2.61 2.58 3.16 3.33 2.90 2.12 P2O5% 0.11 0.07 0.05 0.05 0.05 0.06 0.06 0.05 0.06 0.05 SO3 % 0.03 0.01 0.01 0.01 0.02 0.03 0.04 0.06 1.13 0.14 LOI% 15.23 11.15 10.38 11.60 13.00 13.67 11.18 10.04 11.29 20.61 SUM% 100.20 100.24 99.77 100.10 99.61 99.90 100.24 99.17 99.98 99.38 As ppm 330 10 31 36 21 21 22 33 23 18 20 23 Ba ppm 4000 10 175 190 233 246 252 216 224 215 196 205 Co ppm 210 2 BD BD 3 5 5 20 19 13 10 13 Cr ppm 4000 3 105 119 118 116 114 109 108 102 110 93 Cu ppm 2360 3 9 7 6 7 12 13 15 11 12 16 Ga ppm 40 3 15 15 18 18 21 19 19 18 17 20 Mn ppm 2500 4 95 93 97 120 138 277 376 444 591 369 Nb ppm 268 2 9 10 14 15 17 14 13 13 11 15 Ni ppm 2360 3 11 11 16 17 19 30 29 25 22 33 Pb ppm 133 10 26 22 22 18 19 26 27 27 28 26 Rb ppm 1300 2 169 180 178 172 154 159 190 206 174 140 Sc ppm 55 3 10 11 12 13 17 15 14 14 16 15 Sr ppm 700 2 70 61 67 74 82 74 68 69 213 85 Ti ppm 22600 5 4570 4487 5698 6090 6345 5997 5559 5288 5484 6049 V ppm 526 4 49 48 58 64 70 75 77 65 73 83 Y ppm 720 2 18 20 21 23 25 24 25 30 28 30 Zn ppm 290 3 35 35 37 45 50 59 83 64 58 75 Zr ppm 490 3 165 170 207 241 234 233 217 200 213 167 UDL = Upper Detection Limit. LDL = Lower Detection Limit. NA = Not Analysed. BD = Below Detection Limit.. 309.
(36) Table C.3.. XRF data for the wet ASS profile samples WP1-1 to WP1-11 (n = 11). Data are. presented as reported. UDL LDL WP1-01 WP1-02 WP1-03 WP1-04 WP1-05 WP1-06 WP1-07 WP1-08 WP1-09 WP1-10 WP1-11 Depth - 0.0-0.15 0.15-0.3 0.3-0.4 0.4-0.5 0.5-0.6 0.6-0.7 0.7-0.8 0.8-0.9 0.9-1.0 1.0-1.1 1.1-1.2 (m bgl) SiO2% 51.52 57.93 60.57 57.10 52.82 53.69 55.02 57.09 57.97 55.24 54.75 TiO2% 0.67 0.67 0.73 0.80 0.75 0.73 0.78 0.76 0.72 0.84 0.76 Al2O3% 15.29 14.43 15.10 15.14 14.62 14.04 15.45 15.86 14.96 15.86 15.85 Fe2O3T 5.91 2.80 2.44 2.22 2.30 1.99 4.33 4.93 6.00 5.80 5.86 % MnO% BD BD BD 0.02 BD 0.01 BD 0.06 0.07 0.07 0.06 MgO% 0.83 0.69 0.72 0.65 0.82 0.63 0.84 0.93 1.04 1.08 1.07 CaO% 0.47 0.45 0.43 0.42 0.45 0.37 0.42 0.46 0.54 0.58 0.56 Na2O% 2.21 1.85 2.10 2.15 2.37 2.14 2.06 1.90 1.50 1.64 1.79 K2O% 2.50 2.71 2.81 2.53 2.24 2.37 2.41 2.57 2.55 2.48 2.59 P2O5% 0.14 0.09 0.07 0.06 0.06 0.06 0.06 0.06 0.05 0.06 0.06 SO3 % 0.12 0.08 0.07 0.11 0.11 0.13 0.15 0.16 0.10 0.25 0.12 LOI% 21.19 18.00 15.71 18.69 24.16 23.97 19.00 14.96 15.22 16.14 17.41 SUM% 100.84 99.70 100.73 99.89 100.71 100.13 100.53 99.72 100.71 100.03 100.87 As ppm 330 10 56 31 20 15 32 35 39 28 32 24 25 Ba ppm 4000 10 210 181 241 196 213 207 223 187 204 224 218 Co ppm 210 2 2 5 6 4 5 BD 16 17 13 20 13 Cr ppm 4000 3 94 91 128 129 95 136 93 97 93 124 87 Cu ppm 2360 3 15 7 8 10 16 10 14 9 15 12 14 Ga ppm 40 3 20 18 19 17 19 15 20 18 19 16 19 Mn ppm 2500 4 127 101 123 80 89 81 192 346 438 686 360 Nb ppm 268 2 12 10 13 18 7 18 12 14 13 22 13 Ni ppm 2360 3 15 11 14 18 14 17 25 26 29 38 29 Pb ppm 133 10 28 16 14 19 13 23 23 37 27 32 27 Rb ppm 1300 2 170 167 170 136 136 127 149 168 163 144 167 Sc ppm 55 3 15 13 17 7 16 8 15 13 16 11 13 Sr ppm 700 2 85 71 67 70 73 63 72 72 74 78 76 Ti ppm 22600 5 4819 4298 4744 3319 5313 3939 5757 4606 5673 4635 5546 V ppm 526 4 91 67 77 52 98 65 86 65 69 74 74 Y ppm 720 2 27 29 30 25 24 22 25 29 31 31 40 Zn ppm 290 3 50 42 46 38 43 35 56 61 70 76 81 Zr ppm 490 3 202 217 239 204 190 177 202 238 200 220 212 UDL = Upper Detection Limit. LDL = Lower Detection Limit. NA = Not Analysed. BD = Below Detection Limit.. 310.
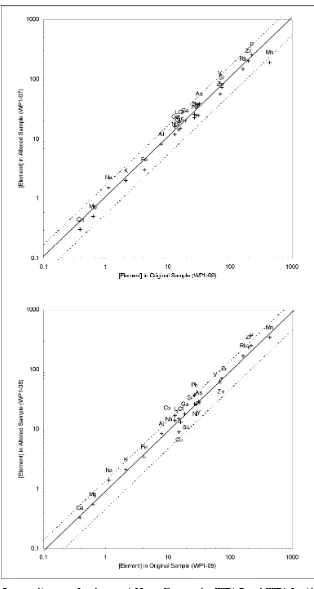
(37) APPENDIX D. ISOCON DIAGRAMS. Figure D.1.. Isocon diagrams for the dry ASS profile samples DP1 and DP2. All major elements except P are given as percentages. The concentrations of all other elements are in ppm. Isocon analysis used DP1-9 as the original sample.. 311.
(38) Figure D.2.. Isocon diagrams for the dry ASS profile samples DP1-3 and DP1-4. All major elements except P are given as percentages. The concentrations of all other elements are in ppm. Isocon analysis used DP1-9 as the original sample.. 312.
(39) Figure D.3.. Isocon diagrams for the dry ASS profile samples DP1-5 and DP1-6. All major elements except P are given as percentages. The concentrations of all other elements are in ppm. Isocon analysis used DP1-9 as the original sample.. 313.
(40) Figure D.4.. Isocon diagrams for the dry ASS profile samples DP1-7 and DP1-8. All major elements except P are given as percentages. The concentrations of all other elements are in ppm. Isocon analysis used DP1-9 as the original sample.. 314.
(41) Figure D.5.. Isocon diagrams for the wet ASS profile samples WP1-1 and WP1-2. All major elements except P are given as percentages. The concentrations of all other elements are in ppm. Isocon analysis used WP1-9 as the original sample.. 315.
(42) Figure D.6.. Isocon diagrams for the wet ASS profile samples WP1-3 and WP1-4. All major elements except P are given as percentages. The concentrations of all other elements are in ppm. Isocon analysis used WP1-9 as the original sample.. 316.
(43) Figure D.7.. Isocon diagrams for the wet ASS profile samples WP1-5 and WP1-6. All major elements except P are given as percentages. The concentrations of all other elements are in ppm. Isocon analysis used WP1-9 as the original sample.. 317.
(44) Figure D.8.. Isocon diagrams for the wet ASS profile samples WP1-7 and WP1-8. All major elements except P are given as percentages. The concentrations of all other elements are in ppm. Isocon analysis used WP1-9 as the original sample.. 318.
(45) Depth 1.00 0.76 -0.13 -0.36 0.03 0.86 0.30 -0.20 -0.32 -0.10 0.10 0.11 -0.33 -0.30 0.83 0.69 0.40 0.11 0.16 0.64 0.42 0.21 0.01 0.37 0.39 -0.21 0.71 0.22 0.73 0.84 0.55 0.76 0.51 0.08 0.53 -0.41 -0.52 -0.19 0.67. 1.00 0.14 0.02 0.41 0.64 -0.18 -0.54 -0.39 0.02 0.37 0.37 -0.45 -0.31 0.82 0.80 0.37 -0.19 0.23 0.82 0.22 -0.11 -0.07 0.41 0.11 -0.31 0.51 0.11 0.47 0.45 0.41 0.51 0.34 0.10 0.31 -0.56 -0.08 -0.11 0.78. pH. 1.00 0.28 0.23 -0.07 -0.28 -0.18 0.16 0.19 0.35 0.24 -0.40 -0.31 -0.19 0.06 0.13 -0.33 0.20 -0.21 0.02 -0.09 -0.12 0.11 -0.21 0.13 -0.39 -0.37 -0.33 -0.35 -0.02 -0.41 -0.15 0.03 -0.41 -0.30 0.27 0.24 0.16. 1.00 0.69 -0.33 -0.74 -0.60 -0.25 0.08 0.34 0.45 -0.24 -0.15 -0.18 -0.17 -0.23 -0.07 -0.07 0.03 0.06 -0.36 0.12 0.08 -0.17 0.08 -0.40 -0.24 -0.17 -0.33 -0.18 -0.29 0.00 0.05 -0.36 -0.16 0.56 0.40 0.03. Ox pH Clay. 1.00 0.09 -0.81 -0.92 -0.55 0.11 0.62 0.76 -0.49 -0.40 0.22 0.23 0.13 -0.06 0.09 0.40 0.30 -0.35 0.27 0.44 0.00 -0.14 -0.09 -0.18 0.17 0.01 0.19 0.10 0.36 0.21 -0.09 -0.56 0.50 0.23 0.43. Silt. 1.00 0.22 -0.29 -0.30 0.07 0.36 0.36 -0.53 -0.50 0.78 0.66 0.47 0.02 0.19 0.52 0.45 0.10 -0.07 0.49 0.31 -0.24 0.59 0.21 0.61 0.74 0.69 0.65 0.53 0.08 0.52 -0.62 -0.47 0.06 0.76. VFS. 1.00 0.74 0.15 -0.35 -0.66 -0.62 0.47 0.41 0.10 0.05 0.08 0.22 0.08 -0.11 -0.10 0.44 0.08 -0.17 0.18 0.07 0.51 0.16 0.28 0.39 0.03 0.31 -0.07 -0.11 0.38 0.46 -0.75 -0.34 -0.14. FS. 1.00 0.50 -0.26 -0.73 -0.83 0.57 0.52 -0.34 -0.32 -0.15 0.11 -0.04 -0.46 -0.38 0.38 -0.17 -0.43 0.00 0.21 0.07 0.23 -0.20 -0.07 -0.25 -0.11 -0.38 -0.13 0.11 0.66 -0.37 -0.15 -0.58. MS. 1.00 0.53 -0.16 -0.43 0.11 0.07 -0.48 -0.32 -0.01 -0.21 -0.09 -0.53 -0.28 0.21 -0.42 -0.41 -0.26 0.11 -0.46 0.07 -0.61 -0.44 -0.15 -0.47 -0.43 -0.09 -0.32 0.27 0.02 0.05 -0.42. CS. 1.00 0.41 0.25 -0.33 -0.40 -0.18 -0.03 0.09 -0.49 -0.09 -0.19 -0.11 -0.20 -0.47 -0.17 -0.36 -0.16 -0.48 -0.10 -0.48 -0.37 0.18 -0.38 -0.23 -0.06 -0.25 -0.28 0.33 0.27 0.10. VCS. 1.00 0.85 -0.87 -0.77 0.24 0.20 0.22 -0.24 -0.03 0.14 0.38 -0.29 -0.27 0.46 -0.01 -0.21 -0.30 -0.13 -0.08 -0.04 0.41 -0.09 0.36 0.17 -0.14 -0.91 0.36 0.43 0.59. LOI. 1.00 -0.72 -0.63 0.28 0.26 0.12 0.01 0.11 0.31 0.42 -0.33 0.04 0.54 0.11 -0.05 -0.20 -0.37 0.03 0.00 0.39 0.01 0.40 0.24 -0.15 -0.78 0.27 0.21 0.57. Na. 1.00 0.88 -0.39 -0.38 -0.43 0.09 -0.15 -0.23 -0.58 -0.02 0.22 -0.52 -0.17 0.15 0.10 0.04 -0.13 -0.23 -0.57 -0.09 -0.51 -0.30 0.06 0.90 -0.10 -0.42 -0.61. K. 1.00 -0.18 -0.17 -0.23 0.09 0.09 -0.06 -0.70 0.12 0.15 -0.24 -0.35 -0.09 0.21 0.19 -0.10 -0.24 -0.34 0.05 -0.46 -0.03 0.16 0.74 0.00 -0.24 -0.50. Rb. 1.00 0.88 0.58 0.08 0.39 0.86 0.32 0.21 0.00 0.64 0.15 -0.49 0.78 0.41 0.73 0.72 0.70 0.84 0.61 0.34 0.58 -0.55 -0.29 -0.04 0.71. Mg. 1.00 0.74 0.01 0.50 0.85 0.29 0.20 0.09 0.53 0.09 -0.43 0.68 0.29 0.52 0.50 0.59 0.67 0.53 0.34 0.43 -0.50 -0.20 -0.16 0.63. Ca. 1.00 0.06 0.49 0.45 0.39 0.48 0.20 0.47 0.05 -0.43 0.49 0.43 0.37 0.40 0.57 0.50 0.56 0.41 0.34 -0.46 -0.15 0.05 0.41. Sr. 1.00 0.29 0.11 0.45 0.55 0.66 0.33 0.46 0.23 0.23 -0.22 0.38 0.29 0.02 0.32 0.44 0.40 -0.11 0.18 -0.34 -0.28 -0.21. Ba. 1.00 0.38 0.07 0.63 0.22 0.67 -0.30 -0.40 0.33 0.09 0.32 0.06 0.51 0.35 0.28 0.79 -0.10 -0.10 -0.13 0.06 0.03. Sc. 1.00 0.30 0.07 0.22 0.46 0.23 -0.38 0.67 0.26 0.62 0.54 0.44 0.73 0.56 0.34 0.39 -0.37 -0.16 -0.24 0.53. Y. 1.00 0.25 0.42 0.34 0.68 0.14 0.17 -0.10 0.50 0.57 0.30 0.36 0.84 0.25 -0.06 -0.45 -0.32 -0.13 0.31. Ti. 1.00 0.25 0.35 0.05 -0.33 0.31 0.23 0.38 0.31 0.35 0.39 0.35 0.71 -0.04 0.12 -0.50 -0.02 -0.27. Ti. 1.00 0.15 0.40 0.23 0.30 -0.26 0.42 0.23 -0.21 0.27 0.34 0.13 -0.08 0.24 -0.19 -0.39 -0.11. Zr. 1.00 -0.10 -0.42 0.36 0.14 0.52 0.34 0.77 0.56 0.62 0.70 0.15 -0.61 0.04 0.28 0.49. V. 1.00 0.50 0.24 -0.11 0.33 0.61 -0.05 0.31 0.51 -0.13 0.21 -0.10 -0.51 -0.40 0.13. Nb. 1.00 -0.29 -0.47 -0.30 -0.13 -0.52 -0.41 -0.21 -0.53 -0.21 0.34 -0.02 -0.35 -0.16. Cr. Fe. 1.00 0.52 1.00 0.80 0.29 0.78 0.41 0.40 0.40 0.87 0.53 0.46 0.27 0.12 0.13 0.76 0.68 -0.05 -0.08 -0.49 -0.06 -0.21 0.31 0.43 0.09. Mn. Ni. 1.00 0.86 1.00 0.48 0.51 0.88 0.86 0.65 0.70 0.29 0.12 0.44 0.66 -0.18 -0.28 -0.47 -0.62 -0.12 -0.13 0.37 0.47. Co. Zn. 1.00 0.65 1.00 0.59 0.69 0.60 0.39 0.39 0.66 -0.64 -0.24 -0.12 -0.41 0.33 -0.10 0.49 0.40. Cu. 1.00 0.50 0.28 -0.55 -0.26 0.00 0.41. Al. 1.00 -0.16 -0.26 -0.08 0.19 -0.09. Ga. Si. 1.00 -0.18 1.00 -0.27 -0.15 0.06 -0.39 0.48 -0.76. Pb. 1.00 0.39 -0.02. P. 1.00 0.10. As. medium sand; CS is vol.% coarse sand; VCS is vol.% coarse sand.. 319. S. 1.00. Spearman’s correlation coefficients for ASS samples from the dry and wet ASS profiles. Significance values (for n = 21) are 0.562 for p = 0.99 and 0.428 for a = 0.95.. Depth refers to depth in the ASS profiles; pH is soil pH, Ox pH is oxidises soil pH; Cy is vol.% clay, St is vol.% silt, VFS is vol.% very fine sand; FS is vol.% fine sand; MS is vol.%. Depth Soil pH Ox pH Clay Silt VFS FS MS CS VCS LOI Na K Rb Mg Ca Sr Ba Sc Y Ti Ti Zr V Nb Cr Mn Fe Co Ni Cu Zn Al Ga Pb Si P As S. Table E.1.. APPENDIX E. ASS CORRELATION MATRIX.
(46) APPENDIX F. SEQUENTIAL EXTRACTION DATA FOR ASS SAMPLES Table F.1.. Free water loss (weight percent) from sequential extraction soil samples. Free water is defined as the water lost from the soil samples after two centrifuge runs of 20 min at 3000 g each.. Sample DP2-01 DP2-02 DP2-03 DP2-04 DP2-05 DP2-06 DP2-07 DP2-08 DP2-09 DP2-10. Table F.2. Sample DP2-01 DP2-02 DP2-03 DP2-04 DP2-05 DP2-06 DP2-07 DP2-08 DP2-09 DP2-10. wt.% water loss after centrifuging 0 3 6 7 6 7 9 6 9 11. Sample WP2-01 WP2-02 WP2-03 WP2-04 WP2-05 WP2-06 WP2-07 WP2-08 WP2-09 WP2-10. wt.% water loss after centrifuging 13 8 11 10 13 15 12 5 4 6. Total moisture content of soil materials used in sequential extraction procedures. wt.% total water loss (after drying) 22 23 28 27 31 34 30 -. 320. Sample WP2-01 WP2-02 WP2-03 WP2-04 WP2-05 WP2-06 WP2-07 WP2-08 WP2-09 WP2-10. wt.% water loss (after drying) 32 31 31 33 36 36 38 -.
(47) Dry Mass AEC Al ppm As ppb Ba ppb Co ppb Cr ppb Cu ppb Fe ppm Ga ppb Mn ppb Na ppm Nb ppb Ni ppb Pb ppb Sc ppb Ti ppb V ppb Zn ppb Zr ppb AmFeOx Al ppm As ppb Ba ppb Co ppb Cr ppb Cu ppb Fe ppm Ga ppb Mn ppb Na ppm. 27.5 205 91.2 2.09 61.4 38.6 254 9.6 69 83.6. 23 173 93.4 2.63 54.6 33.1 198.5 9.07 86 76.9. 37.1 121 113 3.7 55.9 69.1 289 9.95 102 118. 36 85.7 88.3 4.64 52.8 74.5 171 9.09 120 95.7. 34.5 94.3 107 9.83 57.1 56 118 8.82 275 66.9. 2.61 <= 2 4.75 32.9 38.8 28.3 7.33 1.15 167 11100 4.99 23 14.9 11.1 47.5 15.5 38.9 1.19 89.1 26.7 63.9 81.2 77.2 50.5 170 16 3150 81.7. 6.54 25.9 8.18 113 18.6 20.9 10.8 0.923 1520 4720 0.136 152 18.9 24.1 120 12.2 223 2.1 44.8 7.63 85.5 38.27 93.7 27 109 18 1270 81.2. 2.32 12.5 13.6 18.4 13.6 76.2 3.25 1.07 876 4700 0.126 56.3 11.6 21.9 98.2 19.8 39.6 1.83 51.8 114 89.1 7.92 51.8 35.8 167 12.5 135 75.3. 5.89 12.3 23.3 7.08 43.2 28.4 11.5 5.07 102 10800 2.45 12.4 36.2 8.41 173 49.4 48.6 4.88 40.9 248 155 4.93 71.3 36.3 228 14.8 122 51.5. 2.78 21.2 40.7 3.18 51.3 39.2 24.1 4.42 102 10200 1.8 11.1 37.5 11.1 175 44.3 40.2 5.25. 321. - Table Continued Next Page -. 70.4 7.96 84.4 40.7 91.8 26.1 111 18.9 1130 83.1. 2.29 12.3 12.1 29.1 14 64.4 5.3 1.13 547 4700 0.152 67.6 7.72 16.3 115 15.9 56.7 1.59 34.8 111 92.4 5.02 51 33.3 123 11.1 121 71.5. 3.38 18 21.1 3.58 45.9 28.3 12.5 4.38 95.7 9880 1.12 12.3 29.4 10 174 44.5 40.3 5.51 32.3 37.9 26.9 3.71 37 16.9 23.8 6.32 51.8 76.9. 11.5 40.8 14.8 5.47 65.8 37.4 4.51 10.9 109 9680 1.36 12.4 51.3 13.7 246 118 53.2 5.31 39.6 43.2 25.2 4.58 31.1 14.7 22.9 6.56 62.3 70.6. 14.7 44.7 11.5 7.85 57.3 44.2 4.51 10.8 107 11400 1.35 14.9 39.2 13.5 214 141 49.2 5.02 53.2 64.9 26.2 5.22 35.9 19.1 26.2 6.68 71 91.9. 12.2 71.9 10.2 6.9 52.4 36.6 3.66 9.74 89.3 9270 1.05 14.4 43.1 14.4 229 149 47.8 5.33. 52.6 72.2 42.6 6.74 39 22.2 36 8.03 124 103. 15.6 79.3 11.5 8.1 57 38.4 4.79 10.2 95.2 11400 0.823 15.4 48.1 15.6 209 173 52.7 5.4. 34.8 38.3 76.9 19.8 40.7 44.6 36.3 11 364 42.8. 50.3 215 28.1 48.3 67.8 110 36 19.7 244 4710 0.158 115 85.2 85.5 220 139 108 4.27. 64.3 42.4 108 36.8 72 19.8 77.8 13.6 716 75.1. 2.12 28.8 7.57 107 12.2 127 6 0.643 346 4680 0.0554 169 31.2 31.6 71.3 40.8 85.3 1.54. 84.7 18.2 89.8 46.2 92.7 18.5 120 16.2 1170 83.6. 4.15 24.1 10.5 82.1 13.5 118 9.27 1.22 363 4710 0.099 192 25.1 31.6 122 31.6 170 2.18. 0.154 <= 0.5 0.589 <= 0.05 2.44 6.51 0.0807 <= 0.05 0.273 3.71. 17.6 283 95.8 2.34 73.9 43.8 323 10.4 75.2 73.8. 2.01 <= 2 4.75 2.66 41.1 36.2 4.79 1.21 88.1 12200 11.4 9.75 8.22 12.7 55.2 13.2 35.2 1.41. 110 164 122 8.05 94.5 63.6 361 12 198 96.5. 1.92 <= 2 4.56 2.85 42 36.9 3.78 2.76 83.4 11400 10.7 9.49 4.38 13.1 210 12.1 32.4 3. <= 0.5 <= 2 2.1 0.687 14 26.9 0.144 0.722 3.78 10100 0.563 10.6 0.589 9.97 10.7 <= 0.5 28.4 0.194. 5.4 3.36 4.07 3.52 59.6 34.2 14.5 7.23 93 11700 6.17 11.5 1.64 14.3 260 23 42.2 4.71. 6.45 18.5 5.98 3.56 55.8 29.3 10.1 5.1 117 11500 0.223 9.54 1.41 26.1 235 18 36.3 4.32. 8.74 2.99 1.83 4.8 33.3 13.5 6.54 0.762 202 10400 0.142 11.5 2.81 13.9 27.5 1.3 43.7 4.91. 5.59 9.87 5.18 3.5 58.8 36.3 11.7 5.41 153 11000 1.95 14.6 2.25 21.4 232 16.8 49.6 3.89. Blank -. values were determined indirectly.. fraction (Res) of each sample is marked “Res” if the residual fraction was determined directly, or “Bulk” if determined indirectly. All residual Co. mL (x2), amorphous Fe oxide (AmFeOx) = 40 mL (x2), crystalline Fe oxide (CryFeOx) = 60 mL (x2), and oxidisable (Ox) = 45 mL. The residual. GSC-SEP element data for ASS samples. The volumes of the fraction extractions were: Adsorbed, Exchangeable, Carbonate bound (AEC) = 40. DP2-01 DP2-02 DP2-03 DP2-04 DP2-05 DP2-06 DP2-07 DP2-08 DP2-09 DP2-10 WP2-01 WP2-02 WP2-03 WP2-04 WP2-05 WP2-06 WP2-07 WP2-08 WP2-09 WP2-10 0.8499 0.8395 0.7855 0.8008 0.7554 0.728 0.7637 0.79 0.79 0.79 0.7472 0.76 0.7603 0.7386 0.7051 0.6994 0.6793 0.73 0.73 0.73. Table F.3..
Figure


+7


Related documents
• Taxpayers subject to the provisions of Title II of the Income Tax Law (ITL) which have declared taxable income of $644,599,005 or more in the immediately preceding tax
Parr and Shanks [18] classify ERP implementations to three broad categories (comprehensive, middle road, and vanilla) and according to them ERP implementations differ with respect
The algorithm will only match applicants employers preferred for NESP positions to NESP positions and applicants employers preferred for NETP positions to NETP positions. This way
In the previous sections, we dis- cuss the expectation that a neural network exploiting the fractional convolution should perform slightly worse than a pure binary (1-bit weights
• Our goal is to make Pittsburgh Public Schools First Choice by offering a portfolio of quality school options that promote high student achievement in the most equitable and
Political Parties approved by CNE to stand in at least some constituencies PLD – Partido de Liberdade e Desenvolvimento – Party of Freedom and Development ECOLOGISTA – MT –
During the thesis work, I measured six different parameters: the number of emergency processes, hash table entry number, caching replacement policy, cache entry
Comments This can be a real eye-opener to learn what team members believe are requirements to succeed on your team. Teams often incorporate things into their “perfect team
