Effects of blasting on the stability of paste fill stopes at Cannington Mine
25
0
0
Full text
(2) Chapter 1 - Introduction. 1. Introduction 1.1.. General. Cannington Mine is an underground lead-silver-zinc mme that is located in north-west Queensland, approximately 220 kilometres south-east of Mount Isa. The mine, which is the world's largest single mine producer of silver, is owned and operated by BHP Minerals. Cannington is the first mine in Australia to use the open stoping mining method with postplaced paste fill. The ore is mined in sections, referred to as 'stopes'. Once the ore from a stope is removed, the stope is filled with paste fill to give support to the mine. Paste fill consists of mine tailings with a typical effective grain size of 5 urn mixed with a small percentage of cement binder.. 1.2. Problem Statement Paste fill is used in mines to fill the voids left by mining and to provide stability during the remaining mining sequence. As the mining sequence progresses, and stopes adjacent to the fill are mined, the fill is subjected to blasting loads, and subsequently exposed. This may happen several times during the mining sequence as additional stopes are mined in the area. During this time, the fill must remain stable as it provides local and regional support to the mine. If the fill fails and falls into the void left by the mining, the processing cost increases, as additional material must be processed, with no additional materials produced. The stability of the fill is also a serious safety issue for the mine as failure of the fill could potentially result in the loss of life. Cement is added to the paste to increase the strength of the material, with strength increasing as cement content increases. However, the cost of adding cement to the fill is high, with filling of the stopes costing 20 % of the entire mining operations. If the cement content could be reduced by 1 %, it would result in a saving of approximately one million dollars per year. It is therefore necessary to optimize the cement content ofthe paste, ensuring that adequate cement is added to maintain stability while minimizing the cost. As a result of research on the static stability of cement-based fills, the cement content of such fills has been reduced. However, as the cement content is reduced, a concern arises over the stability of the fill during dynamic events it is exposed to such as blasting. More research is necessary into the dynamic aspects of cemented backfill to ensure that these fills will remain stable. One of the reasons research may be limited is due to the complexity of the mechanics of transfer of explosive energy to rock and to paste, and the resulting stress wave field.. 1.
(3) Chapter 1 - Introduction Several numerical models of blasting have been created, however the majority of these models consist of a single blast hole located in a uniform mass of rock.. A few researches have. modelled the effects of an explosive blast on cemented backfill (refer to section 2.5.5), however, these studies have not considered the effects of multiple blasts on the backfill.. During a. production blast in a mine, multiple blast holes are detonated with small delays between detonations. The blast wave from each blast hole is transmitted to the backfill material, and due to the effects of reflection of the waves within the backfill, these waves can combine to produce larger peak particle velocities within the backfill than would be created by a single blast hole. Therefore, the effects of multiple blast holes must be considered when predicting the effect of blasting on nearby backfill material.. 1.3. Objectives The objectives ofthis thesis are to: •. Develop a computer-aided model to predict dynamic response of paste fill due to blast loading using commercially available finite element software packages;. •. Measure blast response in paste fill and verify developed computer models using these measurements; and. •. Estimate the blast damage using predicted response for different scenarios and assess the stability of paste fill stopes during and after blasting. 1.4. Relevance ofResearch The cost of backfilling the mine is the single greatest expense at Cannington Mine, contributing to 20 % of the total costs. As the cost of adding cement to the tailings contributes to a great proportion of this cost, it is necessary to minimize the amount of cement added to the paste fill. However, the strength ofthe paste fill is dependent on the amount of cement added to the fill. It is therefore necessary to determine the amount of cement required to maintain the stability of the mine. As a res ult of research into the static stability of paste fill, the cement content of paste fills has been reduced. However, the paste fill is also subjected to blast loadings from mining adjacent to the fill, leading to concern over the stability of fills with reduced cement content. Little research has been conducted to determine the effects of blast loading on paste fill, and such research will be relevant to the mines around the world.. 1.5.. Thesis Overview. This chapter introduced the research problem and the objectives of this research and has identified the relevance of the research.. Chapter 2 reviews previous research that has been. conducted into paste fill. Previous numerical modelling of blasting is also covered in this. 2.
(4) Chapter 1 - Introduction extensive literature review. This review also covers the various factors involved with the static and dynamic analysis of cemented backfills. Chapter 3 describes the field monitoring that was undertaken at Cannington Mine during blasting carried out adjacent to an instrumented paste fill stope. The data obtained from the monitoring are analysed and the conclusions drawn from these data are presented, including observed behaviour of the blast waves travelling through the boundary between ore and paste fill and peak particle velocities at which damage to the paste fill is observed to occur. Chapter 4 presents the results of a set of field tests in which a number of blasts were monitored in a paste fill stope. The data obtained from these tests were used to obtain a relationship between the peak particle velocity and distance from a blast in paste fill, to determine a blast loading function to apply in a numerical model, and to validate the numerical models. Chapter 5 covers a laboratory testing program in which stress waves were produced in columns of paste fill. Effects of curing age, cement content and solids content of the paste fill on wave propagation were analysed. Chapter 6 outlines methods for numerically modelling blasting in the scale required for this research, and identifies the need for a Blast Loading Function. The development of the loading function is presented in this chapter. The development of a finite element model to study the effects of blasting in an underground mine is presented in Chapter 7. This chapter includes a general overview of finite element modelling, including the capabilities of the numerical modelling program ABAQUS/Explicit which was used for this research. An overview of the models used in this research is given, and the model parameters used in each model are presented. Chapter 8 presents results of the numerical models. Chapter 9 provides a summary and conclusions ofthe research and some recommendations for future research.. 3.
(5) Chapter 2 - Literature Review. 2. Literature Review The following chapter reviews previous research that has been conducted into modelling of blasting, and studies of paste fill. This review also covers the various factors involved with the static and dynamic analysis of cemented backfills.. 2.1. Blasting Before the effects of blasting can be modelled, the mechanics of an explosive blast must be known. Experiments have indicated that when an explosive detonates in a blast hole in rock, the chemical reaction produces a gas at a very high temperature and pressure. This gas exerts a very high pressure on the blast hole walls, pushing the walls outwards and shattering the rock surrounding the blast hole. The high pressure sends a stress wave through the rock, which expands cylindrically from the blast hole. The tangential stress from this wave causes radial cracks to occur around the blast hole. The gases then expand into the cracks surrounding the blast hole, opening up the cracks and reducing the pressure of the gas. If the stress wave encounters a free boundary, the compressional wave is reflected back as a tensional wave, and cracking known as spalling may occur at the boundary if the tensile stress of the wave is larger than the tensile strength ofthe rock (Atchison 1968). Damage to the rock structure during blasting occurs as a result of the stress wave, and the explosion gas. Experimental study has shown that the stress waves causes cracks in the rock, and the explosion gases separate this crack pattern (Liu and Katsabanis 1997). The diameter of the fraction zone was found experimentally to approach 6 hole diameters for a spherical charge and 9 hole diameters for a cylindrical charge (Kutter and Fairhurst, 1971).. 2.2. Wave Propagation When a column of explosive detonates in a rock mass, stress waves are generated and travel through the solid. It is therefore necessary to have an understanding of these stress waves and how they behave in order to model such waves. The behaviour of such waves is complex, particularly near borders between two media.. 2.2.1. Types of Waves Three separate groups of waves can be identified from seismographic records. The first group of waves to arrive are dilatation waves which have the highest velocity, followed by distortion waves. Finally, the surface waves, or Rayleigh waves arrive. These waves have a larger amplitude than either dilation or distortion waves (Kolsky, 1963).. 4.
(6) Chapter 2 - Literature Review There are two types of waves that can be propagated through an elastic solid, p-waves and swaves. The particle motion of p-waves, which are also known as dilatational or compressional waves or longitudinal waves, is in the direction of propagation, and the particle motion of a swave, which is also known as a distortional or shear wave, is perpendicular to the direction of propagation. Other types of waves can also be propagated ifthe solid has a boundary. Rayleigh waves can be at a free surface, and in a similar fashion, Love waves can be propagated at a surface boundary between two surface boundaries. For an isotropic elastic solid, p-waves travel at the velocity given by:. ~J;[+2,u. c. (2.1). P. P. where, cp = speed ofthe p-wave p = density of the solid. Ie and Il = Lame's Constants The motion of these waves is along the direction of propagation, and these waves involve no rotation (Kolsky 1963). For an isotropic elastic solid, s-waves travel at the velocity given by the following equation.. The motion of these waves is transverse and parallel to the wave front. (Kolsky 1963).. cs. =l p. (2.2). where, c, = speed ofthe s-wave Rayleigh waves are elastic surface waves that can occur when a bounding surface is present. The velocity of propagation of Rayleigh waves is smaller than that of dilatation or distortion waves. The effect of a Rayleigh wave decreases rapidly with depth, although there is no finite depth at which motion in a direction normal to the surface vanishes. Rayleigh waves of high frequency will be attenuated more rapidly with depth than those of low frequency. There are both horizontal and vertical components of Rayleigh waves, and in theory the vertical component should dominate (Kolsky, 1963).. 5.
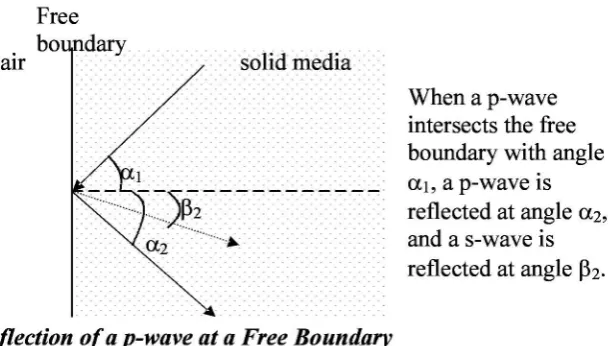
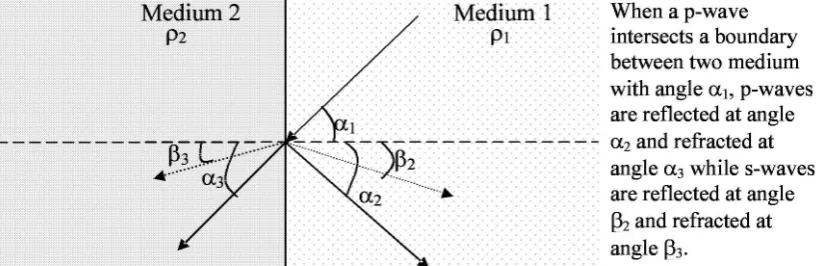
(7) Chapter 2 - Literature Review. 2.2.2. Behaviour of Waves at Boundaries When either a p-wave or an s-wave intersects with a boundary, both reflection and refraction of that wave occur. The reflected and refracted waves generally consist of waves of both types, with a total of four waves leaving the boundary, two reflected and two refracted waves. When a wave intersects with a boundary between a solid media and a vacuum, there are no refracted waves. Similarly, at a boundary between a solid and air, it can be assumed that there are no refracted waves. The reflection of a p-wave at a free boundary is shown in Figure 2.1. The solid lines in the figure represent p-waves and the dashed line represents an s-wave.. solid media. 1. --'\;-----------J.pz -. ..:~. When a p-wave intersects the free boundary with angle aI, a p-wave IS reflected at angle az, and a s-wave is reflected at angle pz.. Figure 2.1 - Reflection ofa p-wave at a Free Boundary If the incident wave is at right angles to the boundary, there is no distortion wave, and therefore the amplitude of the reflected wave is equal to the amplitude of the incident wave.. The. reflection of an s-wave at a free boundary is very similar. When a wave intercepts an interface between two media, reflection occurs similar to that at a free surface, and two waves are refracted, as shown in Figure 2.2. The solid lines in this figure represent s-waves and the dashed lines represent p-wave. When the incident dilatation wave intersects the boundary at right angles, only dilatation waves are generated. When an s-wave intersects with a boundary between two media, reflection and refraction occur in a similar manner. The amplitude of the reflected stress wave depends on the characteristic impedance of the medium, pc. No wave will be reflected at normal incidence when the product of the density and velocity is the same for the two media.. 6.
(8) Chapter 2 - Literature Review ····························.·.·.· Mediu.m. l·.···. When a p-wave intersects a boundary .............. ·······················.·.·.·.·.·.·.·.·.·.Pl.·.··· between two medium ..............••••••••••••••••••••••••••••••••••••••••••••••••••• with angle aI, p-waves are reflected at angle ..... .·-.. .· . .i> .. az and refracted at . .. . . . .. . . ., : . ~2 •••••••••••••••••••••••••••••••••••••• angle a3 while s-waves ......... .': are reflected at angle Bz and refracted at angle 133. .............. -) .~.~ .~. ~ ~.~~ .~.~ .~ .~ ._ .-. : ~. Figure 2.2 - Reflection and Refraction of a p-Wave at a Boundary Between Two Media. 2.3. Peak Particle Velocity As discussed in section 2.1, upon the detonation of an explosive, the reaction produces gaseous products which are under high pressure. These gases expand, causing the borehole walls to move outwards and creating a dynamic stress field in the surrounding rock. An expanding stress field is set up in the rock mass as the gas continues to expand. The motion spreads in the form of waves: p-, and s-waves, each of which has a characteristic propagation velocity in a given material. These stress waves expand through the solid causing ground vibration. This ground vibration causes the particles in the rock mass to run through an elliptical motion, and the highest velocity experienced by the particle is known as the peak particle velocity (ppv) (Holmberg and Persson, 1979).. Experimental evidence has shown that the peak particle. velocity of the wave decreases with distance from the charge. The propagation velocity of the p- and s-waves and their behaviour at boundaries between two different materials was discussed in section 2.2. The peak particle velocity, which can be measured experimentally with geophones, has been observed in studies of blast vibration. The focus of many of these studies has been on the blast vibration occurring in the material located at a distance from the explosive source, which is known as the far field. The far field is the name given to the region that is located at a sufficient distance from the explosive source that the explosive source can be treated as a point source. As a result of these studies, theories of blast vibration in the far field have been reasonable well established (Yang et al. 1994), and have resulted in the observation of the charge-weight scaling law, which is discussed in section 2.3.1. The peak particle velocity has been used to estimate blast damage, as Holmberg and Persson (1979) showed that at a critical level of peak particle velocity, permanent damage to the rock mass occurs. This concept is discussed further in section 2.3.3.. 7.
(9) Chapter 2 - Literature Review. 2.3.1.. The Charge-Weight Scaling Law. Holmberg and Persson (1979) studied the peak particle velocities experienced at a distance from an explosive charge. The study showed that the peak particle velocity decreases with distance from the explosive source, and can be predicted by the following equation, which is known as the charge-weight scaling law.. (2.3). where ppv = peak particle velocity W = charge weight R = distance k, «, ~ = constants specific to the site The constants depend on the material properties of the rock mass at the site, and on the units the charge weight, distance and peak particle velocity are specified with.. Equation 2.3 was. developed from data mainly from far-field vibration measurement (Yang et al. 1994), and is suitable for prediction of the peak particle velocity in the far field or from a point source.. 2.3.2.. Prediction of Peak Particle Velocity for a Column Explosion. Equation 2.3 can be used to predict the peak particle velocity in the far field or from a point source.. However, studies have shown that this equation does not accurately predict peak. particle velocities in the near field (Yang et al. 1994). Figure 2.3 shows a typical blast hole arrangement consisting of a blast hole is filled with explosive, and 'stemmed' with an inert material. In this situation, equation 2.3 is only valid when the distance from the charge is large in comparison to the charge length and the charge can be treated as concentrated (Holmberg and Persson, 1979). Holmberg and Persson modified equation 2.3 by integrating the equation over the length of the explosive column to predict the peak particle velocity from a blast hole loaded with explosives in the near field, resulting in the following equation:. (2.4). where, ppv = peak particle velocity, (m/s). 8.
(10) Chapter 2 - Literature Review L = linear charge density, (kg/m) k, a, 13 are site specific constants. Ro = the horizontal distance between the explosive and the geophone (m) m = the angle shown in Figure 2.3 (radians) H = the height of the explosive in the blast hole (m) x. Blasthol~. t. ~. .•. Stemmmg -+-_--+l/xplosive • Geophone H :;~. ----L_ _. dx. L..J".-::::.i.·§:::. .. Figure 2.3 - Geometry of a Blast Hole Loaded With Explosives For blast waves in rock, 13 is often approximately equal to 2a, for example, for hard bedrock k = 700, a = 0.7 and 13 = 1.5 ifW, Rand ppv are measured in the units given with equation 4.2 (Holmberg and Persson, 1979). Equation 2.3 has an analytical solution for the case when. a = 1Iz13, (Persson et al. 1994, Sartor 1999) which is of the form:. [m - arctan(R tanliJ-H]J% R [ L]% o o. ppv = k R. 0. (2.5). Sartor (1999) used this equation to model the vibration induced damage from blasting at Cannington Mine. Data such as the timing and amplitude of the peak particle velocity were measured, using a set of geophones, and a site-specific vibration equation for Cannington Mine was developed. The constants in the equation were found to be: k = 2938, a = liz 13 = 0.66. The column version of the charge-weight scaling law (equation 2.5) can predict the peak particle velocity in the near field, however the user must be aware that it has the limitations listed below. Despite these limitations, the charge-weight scaling law is widely used. •. In order to the equation to predict realistic values, the constants must be obtained specific to the site. Yang et al. (1994) demonstrated this by estimating values of peak. 9.
(11) Chapter 2 - Literature Review particle velocity by equation 2.3, using site parameters for the equation 2.3 typical of the value recommended for many far-field vibration predictions (k = 700, a = 0.7,. ~. =. 1.5), integrated over the charge length (i.e. the process used to obtain equation 2.5). These values were compared against the monitored blast vibration and its attenuation in the near-field of a 2.4 m long column of emulsion explosive. The values predicted with the equation were found to be significantly lower than the measured values in the near field. •. Although equation 2.5 can give some acceptable predictions is calibrated to the site, it cannot provide any understanding ofthe wave propagation (Yang et al., 1994).. •. The charge-weight scaling laws (equations 2.3, 2.4 and 2.5) do not provide an insight into any blast mechanisms and do not predict vibration variations with time. They only provide a simple engineering method of estimating peak particle velocity measured as a function of charge weight and distance (Blair and Minchinton, 1996).. •. The charge-weight scaling laws do not take into account the effect of any joints or other discontinuities in the rock. If such discontinuities occur, the vibration response from a blast hole becomes complicated due to wave reflection and refraction (Blair and Jiang, 1995).. Due to the limitations of the charge-weight scaling law, numerical modelling has been used by numerous authors to predict the effects of blasting on the surrounding area. This is discussed in section 2.5.2.. 2.3.3.. Prediction of Damage using Peak Particle Velocity. Prediction of damage due to an explosive blast is complicated and depends on a number of factors including the strength ofthe rock mass in which the blast hole is located, the presence of any joints and fissures in the rock mass, the charge size and the spacing between blast holes. However, the peak particle velocity has been used to make reasonably reliable predictions of where rock damage will occur from an explosive charge and of the degree of fragmentation that will occur in the near field (Persson et al., 1994). This method has been used for a number of purposes including quantitative predictions of fragmentations for different blast hole arrangements and for predicting damage to the remaining rock. In order to use this method, the peak particle velocity is correlated to levels of damage found through experiments.. For. example, the peak particle velocities characteristic of different levels of damage for hard Scandinavian granitic or gneissy bedrock is given in Table 2.1 (Persson et al., 1994).. 10.
(12) Chapter 2 - Literature Review The estimation of damage from peak particle velocity is based on the assumption that stress, and therefore damage, is proportional to peak particle velocity.. This relationship between peak. particle velocity and stress is implied by the following simple equation for stress caused by a stress wave in a bar:. (2.6). where. 0". = stress. ppv = peak particle velocity c = the wave propagation speed E = Young's Modulus. Table 2.1 Peak Particle Velocity - Damage Correlation (Persson et aI. 1994) Peak Particle Velocity (m/s). Characteristic Level of Damage for Hard Scandinavian Granitic Bedrock. 0.7 to 1. Slight swelling and slightly decreased shear strength. 2.5. Fragmentation begins to become marginal. 5. Very good fragmentation mainly along planes of weakness Crushing ofthe granite. 15. A similar relationship was used by Baylot (1993) who predicted the stresses impacting on under reinforced concrete structures from explosives. Baylot (1993) estimated the peak stress in the soil mass by multiplying the peak particle velocity by the acoustic impedance using the following equation: (Y. where. =. ppvxpc. (2.7). p = density. 11.
(13) Chapter 2 - Literature Review The method of predicting peak particle velocity to predict damage is useful where an indication of where damage might occur is needed, such as in a situation where different blast hole layout patterns are to be compared. However, this method cannot give exact calculations of where damage will occur as it does not take into consideration many factors which affect blast damage, including: •. The shape of the waveform and the duration of the dynamic loading. These factors are important as if the duration of the stress is too short, the stress from the blast wave may exceed the material strength and not cause damage.. •. The presence of any joints in the rock mass and their effect on blast damage are not taken into account.. •. The velocity of detonation ofthe explosive material is not taken into account.. •. The presence of any free surfaces in the vicinity must be taken into account. These free surfaces were considered in the predictions given in Table 2.1.. 2.4. Cemented Backfill in Underground Mining 2.4.1. Commonly Used Backfills A variety of different types of backfills are available for use in underground mines. Some ofthe commonly used backfills are as follows: •. Hydraulic Fill: the product resulting from the partial dewatering of the tailings (Cowling et al., 1983). •. Cemented Hydraulic Fill (CHF): produced by mixing hydraulic fill and cementing agents. (Cowling et al., 1983). •. Rockfill: crushed rock. At Mount lsa Mines, the rock is crushed to 300 mm and screened at 25 mm. (Cowling et al., 1983). •. Cemented Rockfill: produced by mixing rockfill and cemented hydraulic fill. (Cowling et al., 1983). •. Pastefill: mine tailings with a typical effective grain size of 5 urn mixed with a small percentage of cement binder.. 2.4.2. Paste Fill Cannington Mine uses the open stoping mining method in conjunction with post-placed backfill. The ore body is divided into a series of stopes, which are volumetric units in the shape of a rectangular prism. These stopes are mined systematically over time, and the void is filled with. 12.
(14) Chapter 2 - Literature Review backfill. The type of backfill used at Cannington mine is known as paste fill, which consists of mine tailings, water and approximately 4 % of cement. Paste fill is a relatively new technology that is used to fill the voids left by mining. There are a number of benefits in the use of paste fills, including an effective means of tailings disposal, improvement of local and regional rock stability, greater ore recovery and reduced environmental impacts. Paste fill is also used in a number of mines in Canada.. 2.4.3. Static Stability of Paste Fill Bloss et al. (1993) reported the results of a number of investigations conducted at Mount Isa Mines. The distribution of the fill material within the stope was predicted, and the stability of the stope was modelled using TVIS, a three-dimensional elasto-plastic finite-element program. Most of the model predictions were conservative. The few cases where the fill was predicted to be stable and failure occurred were thought to be due to the effects of blasting or weak fill, which were not considered in this model. In order to model the static stability of the stope, the complete extraction and filling process around a given stope was modelled. This extraction sequence is shown in Figure 2.4. One of the major conclusions drawn by Bloss et al. (1993) was the importance of simulating the extraction and filling of adjacent stopes in a systematic manner in order to accurately model the stresses in the fill.. 4. 3. IThill 2. 1. 876. Figure 2.4 -Typical Extraction Sequence Around a Backfilled Stope Bloss and Greenwood (1998) reported on further study conducted with the TVIS model. Improvements to the model showed that the original model had underestimated the confining stresses on the middle stope, which resulted in overestimating the vertical stress and the instability. This new set of modelling reported by Bloss and Greenwood (1998) found that the arching mechanism was dominant in stabilising the fill. A series of laboratory tests was carried out to determine the behaviour of paste fill from Cannington Mine. Total stress parameters were obtained from the paste fill under unconfined compression, confined triaxial compression and tension (Rankine et al., 200 I). The results of the laboratory tests were used as input parameters to a stability analysis.. Rankine (2000). developed a model of the extraction, filling and curing of an idealized nine-stope arrangement. 13.
(15) Chapter 2 - Literature Review using FLAC 3D , a finite difference numerical modelling package.. The idealised nine-stope. arrangement used by Bloss et al. (1993) was used to simplify the complex mining sequence. The results of this model showed that the primary stope was most stable when completely surrounded by rock. As the surrounding stopes were excavated and filled, the vertical stresses in the primary stope increased due to the progressive loss of arching. A number of mines in Canada use paste fill instead of other alternatives such as slurry or cemented rock fill systems. This use of pastefill has sparked some research into the behaviour of the paste fill. The Golden Giant Mine in Canada began using paste fill in 1996. As a result of this change to paste fill, Pierce et al. (1998) conducted laboratory testing and stability analysis of paste backfill. The laboratory tests involved unconfined and triaxial compression tests, and confined compression tests on samples with a solids density of 75 %, and cement binder contents of 3, 5, and 7 % by dry weight. The cement content consisted of a 50:50 mix of Portland cement and type C fly ash. A stability analysis was conducted for mining by blast hole open stoping methods, with cemented backfills. Safety factors against failure of the fill were obtained using limit equilibrium methods and the stability was then modelled numerically using FLAC 3D . For this model, a confined block failure mechanism proposed by Mitchell et al. (1982) was assumed. The factor of safety against failure for this failure mechanism is given by:. cD =. w cos e tan ¢ + dDw /cose n. /. Wn sine. (2.8). where <1> = factor of safety Wn = net weight of sliding block 8 = angle of failure plate from horizontal = 45+<1>/2 <I>. = fill friction angle. d = fill cohesion D = distance between hanging wall and foot wall w = strike length The net weight of sliding block without surcharge is:. 14.
(16) Chapter 2 - Literature Review. (2.9). where h=fill height h*=effective sliding block height = H-(w tana)/2 y = fill unit weight. K, = I-sino From these equations, it was found that the factor of safety decreases with increased stope width for a given binder content and curing time. As the binder content and curing time increases, the factor of safety also increases.. 2.5. Modelling an Explosive Blast Numerical modelling has been used to model explosive blasts in order to improve understanding of the mechanics of a blast. The development of computer codes has allowed the use of numerical modelling packages to be used to improve the models of blasting. This has allowed a much more detailed prediction of blast damage than is possible with the use of the chargeweight scaling laws (equations 2.3 and 2.5), as the numerical models are not limited by all of the same assumptions and simplifications on which the charge-weight scaling laws are based. The influence of factors such as the material properties of the surrounding rock mass, the velocity of detonation of the explosive and the effect of nearby free surfaces can be included in the model.. This allows an understanding of the effect of each of these factors on the. transmission of the blast wave through the rock mass to be studied.. 2.5.1.. The Concept of an "Equivalent Cavity". One of the earliest models was produced by Sharpe (1942) who developed a solution for stress distribution around a spherical explosive source. Sharpe (1942) modelled the explosive source by applying a transient cavity pressure to the wall of a spherical cavity. The pressure function used was applied to the walls of an "equivalent cavity" instead ofthe physical walls ofthe blasthole itself. The radius of the cavity was set a distance from the blast hole wall that ensured that the strength of the material is greater than the stresses experienced from the shock wave. Outside this "equivalent cavity" elastic wave propagation only is expected to occur. Sharpe (1942) showed that vibration predictions based upon pressure functions applied to the walls of an equivalent cavity gave reasonable agreement with blast vibration field measurements. This concept has been used by many authors since Sharpe (1942) developed it.. 15.
(17) Chapter 2 - Literature Review The radius to use for an "equivalent cavity" was obtained by Kutter and Fairhurst (1971). Kutter and Fairhurst (1971) studied the fracture process in blasting with experiments and numerical modelling. The concept of an "equivalent cavity" as proposed by Sharpe (1942) was used in the numerical modeling. Through experimental work, the diameter ofthe fractured zone around an explosion as found to approach 6 hole diameters for a spherical charge and 9 hole diameters for a cylindrical charge. The stress field generated by the pressurized gas in this starcracked cavity was shown to be identical to that of a pressurized and uncracked 'cavity' whose diameter is equal to that ofthe fractured zone. An explosive charge was modelled by applying a pressure to the walls of an "equivalent cavity". In order to avoid modeling the cracking process, the cavity was sized so that no crushing occurs around the blast hole. Cracks in the rock are generated when the pressure experienced by the rock is higher than the dynamic compressive strength of the rock. Therefore, at the point where new cracks are no longer initiated, the peak wall pressure is equal to the dynamic compressive strength of the rock. This point was found to occur at approximately 4 times the cavity radius for a spherical charge and approximately 6 times the blast hole radius for a cylindrical charge. A higher radius is required for a cylindrical charge because the rate of attenuation of the blast wave is smaller than for a spherical charge.. 2.5.2.. Modelling a Cylindrical Charge. The model produced by Sharpe (1942) was for a spherical blast. However, in applying the modelling to a blast hole, a model of a cylindrical charge was required. Starfield and Pugliese (1968) modelled a cylindrical charge by discretising the charge into a set of charge segments, each of which was represented by a spherical charge. The blast load was modelled by applying a pressure with a sine wave function to the walls of the cavity. The strains and stresses at any point could then be determined numerically.. The model predictions from this model were. generally found to be in good agreement. The method of using a stack of spherical charges to model a cylindrical charge was also used by Harries (1990) and Zou (1990). Zou (1990) considered a cylindrical charge as the superposition of spherical charges. Using the stress wave theory in the spherical coordinate system and the superposition principle, the 3-D distribution of average energy densities of the stress wave in the rock mass was calculated. Harries (1990) simulated a cylindrical charge by using a string of spheres. He calculated the radial stress, tangential stress, axial stress, strain energy per unit length and displacement expected by a string of spherical charges and compared the results against that expected for an infinitely long cylinder. He found that the stress distribution around a cylinder can be simulated. 16.
(18) Chapter 2 - Literature Review by a string of spheres, if the spheres have the same radius as the cylinder, and the centre of the spheres are spaced one radius apart. The dynamic case was modelled by superimposing the results of spherical charges spaced one radius apart with a time delay between each sphere corresponding to the velocity of detonation of the explosive.. Harries (1990) found that in order to correctly model a dynamic blast,. attenuation and dispersion must be taken into account. This was achieved using the constant Q model of proposed by Kjartansson (1979). By using a value of Q = 4.5, good agreement was found between theory and experimental results. Work by other authors suggested that the radiation from a vertical cylindrical source in an infinite half-space cannot be accurately represented by a model of stacked spheres (Blair and Jiang, 1995). Blair and Jiang (1995) found the use of a finite element model to produce more acceptable results.. They modelled a single blast hole using an axisymmetric model and. applying a blast load as a time-varying pressure applied to the walls of an "equivalent cavity" as proposed by Sharpe (1942). This model was used to study the influence of charge length upon blast vibrations, assuming that the explosives have an infinite velocity of detonation (i.e. the entire column of explosive detonates simultaneously). The results showed that when the charge length was greater than a critical value, the peak particle velocity experienced in the surrounding rock mass did not increase. This is because the charge weight in the borehole is proportional to the charge length. This finding shows why the weightllength value is used in the charge weight scaling laws for column charges.. 2.5.3.. Applying the Blast Load. One of the first considerations in creating a numerical model of an explosive blast is applying a blast load to the model. The method of applying the blast load that is most appropriate for a model depends on the purpose of the model. Rock damage and fragmentation from blasting is caused by stress waves and gas penetration.. It is very difficult to model both of these. mechanisms in a combined model (Yang et al., 1996). Generally, only one ofthese mechanisms is modelled, and the appropriate mechanism is dependent on the purpose of the model. If the rock damage caused by the stress wave is of interest, appropriate blast loading methods include applying a time varying pressure to the walls of an "equivalent cavity". If the fragmentation caused by the gas penetration is of interest, appropriate blast methods include applying a time varying pressure to the walls of the blast hole column and modelling the chemical reaction in a blast hole using the Jones-Wilkens-Lee (JWL) Equation of State Material Model.. 17.
(19) Chapter 2 - Literature Review. 2.5.3.1.. Applying a Blast Load to the Walls ofan "Equivalent Cavity". The advantages of this method are that it accurately models the effects ofa blast load to the rock mass surrounding the cracked region and is numerically efficient which means that the model will often solve in a reasonably short time frame. The disadvantages are that this method does not provide accurate model results in the cracked region surrounding the blast hole and is therefore not suitable for some applications.. This method is typically used to model the. transmission of the shock wave through the material when the effect of the rock mass or structures within the rock mass is of interest. In order to use this method, it is necessary to determine an appropriate pressure load to apply.. The load is applied as a time-varying load which typically increases in magnitude very quickly to a maximum value and decreases to zero. A variety of different pressure loads have been used by different authors. A summary ofthe most commonly used pressure loads is given below. Several authors including Jiang et al. (1995), Minchinton and Lynch (1996), Blair and Minchinton (1996) and Blair and Jiang (1995) used a loading function ofthe form: (2.10) where pet) = pressure as a function oftime Po = maximum pressure. t = time <p = decay factor. n = integer Jiang et al. (1995) used this source function to model a spherical source in an elastic and viscoelastic material, while Blair and Jiang (1995) modelled the surface vibrations caused by a vertical column of explosive by applying this pressure function to the walls of an "equivalent cavity" as defined by Sharpe (1942).. The effect of the source parameters nand <p were. investigated. Peak particle velocity was found to increase with <p for n= 1, and to decrease with n for <p = 2000. Small values of n were used in both ofthese cases. Olofsson et al. (1999) modelled ground shock wave propagation usmg FLAC, a twodimensional finite-difference numerical modelling package. The purpose of this modelling was to consider the effect of explosive loads from bombing in the design of underground civil. 18.
(20) Chapter 2 - Literature Review defence structures. A spherical explosive source was assumed for this scenario. The computer program CONWEP was used to estimate the explosion effects from a conventional bomb and to estimate crater dimensions and peak particle velocities at a set number of points. These peak particle velocities were used to obtain a pressure load that was applied to the crater boundary using the crater dimensions estimated by the computer program CONWEP.. The load was. normal to the crater boundary and uniformly distributed along the crater boundary. Olofsson et al. (1999) support the method of applying loads at the boundary of the crater created by blasting, particularly when the numerical modelling code is not well suited to modelling the detonation and formation of a crushed zone. O'Hearn and Swan (1989) modelled the response of a sill mat of cemented hydraulic fill to blast loads using UDEC, a explicit, time marching, distinct element code. The blast, a sinusoidal pulse with a duration of 10 ms and a frequency of 100 Hz, was applied to one side of the model. Several other authors have also used sinusoidal pulses, including Todo and Dowding (1984). Sarracino and Brinkmann (1990) conducted experiments to determine which mechanisms participate in production blasting. The results of these experiments demonstrate that the use of an "equivalent cavity" to model blasting produces reasonable results. As discussed in section 2.1, blast damage is caused by two different energy sources: stress wave and gas penetration. These sources act almost instantaneously, making it difficult to resolve their effects. Sarracino and Brinkmann (1990) studied only the stress loading on the rock experimentally by preventing the gases from penetrating the surrounding rock by lining the blast hole with a metal tube which was closed at the bottom. The acceleration and strain measurements were compared against measurements for normal blast holes and showed that the character of the shock transmitted to the rock was the same. The results of this experiment indicate that a numerical model which models only the effects of the stress wave will produce acceptable results if the user is not interested in the crushing caused by the gas penetration.. Sarracino and Brinkmann (1990). modelled this explosive column in DYNA2D, an explicit two-dimensional finite element code.. 2.5.3.2.. Applying a Blast Load to the Walls ofthe Blast Hole. The advantages of this method are that this method accurately models the effects of a blast load to the rock mass surrounding the blast hole, including the cracked region. The disadvantages are that this method is numerically expensive due to complex cracking models and the small mesh sizes that are required. This method is typically used to model the cracking in the region immediately surrounding the blast hole. It is not generally used for large scale models. In order to use this method, it is necessary to determine an appropriate pressure load to apply.. As for blast loads applied to the walls of an "equivalent cavity", the load is applied as a time-. 19.
(21) Chapter 2 - Literature Review varying load which typically increases in magnitude very quickly to a maximum value and decreases to zero. The form of the pressure load is used for both cases. A summary of the most commonly used pressure loads is given in section 2.5.3.1.. 2.5.3.3.. Modelling the Chemical Reaction in a Blast Hole. A third method of applying a blast load to a numerical model is to model the blast load. The Jones-Wilkens-Lee (JWL) equation of state material model (Lee et al., 1973) has been used by several authors for this purpose, including Liu and Katsabanis (1996), Thome et al. 1990 and Yang et al. (1996). The advantages ofthis method are that it accurately models the explosion in the blast hole, the loading on the rock mass surrounding the blast hole and the cracking surrounding the blast hole. The disadvantages are that this method is numerically expensive due to the complex reactions that occur in the blast hole and the complex cracking model sand small mesh sizes that are required. This method is typically used to model the cracking in the region immediately surrounding the blast hole. It is not generally used for large scale models. The JWL equation of state material model is discussed in section 6.5.4. Some cases where the JWL equation of state material model have been used are described below. Daehnke et al. (1996) used a coupled solid, fluid and fraction mechanics numerical model to analyse the gas driven fracture propagation phase, to predict propagation rates and to give insights into the pressure profiles and gas velocities within the fractures. The results of the numerical modelling showed that dynamic material properties significantly influence propagation rates and need to be incorporated in the numerical analyses. The results from the numerical model were found to give similar results to laboratory experiments conducted as part ofthis research. Yang et al. (1996) presented a constitutive model for blast damage resulting from impulsive loading from stress waves. ABAQUS/Explicit was used to model confined blast, axisymmetric model, with an axis of symmetry down centre of borehole. The blast load was applied by modelling the explosion using the JWL Equation of State model. A user-defined subroutine was used for the material model. This model was validated by reproducing the observed crated shape from field experiments of single hole blasts.. The model results indicated that. comparisons between measured and calculated vibration waveforms provide one approach to the development and verification of numerical models for damage prediction. Liu and Katsabanis (1997) modelled rock fragmentation from blasting by developing a continuum damage model. Once the model was developed, the dynamic finite element program ABAQUS/Explicit (version 5.3) was used to solve the problem.. The system of equations. developed in the model was coded into ABAQUS through user-defined subroutines. Liu and. 20.
(22) Chapter 2 - Literature Review Katsabanis (1997) solved several problems, demonstrating the suitability of their damage model for blasting analysis. These problems were run in three-dimensional space, however, they were small scale models, as full-scale modelling would have required extreme computer resources. The element size close to the explosive was 80mm x 80 mm x 100 mm. Therefore, applying such a model to the full sized stopes with heights of up to 100 metres would require a lot of computer resources.. 2.5.4.. Modelling Multiple Blast Holes. Many studies were found where blast holes were modelled. However, the majority of these studies consisted of axisymmetric models with the centre line along the centre of the blast hole. Few of these studies included multiple blast holes, or three-dimensional models.. One of the. few studies to include multiple blast holes was by Preece and Thome (1996). Preece and Thome (1996) modelled the detonation of two blast holes located 3 m apart using the dynamic finite element computer program PRONTO-3D, a numerical modelling package developed at Sandia National Laboratories.. The model was produced to model the effect of detonation. timing on fragmentation, and used a damage constitutive model to simulate the dynamic fracture of rock. This damage constitutive model was based on tensile failure and was unable to predict damage in compression.. The explosive detonation was modelled with detonation. beginning at the bottom of each explosive column and was modelled with a controlled bum based on a specified detonation velocity. Although this model produced acceptable results for the two blast holes, the complexity of model required approximately 4 days of CPU time to solve.. Therefore, this approach would not be suitable to model the number of explosive. columns used in a production blasts due to the time that would be required to solve the model.. 2.5.5.. Modelling the Effects of a Blast on Cemented Backfill. Many researches have modelled the effects of an explosive blast on cemented fill, using both physical models and numerical modelling. A summary ofthese studies is given in the following section. O'Hearn and Swan (1989) modelled the stability of cemented hydraulic fill. A numerical model was produced of a sill mat composed of cemented hydraulic fill. A sill mat is a thin bedded plug that is situated below weaker backfill and used to support the overlying fill when mining underneath the stope. As seismic events in the region were known to cause failure, O'Hearn and Swan (1989) produced a model in the numerical modelling package UDEC, an explicit, time marching, distinct element code, to study the response of the cemented fill to seismic events. The blast load was applied as a sinusoidal pressure pulse with a duration of 10 ms and a frequency 100 Hz. From this project, it was found that peak particle velocities between 200 and. 21.
(23) Chapter 2 - Literature Review 300 mmls in the fill, caused the collapse of the overlying fill. This study focused on seismic. events occurring in the far field, with the nearest blast 20 m from the fill. In another study, Lilley (1994) researched the near field effects of blasting on cemented. hydraulic fill, and developed a mathematical model to determine the effects of blasting on cemented hydraulic fill (CHF). Lilley and Chitombo (1998) continued this research, improving the model. A transmission of blast vibrations was modelled from the source, through ore, across the ore/CHF interface, and into the CHF mass using a vibration transfer model. A number of assumptions were made to simplify the model. The results demonstrated the dependence of the model on the source. The source was assumed to be a point in the model produced by Lilley, while Lilley and Chitombo (1998) assumed a cylindrical source. As a result, Lilley's model predicted a low likelihood of damage, while Lilley and Chitombo's model predicted plastic deformation in the CHF, near the interface for a source located 5 metres from the ore/CHF interface with a peak particle velocity of 1500 mmls at the source, a velocity typical from blasting in hard rock (Pierce 2001). In one another study, Itasca (Pierce 2001) used the numerical modelling package FLAC, the. two-dimensional version of FLAC 3D , to simulate blast and impact loadings on fill. A two dimensional model was used, and the blast was simulated by applying a velocity pulse at the centre of the pillar. A number of assumptions and simplifications were used in the development of this model; however, this model was useful for an initial assessment of the stability of fill under blasting loads. Physical models have also been used to predict the effect of blasting on nearby cemented backfill. Nnadi (1990) used scale models to determine the stability of cemented backfills under dynamic loading.. Nnadi (1990) found that centrifuge modelling with increased gravity. loadings was required to obtain accurate results from scale models. Nnadi and Mitchell (1991) reported the results of centrifuge models used to simulate blast loadings and predict the response of cemented mine backfills, using impact loading to simulate a blast. This experiment proved centrifuge modelling to be a useful tool for blast studies, although the impact load could not easily be correlated to a given blast energy in the field. Mitchell and Nnadi (1994) continued the centrifuge study, using a centrifuge model to evaluate the effect of dynamic loads caused by ring blasting on the stability of an exposed face of tailings. The loads induced no static failures. This experiment indicated that the probability of ring blasting producing ore dilution from this type of backfill is low.. 22.
(24) Chapter 2 - Literature Review. 2.6. Summary Much research has been conducted on the processes involved in blasting and in modelling an explosive blast. This research has shown that the damage to a rock structure due to blasting results from two mechanisms, the effects of the explosion gas and the transmission of a stress wave. Experimental study indicates that the stress wave causes cracks in the rock which the explosion gases expand into and separate the crack pattern. The motion from a blast spreads in the form of waves which expand through the solid causing ground vibration. The highest velocity experienced by a particle is known as the peak particle velocity. The peak particle velocity of the wave decreases with distance from the explosive source. The peak particle velocity can be used to estimate blast damage, as experiments have shown that permanent damage to the rock occurs at a critical peak particle velocity. This is based on the assumption that stress, and therefore damage, is proportional to peak particle velocity. Equations 2.3 and 2.5 have been developed to predict the peak particle velocity in the far field and the near field respectively. These equations contain constants which are specific to a given site. Sartor (1999) used equation 2.5 to determine the constants for these equations for rock at Cannington Mine. The constants for these equations for paste fill at Cannington Mine are presented in this chapter 4 ofthis dissertation. Equations 2.3 and 2.5 have several limitations in predicting the peak particle velocity in a realistic rock mass. For example, these equations do not predict vibration variations with time, and they do not take into account the effect of any joints, discontinuities or free surfaces in the rock. For this reason, numerical modelling has been used to predict the effects of blasting on the surrounding area. Some ofthe models that have been created include the following: •. Modelling a spherical explosive charge. One of the earliest models was created by Sharpe (1942). Sharpe (1942) modelled the spherical explosive charge by applying a pressure to the wall of an "equivalent cavity", rather than to the physical walls of the physical cavity.. This ensured that the elastic wave propagation only had to be. modelled. Kutter and Fairhurst (1971) later determined that the radius of the equivalent cavity should be approximately 4 times the cavity radius for a spherical charge and approximately 6 times the cavity radius for a cylindrical charge. •. Modelling a column explosive charge. The earliest models of a cylindrical charge involved modelling the charge as a stack of spherical charges (Starfield and Pugliese, 1968; Harries, 1990; and Zou, 1990). However, work by other authors found that the. 23.
(25) Chapter 2 - Literature Review use of a finite element model produced more acceptable results (Blair and Jiang, 1995). Many authors have produced numerical models of a single column of explosive in a uniform material. This has allowed simplifications such as the use of axisymmetric models to be used in order to reduce the computing time of the model. While this approach is useful for studying the effects of blasting surrounding a single blast hole, this method is not able to predict the effect of production blasting in rock on nearby fill. •. Modelling multiple blast holes. While the majority of the studies consisted of models of a single blast hole, a few studies included multiple blast holes. One such example was Preece and Thome (1996) who modelled two blast holes located 3 m apart using a 3-dimensional model. This model was reported to produce acceptable results, however the complexity of the model required approximately 4 days of CPU time to solve. The solving time makes the production of larger models consisting of many blast holes impractical.. •. Modelling the effects of a blast on cemented backfill. A number of studies were found where the effects of an explosive blast were modelled.. O'Hearn and Swan (1989). modelled the effects of blasting on a sill mat composed of cemented hydraulic fill. A model of the sill mat and the overlying weaker backfill was produced and the blast load was applied to the side of the model to simulate the blast loading expected in the far field, with the nearest blast load 20 m from the fill. Lilley (1994) modelled the near field effects of blasting on cemented hydraulic fill, and the work was continued by Lilley and Chitombo (1998). A transmission of blast vibrations was modelled from the source through the ore and across the interface into the cemented hydraulic fill. Pierce (2001) used a two dimensional model to study blast and impact loadings on fill. In this model the blast was simulated by applying a velocity pulse at the centre of the pillar. Although a large number of numerical models of blast loads have been produced, few of these models consider the effect of blasting in rock on nearby backfill and none of these models predict the effect of the detonation of multiple blast holes in rock on nearby backfill.. A. production blast in a mine involves the detonation of multiple blast holes with small delays between each blast. The blast wave from each blast hole is transmitted to the backfill material, and due to the effects of reflection of the waves within the backfill, these waves can combine to produce larger peak particle velocities within the backfill than would be created by a single blast hole. Therefore, it is important to consider the effects of multiple blast holes. The objective of this thesis involve the development of a computer-aided model to predict the dynamic response of paste fill due to blast loading from one or more blast holes located in nearby rock.. 24.
(26)
Figure
Related documents
Characterisation and Corrosion Performance of MultilayerNano Nickel Coatings on AZ31 Magnesium Alloy
It can be seen that single electroless Ni coating has a ‘cauliflower-like’ structure (Figure 2a), including a few micro cracks marked in the figure. These defects can
J.K.K.Nattraja College of Pharmacy,Komarpalayam Page 13 colorectal cancer include familial adenomatous polyposis and hereditary non- polyposis colon cancer, however,
The wild-type and pRB-1B-5 viruses showed similar replication curves, while the copy numbers of the pRB-1B-1 and pRB-1B-2 viruses were approximately 10-fold lower at various time
results of this study support the idea of a connection between H pylori infection and the occurrence of anti- TPO, anti-Tg autoantibodies and AT in young patients with T1DM,
However, including soy- beans twice within a 4-yr rotation decreased cotton seed yield by 16% compared to continuous cotton across the entire study period ( p < 0.05); whereas,
The objective of the current ongoing trial is to study the effectiveness of septoplasty (with or without concurrent turbinate surgery) as compared to non-surgical management for
Biofilm production by selected strains of bacteria (a) and yeasts (b) in the presence of Textus bioactiv, Textus multi dressings, and culture broth without dressing.. The figures
The most important contributions of this paper are (i) the proposal of a concern mining approach for KDM, what may encourage other groups to start researching on
