Education & Training
Behaviour in Scottish Schools 2012
BEHAVIOUR IN SCOTTISH SCHOOLS 2012
Carolyn Black, Vickie Chamberlain, Lorraine Murray, Kate Sewel,
Justin Skelton
Ipsos MORI Scotland
The views expressed in this report are those of the researcher and do not necessarily represent those of the Scottish Government or
Scottish Ministers.
© Crown Copyright 201
Limited extracts from the text may be produced provided the source is acknowledged. For more extensive reproduction, please contact the
Queens Printers of Scotland, Admail, ADM 4058, Edinburgh EH1 1NG. Email: [email protected]
This report is available on the Scottish Government Social Research website www.scotland.gov.uk/socialresearch.
Table of Contents
EXECUTIVE SUMMARY I
1 INTRODUCTION AND METHODS 1
2 POSITIVE BEHAVIOUR 7
3 LOW-LEVEL DISRUPTIVE BEHAVIOUR 14
4 SERIOUS DISRUPTIVE BEHAVIOUR/VIOLENCE 21
5 FACTORS WHICH INFLUENCE EXPERIENCES OF BEHAVIOUR 30
6 BEHAVIOUR POLICY AND PRACTICE 35
7 CASE STUDY TOPICS 50
EXECUTIVE SUMMARY
Introduction and methodology
This national study is the latest in the series of Behaviour in Scottish Schools
research projects and builds on previous research carried out in 20091 and 20062. It was commissioned by the Scottish Government Education Analytical Services, on behalf of the Learning Directorate Support and Wellbeing Unit. The overall aim of the research was to provide a clear and robust picture of behaviour in publicly funded mainstream schools and of current policy and practice in relation to managing behaviour.
There were three strands to the research:
• quantitative surveys of heads, teachers and support staff (4,898 staff in total took part)
• qualitative depth interviews with local authority representatives (one representative from 31 of the 32 local authorities)
• qualitative research with pupils, heads, teachers and support staff in 12 case study schools.
What type of pupil behaviours do school staff encounter?
The survey asked primary and secondary staff about how well behaved pupils were in general and also about how often they had experienced a range of specific positive, low-level disruptive and seriously disruptive/violent behaviours, both in the classroom and around the school, in the last full teaching week.
Overall behaviour
Overall, both primary and secondary staff were very positive about pupils’ behaviour. They felt that most pupils were well behaved all or most of the time, and only a very small minority of pupils were quite disruptive.
Positive behaviour
The vast majority of primary staff said that they encountered positive behaviour ‘all’ or ‘most’ of the time:
• 99% of primary heads said that all or most of their school roll were well behaved. 93% of primary teachers and 90% of primary support staff stated that pupils were generally well behaved in all or most of their lessons. The majority of secondary staff were also positive about pupil behaviour:
• 99% of secondary heads reported that all or most pupils were generally well behaved in the classroom. 88% of secondary teachers and 61% of secondary support staff reported that pupils were generally well behaved in all or most of their lessons.
Of specific behaviours in the classroom, teachers were most likely to encounter ‘pupils contributing to class discussions’ and least likely to see ‘pupils settling down quickly. Whereas around the school, teachers were most likely to encounter ‘pupils greeting staff pleasantly’ and least likely to see ‘pupils challenging others’ negative behaviour’.
Low-level disruptive behaviour
Low-level disruptive behaviours were much more common than serious disruptive behaviours or violence - and were felt to have more of a day-to-day impact on the learning environment.
The most common type of low-level disruptive behaviour in the classroom was ‘talking out of turn’. This was experienced at least twice a day by between a third (66%) and three quarters (78%) of staff in both primary and secondary schools. Only 3% of teachers had not encountered this behaviour in the last week.
Around the school, the most common types of low-level disruptive behaviour were ‘running in the corridor’ (seen by nearly a third of teachers at least twice a day) and - in secondary schools only - ‘using mobile phones against school policies’ (seen by 42% of secondary teachers and 12% head teachers at least twice a day).
From a list of both low-level and serious disruptive behaviours, teachers and support staff were most likely to say that low-level behaviours had the greatest negative impact on their teaching experience in the previous week.
Teaching staff voiced concern about the impact disruptive behaviour has on class learning time, particularly with regard to pupils who are focused on their work being overlooked because the teacher or classroom assistant’s time is diverted to the pupils causing the problem. Support staff thought this was particularly difficult for pupils who already find it difficult to concentrate in class and rely on additional support.
Serious disruptive behaviour/violence
Overall, serious disruptive or violent behaviour was much less common than low-level disruptive behaviour. When it occurred, it was more often directed at other pupils than at staff.
For example, only 7 out of 876 primary (1%) and 1 out of 2022 secondary teachers (<1%) had experienced physical violence towards themselves in the classroom in the previous week. The most common form of serious disruptive behaviour directed at staff members was ‘general verbal abuse’. In primary, this was experienced by 4% of teachers and 16% of support staff, and in secondary by 20% of teachers and 27% of support staff, in the classroom in the last full teaching week.
respectively) had encountered physical aggression towards other pupils. In secondary, the figures for pupil to pupil verbal abuse were even higher (47% of teachers and 64% of support staff had encountered this in the classroom in the last week). However, there was slightly less pupil to pupil physical aggression in
secondary (encountered by 27% of teachers and 47% of support staff in the classroom in the last week).
How has behaviour changed since previous surveys?
Where there have been changes since the previous surveys in 2006 and 2009, the trends are almost all in a positive direction.
One of the main exceptions is in relation to mobile phone use which has increased considerably in secondary schools since 2009. However, while staff in case study schools thought that the use of mobile phones was a frequent and distracting influence in classrooms, they felt it was no more annoying or disruptive than many other low-level disruptive behaviours.
Key trends in positive behaviour
Staff assessments of overall levels of good behaviour have consistently been very high over the survey series and they have remained so. Where there have been changes, they have generally been in a positive direction, both in respect of overall behaviour and specific positive behaviours. The only exception to this was for primary support staff who saw decreases in four of the eleven positive behaviours Key trends in low-level disruptive behaviour
Overall, the proportion of both primary and secondary teachers encountering low-level disruptive behaviour in the classroom has decreased since 2006.
There are, however, two exceptions to this – secondary teachers indicate that the use of mobile phones in the classroom has risen and primary teachers believe that talking out of turn has increased.
The picture for support staff is less positive. There has been an increase in the proportion of both primary and secondary support staff encountering a number of low-level disruptive behaviours in the classroom between 2006 and 20123. Low-level disruptive behaviour around the school has decreased substantially between 2006 and 2012 in both the primary and the secondary sector. This is with the exception of the use of mobile phones against school policies, which heads indicate has increased since 2009.
Key trends in serious disruptive behaviour/violence
Serious disruptive behaviour in the classroom has, on the whole, decreased since 2006. However, among both secondary teachers and support staff there has been
an increase in the proportion encountering pupils using mobile phones abusively between 2009 and 2012.
There has also been an increase in secondary heads’ personal experience of physical violence in the last 12 months: 3% (8 of 257) of secondary heads had experienced this in 2012, compared with 1% (3 of 246) in 2009. While an increase in physical violence towards secondary heads is a very serious matter, and should be monitored, it must be borne in mind that the absolute number of incidents is very small and is therefore subject to fluctuation when comparing two time periods. Physical violence is one out of six types of serious disruptive behaviour examined. For the other five, there was no evidence of change between 2009 and 2012 among secondary heads. Therefore, the change seen in the level of physical violence towards secondary heads does not appear to reflect a wider trend.
What approaches to promoting positive behaviour have been used?
Teachers are generally confident in their ability to promote positive behaviour and respond to indiscipline.
Staff in case study schools and local authority representatives generally felt that approaches to promote positive behaviour had improved over time.
A wide range of approaches are used to encourage positive behaviour and staff talked of the value of having a range of different approaches on which to draw.
There is a continued move away from more punitive methods (e.g. punishment exercises) to more positive approaches (e.g. restorative practices) and heads, teachers and local authority representatives all emphasised the importance of good relationships between staff and pupils.
The ‘promotion of positive behaviour through whole school ethos and values’ was, to a great extent, seen by staff as the most helpful approach and staff were far more inclined to refer to ‘relationships’, rather than ‘behaviour management’ or
‘indiscipline’ when talking about the ways in which they deal with negative behaviour.
Heads, in particular, talked about the importance of building good relationships between staff and pupils and for staff to be out and about during breaks, interacting with pupils and intervening in disputes or squabbles before they have the chance to escalate. In the absence of good relationships between staff and pupils, there was recognition that behaviour policies would be far more difficult to implement and less likely to be effective.
Which aspects of behaviour are still challenging?
Staff in case study schools and local authority representatives expressed concern about the small, but felt to be increasing, number of children entering primary school with complex difficulties, including nurture and attachment issues.
In both the primary and secondary sectors, there was concern about a perceived increase in the incidence of severe mental health issues, Attention Deficit
1 INTRODUCTION AND METHODS
Introduction and policy background
1.1 This national study is the latest in a series of three-yearly Behaviour in Scottish Schools research projects and builds on previous research carried out in 20094 and 20065. It was commissioned by the Scottish Government Education Analytical Services Division, on behalf of the Learning Directorate Support and Wellbeing Unit, and it explores behaviour in publicly funded mainstream schools as well as current policy and practice with regard to managing the behaviour of children and young people.
1.2 There are three key overarching Government policy priorities which impact on behaviour in schools by promoting the development of positive relationships and an inclusive ethos throughout learning environments. These are: the Early Years Framework; Curriculum for Excellence; and Getting it right for Every Child.
1.3 The Early Years Framework seeks to maximise positive opportunities for all children to get the best start in life that will provide a strong platform for the future. It also seeks to address the needs of those children whose lives, opportunities and ambitions are constrained by poverty, poor health, poor attainment and unemployment.
1.4 Curriculum for Excellence (CfE) is the curriculum for Scottish schools and is the totality of experiences which are planned for children and young people through their education. The starting point for learning is a positive ethos and climate of mutual respect and trust based upon shared values across whole school communities. All learners will benefit from varied approaches to learning and opportunities to access learning in different contexts, through a range of provision delivered within the classroom, the school and beyond. 1.5 Getting it Right for Every Child (GIRFEC) is a national programme that aims
to improve outcomes for all children and young people. It seeks to do this by providing a framework for all services and agencies working with children and families to deliver a co-ordinated approach which is appropriate, proportionate and timely.
Aims and objectives
1.6 The overall aim of the research was to provide a clear and robust picture of behaviour in publicly funded mainstream schools and of current policy and practice in relation to managing behaviour.
1.7 More specifically, the research was to provide:
• clear and robust information on the nature and extent of positive and negative
behaviour (including low-level indiscipline and serious indiscipline/violence) in publicly funded mainstream schools in Scotland in 2012
• trend information, where possible, identifying changes since the previous
surveys in 2009 and 2006
• an assessment of the range of behaviour management approaches that are
used in schools and staff perceptions of which approaches are most effective in promoting positive behaviour and preventing/responding to indiscipline
• an assessment of the confidence of staff in promoting positive behaviour and
managing behaviour and the support and opportunities which they have, to engage in effective professional learning in relation to this
• an exploration of the impact of the implementation of CfE on behaviour in
schools and, in particular, whether/how the CfE focus on Health and Wellbeing is being used to promote positive relationships and behaviour.
Methodology
1.8 There were three strands to the research:
• quantitative surveys of heads, teachers and support staff • qualitative depth interviews with local authority representatives
• qualitative research with pupils, heads, teachers and support staff in twelve
case study schools.
Quantitative surveys of heads, teachers and support staff
1.9 The questionnaires were largely based on those used in the 2009 survey (which, in turn, were largely based on the questionnaires used in the 2006 survey). A small pilot was conducted in early January 2012 with 6 members of staff in a primary school and 6 members of staff in a secondary school.
Following the pilot, minor amendments were made to questionnaires. The final versions used for each category of staff are attached at Annex 1.
1.10 The sampling approach is detailed in Annex 2. In summary, a stratified random sampling approach was used to select schools and then, within schools, staff were selected at random based on their surname.
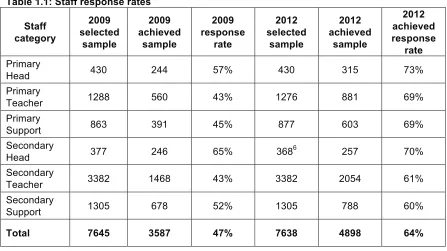
1.11 The sample sizes and response rates are shown below. The response rates substantially increased from 2009. This is likely to be due to: the efforts of local contacts (e.g. Positive Behaviour Team link officers) who encouraged participation from schools in their areas; the telephone calls to heads to encourage and secure participation; and the use of key contacts within schools.
1.12 Fieldwork was conducted February - March 2012. Instructions sent to schools for the administration of the questionnaire are attached at Annex 3.
1.13 The profile of respondents was compared with the known profile of all staff (using Scottish Government data on size of school, levels of free school meal registration, age, sex, whether full-time/part-time and whether
achieved sample was representative of all staff - at least in terms of those variables. The data were weighted to take account of the slight differences. Full details are contained in Annex 4.
Table 1.1: Staff response rates Staff category 2009 selected sample 2009 achieved sample 2009 response rate 2012 selected sample 2012 achieved sample 2012 achieved response rate Primary
Head 430 244 57% 430 315 73%
Primary
Teacher 1288 560 43% 1276 881 69%
Primary
Support 863 391 45% 877 603 69%
Secondary
Head 377 246 65% 3686 257 70%
Secondary
Teacher 3382 1468 43% 3382 2054 61%
Secondary
Support 1305 678 52% 1305 788 60%
Total 7645 3587 47% 7638 4898 64%
Qualitative depth interviews with local authority representatives
1.14 At the outset of the project, the Directors of Education for each of the 32 local authorities were sent a letter informing them of the aims and objectives of the research. They were also asked to recommend a suitable member of staff within their local authority to participate in an interview, in order to provide an overview of local authority policy and practice in managing behaviour in their schools. The project team then made contact with the nominated local authority representatives by telephone to arrange a suitable time for the interview to take place.
1.15 Interviews were conducted with representatives from 31 of the 32 local authorities7. One interview was conducted face-to-face8 and 30 were
conducted by telephone. Interviewees included Positive Behaviour Team link officers, Educational Psychologists, Behaviour Support Managers, Heads of Service, Additional Support for Learning Managers, Education Officers, Inclusion Officers and Quality Improvement Officers.
1.16 The topic guide for the interview was sent to each interviewee in advance of the interview, to give them the opportunity to think about the questions and
6 In order to maximise the sample of secondary heads, all heads were invited to participate (including those whose school had not been sampled).
7 The representative from one local authority agreed, in principle, to be interviewed but was unable to arrange a time within the fieldwork period.
allow them time to discuss the relevant issues with colleagues in advance of the interview (attached at Annex 5).
1.17 Fieldwork was conducted February – March 2012. With the permission of participants, the interviews were recorded and detailed notes were made by the member of the research team conducting the interviews.
Case studies in schools
1.18 Full details of the methodology for the case studies are contained at the beginning of Chapter 7. In summary, five primary schools and seven
secondary schools from ten different local authority areas were selected for participation. In each school, semi-structured interviews were conducted individually with the head and another member of the senior management team (SMT) and focus groups were conducted with pupils (one with younger pupils and one with older pupils), teachers and support staff. Fieldwork was carried out 21 May – 18 June 2012.
A note on interpreting the report Measuring levels of behaviours
1.19 It is important to note that the survey element of the research measures levels of behaviours based on a sample of staff and their assessment of how often behaviours were exhibited in their personal experience over the last full
teaching week/12 months9. The measures are not based on formally recorded or reported incidents.
1.20 The following specific behaviours were asked about in the survey:
Positive behaviour
In the classroom Around the school
Arriving with the correct equipment Greeting staff pleasantly Following instructions Playing games and sport Settling down quickly Queuing in an orderly manner Contributing to class discussions Using litter bins
Listening to others’ views respectfully Respecting school areas Listening to staff respectfully Positive use of facilities Keenly engaging with tasks Helping their peers Politely seeking staff help (e.g. putting hand up) Taking turns
Attentive, interested pupils Interacting supportively
Arriving promptly for classes Challenging negative behaviour Calm, relaxed and enjoyable lessons
Interacting supportively with each other
Enthusiastically participating in classroom activities
Talking out of turn Running in the corridor Making unnecessary (non-verbal) noise Unruliness while waiting
Hindering other pupils Showing lack of concern for others Getting out of seat without permission Persistently infringing school rules
Not being punctual Cheeky or impertinent remarks or responses Persistently infringing class rules Loitering in prohibited areas
Eating/chewing in class Leaving school premises without permission Work avoidance Rowdiness, horseplay or mucking about Cheeky or impertinent remarks or responses Use of mobile phones against school policies Rowdiness, horseplay or mucking about
Use of mobile phone
Use of headphones/iPod, MP3 player Withdrawing from interaction
Missing lessons
Serious disruptive behaviour/violence
In the classroom Around the school
Physical destructiveness Physical destructiveness
Racist abuse towards other pupils Racist abuse towards other pupils Sexist abuse towards other pupils Sexist abuse towards other pupils
General verbal abuse towards other pupils General verbal abuse towards other pupils Racist abuse towards you/your staff Racist abuse towards you/your staff Sexist abuse towards you/your staff Sexist abuse towards you/your staff
General verbal abuse towards you/your staff General verbal abuse towards you/your staff Pupils under the influence of illegal
drugs/alcohol
Pupils under the influence of illegal drugs/alcohol
Physical aggression towards other pupils Physical aggression towards other pupils Physical violence towards other pupils Physical violence towards other pupils Using mobile phones abusively Using mobile phones abusively Physical aggression towards you Physical aggression towards you Physical violence towards you Physical violence towards you
Differences between staff groups
1.21 The report details the findings from three categories of staff (heads, teachers and support staff) in the two sectors (primary and secondary). Overall, the results from heads tend to be more positive than the results from teachers (e.g. they experience more good behaviour and less low-level disruptive behaviour), and the results from teachers are more positive than the results from support staff.
1.22 There are a number of possible reasons for this. Different staff groups have different perspectives on behaviour in the school - although that is not to say that the perspective of any one group is more ‘true’ than any other. Heads probably have a broader overview of behaviour in their school but will have to deal with more serious cases of disruptive behaviour than low-level disruptive behaviour. Dealing with serious disruptive behaviour more frequently may mean that heads have a higher threshold for the types of behaviour they consider disruptive. On the other hand, teachers have a class level focus and have to deal with low-level disruptive behaviour more often. Support staff often work with the most challenging individuals or small groups within the whole class.
Low-level disruptive behaviour
1.23 In terms of serious disruptive behaviour, there was a different pattern. Heads encountered this type of behaviour more often than teachers. Heads were asked not only about their personal experience of serious disruptive behaviour but also about behaviour that had been referred on to them. For this reason we would expect them to have encountered more than teachers who were asked to think of their own experience only. However, support staff were also more likely to encounter serious disruptive behaviour than teachers and were asked only about their own experience. The most likely reason for this is that they have more one-to-one contact with challenging pupils.
1.24 Throughout the report, we present the results for each category of staff but we do not comment on the differences between them each time: this would have become extremely repetitive and placed an undue emphasis on the
differences rather than actual results and the trends over time. When interpreting the results, readers should bear in mind the overall pattern.
Differences between primary and secondary schools
1.25 Overall, the results from staff in the primary sector tend to be more positive than the results from the secondary sector (e.g. primary staff experience more positive behaviour and less disruptive behaviour).
1.26 This is likely to be due to the age of the pupils (in terms of their actual
behaviour and what behaviour is expected from children of different ages) and also the structure of primary and secondary school teaching.
1.27 Again, we have not commented on the differences in the results between primary and secondary sectors each time. When interpreting the results, readers should bear in mind the overall pattern.
Analysing trend data
2 POSITIVE
BEHAVIOUR
SUMMARY
• Overall, all staff groups were very positive about the level of good behaviour both
in the classroom and around the school.
• Staff working in the primary sector were more likely than those in the secondary
sector to encounter positive behaviour.
• On the whole, views of specific positive behaviours have either improved or
stayed the same since 2006. The only exception to this was primary support staff who reported decreases in 4 out of the 11 positive behaviours in the classroom.
Introduction
2.1 This chapter outlines staff perceptions of positive behaviour in the classroom and around the school. The chapter is split into two sections – one with the primary sector results and the other with the secondary sector results. In each section, we begin with a general overview of positive behaviour in lessons followed by discussion of specific types of positive behaviour encountered. Then we cover positive behaviour around the school, and finally trends.
Positive behaviour in the primary classroom
2.2 Overall, primary staff were very positive about the standards of behaviour in the classroom. The vast majority said that they encountered positive
behaviour ‘all10’ or ‘most’ of the time. Ninety-nine per cent of primary heads said that all or most of their school roll were well behaved, while 93% of primary teachers and 90% of support staff stated that pupils were generally well behaved in all or most of their lessons11 (Table 1912).
2.3 Figure 2.1 shows the percentage experiencing specific positive behaviours in all or most lessons. Among primary heads, the most commonly encountered positive behaviours in the classroom were ‘pupils contributing to class
discussions’ and ‘pupils following instructions’. Primary teachers were also most likely to see ‘pupils contributing to class discussions’. Primary support staff were most likely to see ‘pupils arriving promptly for classes’. Primary heads were least likely to encounter ‘pupils listening to others’ views respectfully’ and ‘pupils interacting supportively with others’, while primary teachers and support staff were least likely to see ‘pupils settling down quickly’ (Table 20).
10 The response option was all/almost all but has been shortened to all in reporting for simplicity. 11 For full details of question wording please see Annex 1.
Positive behaviour around the primary school
[image:18.595.80.398.178.367.2] [image:18.595.78.511.471.694.2]2.4 General perceptions of behaviour around the school followed a similar pattern to behaviour in the classroom, with all three staff groups being very positive: (Figure 2.2) (Table 24).
Figure 2.2 Overall perceptions of positive behaviour around the school
Bases: primary heads n = 303, primary teachers n = 873, primary support staff n = 594
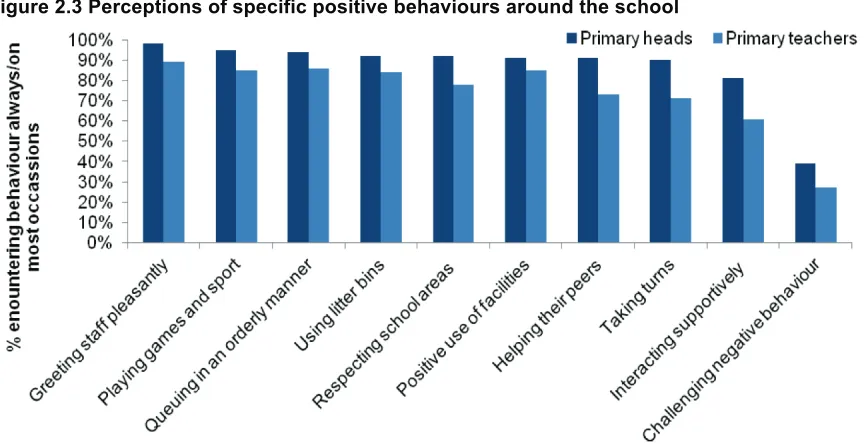
2.5 Among primary heads and teachers13, the most frequently encountered positive behaviour around the school was ‘pupils greeting staff pleasantly’. In contrast, the least frequent was ‘pupils challenging others’ negative behaviour’ (see Figure 2.3) (Table 25).
Figure 2.3 Perceptions of specific positive behaviours around the school
Bases: primary heads n = 314, primary teachers n = 877
Positive behaviour in the secondary classroom
2.6 As with staff from the primary sector, secondary heads, teachers and support staff were positive about the level of good behaviour in the classroom. The majority stated that they encountered positive behaviour ‘all’ or ‘most’ of the time: (99% of secondary heads indicated that all or most pupils were generally well behaved in the classroom and 88% of secondary teachers and 61% of secondary support staff indicated that pupils were generally well behaved in all or most of their lessons) (Table 19).
2.8 In contrast to the general trend for heads to encounter more positive
behaviour than teachers, secondary teachers were slightly more likely than secondary heads to say that they encountered the following specific positive behaviours in all lessons: ‘contributing to class discussions’; ‘listening to others’ views respectfully’; ‘listening to staff respectfully’; ‘politely seeking staff help’ and ‘lessons that are calm, relaxed and enjoyable’.
Positive behaviour around the secondary school
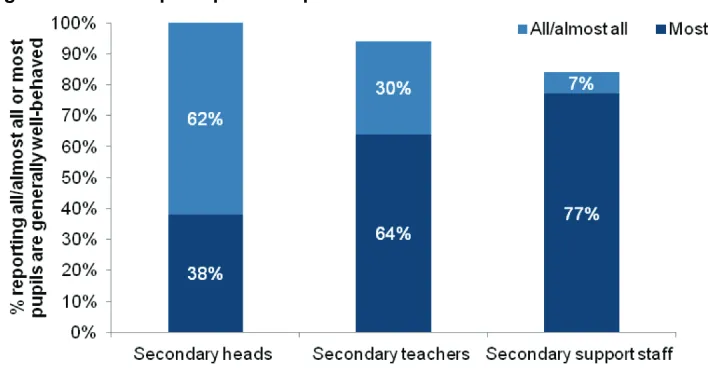
[image:21.595.79.433.284.468.2]2.9 Overall, perceptions of positive behaviour around the school followed a similar pattern to positive behaviour in the classroom. The vast majority of secondary staff thought that all or most pupils were generally well behaved around the school (Figure 2.5) (Table 24).
Figure 2.5 Overall perceptions of positive behaviour around the school
Bases: secondary heads n = 253, secondary teachers n = 2027, secondary support staff n = 779
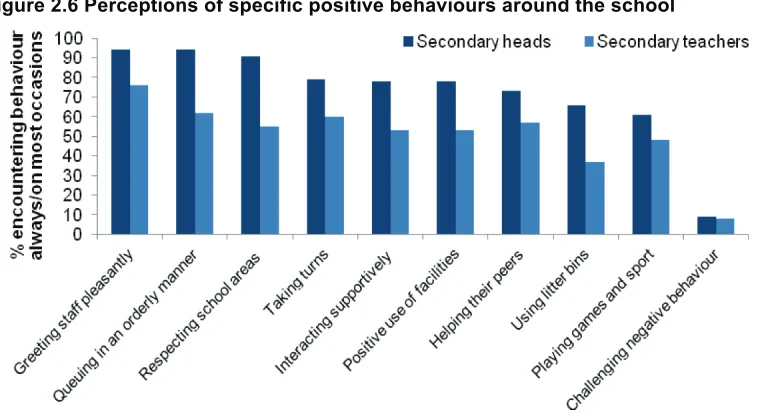
2.10 Secondary heads and teachers saw ‘pupils greeting staff pleasantly’ and ‘pupils queuing in an orderly manner’ most frequently14. They were least likely to say that they had encountered pupils ‘challenging each others’ negative behaviour’ (Figure 2.6) (Table 25).
Figure 2.6 Perceptions of specific positive behaviours around the school
Bases: secondary heads n = 255, secondary teachers n = 2026
Comparisons with 2006 and 2009
2.11 Overall, there has been very little change in experiences of positive behaviour either in the classroom or around the school. Nearly all heads (primary and secondary) said that all/most pupils are well behaved in lessons and pupils are always/most of the time well behaved around the school. As heads’ opinions were so positive there was little scope for improvement and there was no change in their views over time.
2.12 Among primary teachers, there have been no significant changes between 2006 and 2012 in views of overall positive behaviour either in the classroom or around the school. Among secondary teachers, there was an increase in the proportion encountering pupils behaving well in all/most lessons and always/most of the time around the school between 2006 and 2009 but no change between 2009 and 2012.
2.13 There was very little change in views of positive behaviour among either primary or secondary support staff. However, between 2006 and 2012 there was an increase in the proportion of secondary support staff who encountered pupils behaving well always or most of the time around the school.
3 LOW-LEVEL DISRUPTIVE BEHAVIOUR
SUMMARY
• The most common type of low-level disruptive behaviour in the classroom was ‘talking out of turn’. Around the school, the most common type was ‘running in the corridor’.
• Teachers and support staff thought that low-level disruptive behaviours had a greater negative impact on their teaching experience than serious disruptive behaviour/violence.
• Among both teachers and support staff, the behaviour said to cause the greatest disruption was ‘talking out of turn’.
• Overall, secondary staff were more likely than primary staff to encounter low-level disruptive behaviour.
• The proportions of heads and teachers encountering low-level disruptive behaviour (in the classroom and around the school) are, with the exception of talking out of turn in primary schools, and mobile phone use in secondary schools, unchanged or decreasing.
• The picture for support staff is less positive. There has been an increase in the proportion of both primary and secondary support staff encountering a number of low-level disruptive behaviours in the classroom between 2006 and 2012.
Introduction
3.1 Staff were given a list of different low-level disruptive behaviours and asked how frequently they encountered them. This was done for both behaviour in the classroom and behaviour around the school. The chapter is split into two sections, the first for the primary sector and the second for the secondary sector.
Low-level disruptive behaviour in the primary classroom
3.2 Nearly two thirds (66%) of primary heads said that they had low-level disruptive behaviour in the classroom referred to them at some point in the previous week (Table 21).
3.3 The low-level disruptive behaviour most frequently experienced in the classroom was ‘talking out of turn’15. The least common was ‘using mobile phones/texting’. Overall, primary teachers tend to encounter less low-level disruptive behaviour in the classroom than primary support staff (Figure 3.1) (Table 22).
3.4 While these forms of disruptive behaviour are termed ‘low-level’, they can still have a notable impact on the day-to-day classroom environment. Teachers and support staff were asked which behaviours had the greatest negative impact on their teaching experience in the previous week and, from a list including both low-level disruptive behaviours and serious disruptive behaviour/violence, it was the low-level behaviours which had the most impact. Among both primary teachers and support staff, the behaviours said to cause the greatest disruption were ‘talking out of turn’ and ‘hindering other pupils’ (Table 23).
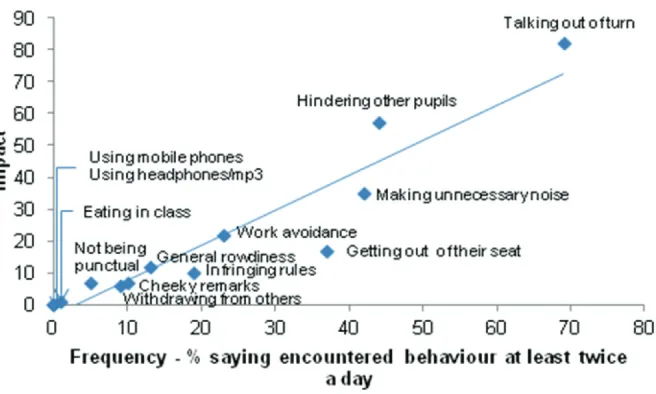
[image:25.595.93.421.314.511.2]3.5 The chart below (Figure 3.2) shows that, in terms of low-level disruptive behaviour in the classroom, there is a relationship between perceptions of how often a behaviour occurs, and how disruptive it is (r16 = 0.94).
Figure 3.2 Frequency of the perceptions of low-level disruptive behaviour in the classroom by percentage of primary teachers ranking it as one of the three behaviours that have the greatest negative impact on staff experience
Base: primary teachers n = 877
Low-level disruptive behaviour around the primary school17
3.6 The most common types of disruptive behaviour seen around the school were ‘running in the corridor’ and ‘unruliness while waiting’. The least common behaviours were ‘use of mobile phones against school policies’ and ‘leaving school without permission’ (Table 26).
16 r represents the correlation coefficient for the two variables and measures the strength of the
relationship between them i.e. as one variable increases in its values, the other variable also
increases in its values. In a perfect relationship between two variables r = 1, so the closer the r value is to 1 the stronger the relationship. However, it is important to bear in mind that correlation does not imply causation.
Disruptive behaviour outside of the primary school premises18
3.7 Complaints from the public about primary pupils’ conduct outside the school premises were rare: 30% of heads said they never received complaints and 63% received them ‘rarely’ (Table 33).
3.8 On the rare occasions there were complaints, the most common reasons were: ‘cheeky or impertinent remarks’, ‘general rowdiness, horseplay,
mucking about’ and ‘anti-social behaviour (e.g. smoking, swearing, shouting)’ (Table 34).
Comparisons with 2006 and 2009
3.9 Overall, primary teachers’ views of the frequency of low level disruptive
behaviour in the classroom have either improved or stayed the same between 2006 and 2012. The only exception to this is ‘talking out of turn’ which has increased over the period.
3.10 For primary support staff, there have been perceived increases between 2006 and 2012 in 5 out of the 11 behaviours listed in Fig 3.1 (‘talking out of turn’, ‘making unnecessary non-verbal noise’, ‘hindering other pupils’, ‘getting out of seat without permission’ and ‘not being punctual’). However, none of these changed significantly in the last 3 years (2009-2012), suggesting that this increase may be levelling off.
3.11 In terms of low level disruptive behaviour around the school, primary teachers perceived the frequency of such behaviours to be declining across the board, although most of these decreases occurred between 2006 and 2009, with no significant change over the last 3 years. The one exception to this was
‘running in the corridor’, which has not changed over 2006-2012.
3.12 This was much the same for primary heads, with the exceptions of ‘running in the corridor’ and ‘leaving school premises without permission’, which have not changed over 2006-2012, and the ‘use of mobile phones/texting against school policies’, which increased between 2006 and 2012.
3.13 For more detail on these findings, please see Annex 6.
Low-level disruptive behaviour in the secondary classroom
3.14 Nearly half of secondary heads had had pupils referred to them at least once in the previous week for what was deemed to be low level disruption (Table 21).
3.15 Among secondary teachers and secondary support staff, the most commonly observed type of low level disruptive behaviour was ‘talking out of turn’19. The least common type of behaviour encountered was ‘pupils withdrawing from interaction with others/you’. In general, support staff witnessed more low-level disruptive behaviour in the classroom than secondary teachers (Figure 3.3) (Table 22).
18 These questions were only asked of heads.
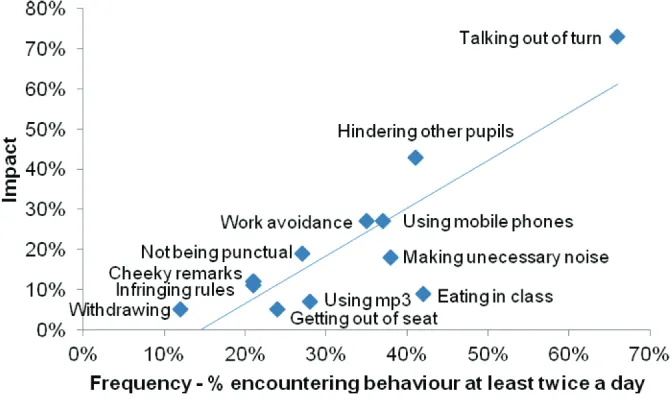
3.16 Teachers and support staff were asked which behaviours had the greatest negative impact on their teaching experience in the previous week and, from a list including both low-level and serious disruptive behaviour/violence, it was the low-level behaviours which had the most impact. Secondary teachers and support staff both thought that the behaviours that had the greatest impact on their work were pupils ‘talking out of turn’ and ‘hindering other pupils’ (Table 23). In general, the behaviours that were most frequent were also perceived to have the greatest negative impact (r20 = 0.85) (Figure 3.4).
Figure 3.4 Frequency or the perceptions of low-level disruptive behaviour in the classroom by percentage of secondary teachers ranking it as one of the three behaviours that have the greatest negative impact on staff experience
Base: secondary teachers n = 2027
Low-level disruptive behaviour around the secondary school
3.17 The most common low-level disruptive behaviours encountered around the schools were ‘using mobile phones against school policies’ and ‘running in the corridor’. The least common behaviour encountered was ‘withdrawing from peers’ (Table 26).
3.18 Secondary heads felt that ‘using mobile phones against school policies’ had the greatest negative impact on staff’s experience at school, while teachers thought that ‘general rowdiness’ had the greatest effect (Table 27).
20 r represents the correlation coefficient for the two variables and measures the strength of the relationship between them i.e. as one variable increases in its values, the other variable also
Disruptive behaviour outside the secondary school premises
3.19 Almost all secondary heads (98%) had received complaints about their pupils’ conduct outside school premises. However, only 5% received complaints frequently (Table 33).
3.20 The three most common reasons for complaints from the public were; ‘general rowdiness, horseplay, mucking about’, ‘anti-social behaviour (e.g. smoking, swearing, shouting)’ and ‘dropping litter’ (Table 34).
Comparisons with 2006 and 2009
3.21 Secondary teachers’ views of the frequency of low level disruptive behaviour in the classroom have improved between 2006 and 2012 across all
behaviours listed in Figure 3.3, with the exceptions of ‘talking out of turn’, which has not changed, and the ‘use of mobile phones/texting’, which increased between 2009 and 2012.
3.22 For secondary support staff, perceptions of the frequency of most of the low level disruptive behaviours in the classroom have not changed between 2006 and 2012, with the exception of ‘talking out of turn’, ‘hindering other pupils’ and the ‘use of mobile phones/texting’, which have all increased.
3.23 In terms of low level disruptive behaviour around the school, secondary
teachers perceived the frequency of such behaviours to be decreasing across the board between 2006 and 2012, although most of this change occurred between 2006 and 2009. The only exception to this was the ‘use of mobile phones/texting against school policies’ which went down between 2006 and 2009, but didn’t change between 2009 and 2012.
3.24 Again, this was much the same for secondary heads, who perceived a decline in the frequency of most low level disruptive behaviours between 2006 and 2009, and further between 2009 and 2012. Again the key exception was mobile phone use against school policies, which increased between 2009 and 2012.
4 SERIOUS DISRUPTIVE BEHAVIOUR/VIOLENCE
SUMMARY
• Serious disruptive behaviour was much less common than low-level disruptive behaviour.
• Serious disruptive behaviour was more commonly directed at other pupils rather than staff.
• Overall, heads and support staff encountered similar levels of serious disruptive behaviour and both were more likely to see this than teachers.
• In general, those working in the secondary sector were more likely to encounter serious disruptive behaviour than those in the primary sector, with the exception of physical aggression and physical violence.
• On the whole, serious disruptive behaviour has been decreasing over time. However there are a few specific behaviours that saw an increase. In particular, all staff groups had seen an increase in the abusive use of mobile phones from 2009 to 2012.
Introduction
4.1 Staff were given a list of 15 serious disruptive behaviours and asked how frequently they had occurred in the classroom and around the school in the previous full teaching week before the survey. The results for the primary and secondary sectors are discussed in turn.
4.2 Overall, serious disruptive or violent behaviour in the classroom was much less common than low-level disruptive behaviour. We mainly report on the percentage of staff who had encountered a behaviour at least once in the previous week. However, where there are sufficient numbers to explore the differences at a more detailed level we do so. It must also be borne in mind that these results relate to the number of incidents and not the number of pupils. While there may be several incidents in a school in one week, they may only involve a single pupil.
Serious disruptive behaviour/violence in the primary classroom
4.4 The least common behaviour was ‘pupils under the influence of illegal drugs/alcohol’. No staff from the primary sector had observed this in the classroom in the previous week. There were also very low levels of sexist, racist or homophobic abuse towards staff (Table 22).
4.5 Both primary heads21 and support staff22 encountered more serious disruptive behaviour in the preceding week than primary teachers.
Serious disruptive behaviour/violence around the primary school
4.6 Serious disruptive behaviour around the school followed the same pattern as behaviour in the classroom23. It was less common for primary staff to see serious disruptive behaviour than low-level disruptive behaviour. When
[image:32.595.78.510.286.539.2]serious disruptive behaviour was encountered, it was mostly directed at other pupils as opposed to staff. (Figure 4.2) (Table 26).
Figure 4.2 Perceptions of serious disruptive behaviour around the school in the previous week
Bases: primary heads n = 314, primary teachers n = 876
Personal experience of serious disruptive behaviour in the primary school in the previous 12 months
4.7 Staff were asked if they, personally, had experienced abuse (including verbal abuse) or violence against them in the previous 12 months. Twenty-seven per cent of primary heads, 19% of primary teachers and 23% of primary support staff had experienced some form of abuse or violence in the previous 12 months.
21 Heads were asked about serious disruptive behaviour that they had personally encountered and behaviour that had been referred to them. Consequently, it is understandable that a higher proportion would report that they encountered such behaviour than teachers who were only asked about their own experience.
4.8 The most common form of incident was ‘verbal abuse towards you (i.e. threatening remarks)’, followed by ‘physical aggression towards you (e.g. by pushing, squaring up)’ and ‘physical violence towards you (e.g. punching, kicking, head butting, use of a weapon)’. It was very rare for primary staff to say they personally experienced racist abuse, sexist abuse or homophobic abuse in the previous 12 months (Table 28).
4.9 It was most common for incidents involving primary heads to be followed up with a restorative meeting, while for teachers and support staff it was most common for incidents to be followed up with ‘feedback on the incident’ (Table 31). While the questionnaire provided no further information on what feedback was provided, staff comments from the questionnaire pilot suggest that they perceived this to be feedback from the head or the senior management team (SMT).
4.10 Primary heads and teachers reported similar levels of satisfaction with how the incident was followed up (77% of heads and 73% of teachers were ‘very’ or ‘fairly satisfied’ with the way it was handled). A lower proportion of support staff were satisfied with the way the incident was handled (58%) (Table 32).
Impact of serious indiscipline/pupil violence in primary school
4.11 In general, primary staff perceived serious disruptive behaviour to have a much lower impact on their day-to-day school experience than low-level disruptive behaviour24. This is perhaps unsurprising given the fact that it was
much rarer. The serious behaviours that were thought to have the greatest impact (both in the classroom and around the school) were ‘physical aggression towards other pupils’ and ‘general abuse towards other pupils’ (Table 23 and 27).
4.12 Staff were also asked about the overall impact of serious disruptive
behaviour/pupil violence on the performance of their school. The majority of primary staff felt it had little impact. Eighty-three per cent of primary heads, 73% of primary teachers and 65% of primary support staff thought this type of behaviour had little impact on the performance of their school25 (Table 48).
Comparisons with 2006 and 2009
4.13 For all primary staff, the frequency of encountering serious disruptive behaviours/violence in the classroom either declined or stayed the same between 2006 and 2012, with the exception of an increase in the proportion of primary heads’ experiencing ‘general verbal abuse towards you/your staff’. However, this change was only significant between 2006 and 2009,
suggesting that it may have levelled off in the last three years. Interestingly, across all staff groups there was a decrease in physical violence towards other pupils between 2006 and 2012, but again most of this change took
24 We asked which three types of behaviour (from the list including low-level and serious disruptive
behaviour) had the greatest negative impact on staff experiences in the classroom in the previous week. Most staff cited low-level behaviours.
25 The wording of this question was revised in 2012 following the pilot, so the results are not
place between 2006 and 2009, with no significant change between 2009 and 2012.
4.14 Similarly, primary heads and teachers generally encountered either less or the same amount of serious disruptive behaviours/violence around the school between 2006 and 2012. Notable exceptions to this were primary heads’ experiences of ‘general verbal abuse towards you/your staff’ and ‘physical aggression towards you’, which increased between 2006 and 2009, but had levelled off by 2009-2012 (resulting in no overall change between 2006 and 2012).
4.15 Among all staff groups, there had also been no change since 2009 in the proportion who personally experienced some form of abuse or violence in the last 12 months.
4.16 For more detail on these findings, please see Annex 7.
Serious disruptive behaviour/violence in the secondary classroom
4.18 Overall, secondary heads26 and support staff27 were more likely than teachers to encounter serious disruptive behaviour in the classroom in the previous week.
Serious disruptive behaviour/violence around the secondary school
[image:36.595.76.505.245.467.2]4.19 Secondary heads and teachers said that the most common forms of serious disruptive behaviour around the school were ‘general verbal abuse towards other pupils’ and ‘physical aggression towards other pupils’. In general, secondary heads were more likely to encounter serious disruptive behaviour around the school than teachers28. (Figure 4.4) (Table 26).
Figure 4.4 Perceptions of serious disruptive behaviour around the school in the previous week
Bases: secondary heads n = 254, secondary teachers n = 2026
Personal experience of serious disruptive behaviour in the secondary school in the previous 12 months
4.20 Staff were asked if they, personally, had experienced abuse (including verbal abuse) or violence against them in the previous 12 months. Thirty-five per cent of secondary heads and teachers and 26% of secondary support staff had experienced some form of violence or abuse in the previous 12 months.
4.21 The most common serious behaviour was ‘verbal abuse towards you (i.e. threatening remarks)’, followed by ‘physical aggression towards you’ (e.g. pushing, squaring up). It was extremely rare for secondary staff to say they
26 Heads were asked about serious disruptive behaviour that they had personally encountered and behaviour that had been referred to them. Consequently, it is understandable that a higher proportion would report that they encountered such behaviour than teachers who were only asked about their own experience.
personally experienced any other kind of abuse or violence in the previous 12 months. Among those staff who had experienced some form of abuse, the most recent incident was most likely to have been ‘verbal abuse towards you’ (Table 28).
4.22 It was most common for an incident involving a head to be followed up with a formal meeting. Among teachers and support staff the most common outcome was ‘feedback on the incident’. While the questionnaire provided no further information on what feedback was provided, staff comments from the questionnaire pilot suggest that they perceived this to be feedback from the head or the senior management team (SMT) (Table 31).
4.23 Overall, the majority of secondary staff were satisfied with how the most recent incident they experienced was handled. However, secondary heads were more satisfied than secondary teachers or support staff (87% of secondary heads, compared with 61% of secondary teachers and 56% of secondary support staff were very or fairly satisfied) (Table 32).
Impact of serious indiscipline/pupil violence in secondary school
4.24 Secondary teachers and support staff did not rank the impact of any of the serious disruptive behaviours highly29. This may be because these incidents are, in fact, relatively rare. The serious disruptive behaviour thought to have the greatest impact in the classroom was ‘general verbal abuse towards other pupils’ (Table 23 and 27).
4.25 The majority of secondary heads and teachers thought the serious disruptive behaviour/pupil violence had little impact on the performance of their school. Eighty-six per cent of secondary heads, 60% of secondary teachers and 47% of secondary support staff thought this type of behaviour had little impact on the performance of their school30 (Table 48).
Comparisons with 2006 and 2009
4.26 Across most of the categories for serious disruptive behaviours/violence in the classroom, there had been a decline from 2006 to 2012 across all staff.
However, secondary heads saw a rise between 2006 and 2009 in:
• ‘sexist abuse towards you/your staff’
• ‘general verbal abuse towards you/your staff’ • ‘physical aggression towards you’
29 We asked which three types of behaviour (from the list including low-level and serious disruptive behaviour) had the greatest negative impact on staff experiences in the classroom in the previous week. Most staff cited low-level behaviours.
4.27 By 2012 this had levelled off, but was still at a significantly higher level than in 2006.
4.28 The other notable finding was that secondary teachers and support staff had seen a rise in using mobile phones abusively in the classroom between 2009 and 2012 (question not asked in 2006).
4.29 Similarly, the general picture of serious disruptive behaviours/violence around the school was one of improvement between 2006 and 2012, but again, secondary heads saw a rise between 2006 and 2009 in the three categories of serious disruptive behaviour listed above. Once again, this had levelled off by 2012, but was still higher than it had been in 2006. Secondary heads also saw a rise in ‘using mobile phones abusively’ around the school between 2009 and 2012, but there was no change for secondary teachers in this regard.
4.30 There has also been an increase in secondary heads’ personal experience of physical violence in the last 12 months: 3% (8 of 257) of secondary heads had experienced this in 2012, compared with 1% (3 of 246) in 2009. While an increase in physical violence towards secondary heads is a very serious matter, and should be monitored, it must be borne in mind that the absolute number of incidents is very small and is therefore subject to fluctuation when comparing two time periods. Physical violence is one out of six types of serious disruptive behaviour examined. For the other five, there was no evidence of change between 2009 and 2012 among secondary heads. Therefore, the change seen in the level of physical violence towards secondary heads does not appear to reflect a wider trend.
5 FACTORS WHICH INFLUENCE EXPERIENCES OF BEHAVIOUR
SUMMARY
• We carried out further analysis to explore the influence that specific variables (school sector, school size, level of free school meal registration (which is used as a proxy for deprivation), school capacity, school condition, length of service, the proportion of pupils that have additional support needs, urban/rural
classification, and suitability of school premises) had on experiences of disruptive pupil behaviour. There are, of course, many other variables which might impact on experiences and this exercise was not intended to provide a full explanation of pupil behaviour.
• The variables included in the analysis only explained a small amount of the variation in experiences of disruptive pupil behaviour: among heads it ranged from 11-31%; among teachers 6-10%; and among support staff 4-12%. This reinforces the point that there are other variables which have an influence. • The aspects that had the greatest impact on experiences of disruptive pupil
behaviour overall were school sector (secondary staff experienced more disruptive behaviour), level of free school meal registration (staff working in schools with a higher rate of free school meal registration experienced more disruptive behaviour), and length of service (less experienced staff experienced more disruptive behaviour).
5.1 This chapter explores the extent to which some specific variables influence staff experiences of pupil behaviour. The scope of the research only extended to exploring some specific aspects of school demographics which might influence experiences of pupil behaviour. It was not intended to provide a full explanation of pupil behaviour as there are clearly many other variables that could contribute to this (e.g. aspects of pupils’ home lives, peer pressure or aspects of the school culture and ethos which are difficult to quantify).
5.2 We first detail how we identified broad types of behaviour from the list of specific behaviours in the questionnaires and then discuss which variables best predict staff experiences of those types of behaviour.
Using factor analysis to create behaviour groupings
5.3 The questionnaires covered staff experiences of a great number of specific disruptive behaviours. We simplified this data using a method called factor analysis. In this instance, factor analysis grouped together the specific behaviours that staff had experienced (based on their tendency to occur together) into six distinct factors (for full technical details please see Annex 8). This means that the specific behaviours grouped within a factor were highly correlated i.e. they tended to occur together and if a staff member had encountered one, they were more likely to have experienced the others.
5.4 Although the factor analysis highlights which behaviours are highly correlated it does not provide an explanation of what broad type of behaviour each grouping actually represents. However, it was clear that there were
table below highlights how we interpreted each factor (in the first column) and the specific behaviours that they contain (in the second column)31 (Table 5.1).
Table 5.1 Factor groupings
Factor one-low-level disruptive behaviour in the classroom
Talking out of turn, making unnecessary noise, hindering other pupils, getting out of seat without permission, persistently infringing class rules, work avoidance, cheeky or impertinent remarks (in the classroom), general rowdiness (in the classroom)
Factor two-low-level disruptive behaviour around the school
Running in the corridor, unruliness while waiting, showing lack of concern for others, persistently infringing school rules, cheeky or impertinent remarks (around the school), loitering in prohibited areas, general rowdiness (around the school)
Factor three - disengagement
Not being punctual, eating/chewing in class, use of mobile
phones/texting (in the classroom), use of headphones/iPod/mp3 player, missing lessons, leaving school premises without permission, use of mobile phones/texting against school policies, truanting
Factor four -aggression and
violencetowards other pupils
General verbal abuse towards other pupils (in the classroom and around the school), physical aggression towards other pupils (in the classroom and around the school), physical violence towards other pupils (in the classroom and around the school)
Factor five
-discriminatory verbal abuse towards other pupils
Racist abuse towards other pupils (in the classroom and around the school), sexist abuse or harassment of other pupils (in the classroom and around the school), homophobic abuse towards other pupils (in the classroom and around the school)
Factor six-abuse towards staff
Physical aggression towards you (in the classroom and around the school), physical violence towards you (in the classroom and around the school), physical destructiveness (in the classroom and around the school), general verbal abuse towards you ( in the classroom and around the school)
Using logistic regression to identify drivers of staff experiences of pupil behaviour
5.5 Each logistic regression was conducted using the following variables to predict whether a type of behaviour would be encountered by a staff member or not: school sector, school size, level of free school meal registration (which is used as a proxy for deprivation), school capacity, school condition, length of service and the proportion of pupils that have additional support needs32 (for full details on how these variables were defined please see Annex 8). The variables included in the analysis were chosen on the basis of the availability of the data and whether we thought they would have an influence. A further two variables were included in the original analyses: suitability of school premises and urban/rural classification. However, they did not have a
significant impact on experiences of disruptive behaviour and were, therefore, excluded from further analyses.
5.6 Logistic regression creates a model that explains a certain amount of variation in the outcomes. In other words, it lets us know the extent to which the
variables we have used as predictors are able to explain experiences of different types of behaviours. Among heads, the logistic regression models
31 Due to differences in the questionnaire, factor one only applies to teachers and support staff and
factor two only applies to teachers and heads.
were able to explain a reasonably high proportion of the variation for each factor (between 11% and 31%). While the models for teachers and support staff were only able to explain quite a small amount of the variation in
outcomes, the influence of the predictor variables was statistically significant. Among teachers, the amount of variation explained ranged from 6% to 10% and, among support staff, it ranged from 4% to 12%.
5.7 It is clear from the amount of variation that remains unexplained that there are other variables that have an influence on whether staff encounter certain types of behaviour. These could be, for example, aspects of pupils’ home lives, peer pressure or aspects of the school culture and ethos which are difficult to quantify. However the models do allow us to comment on which of the variables have a significant impact on experiences of disruptive behaviour.
5.8 The tables below summarise which variables best predicted whether staff encountered the different types of behaviour. Disengagement was particularly influenced by school sector (it was much more common in secondary
schools), therefore we conducted extra analyses based only on secondary sector staff. Among heads, school size was no longer a predictor of
disengagement. Among teachers and support staff, school condition had a significant impact which it did not when both primary and secondary staff were included. In addition, among support staff, the proportion of pupils with
[image:41.595.39.576.420.614.2]additional support needs became a significant predictor of disengagement.
Table 5.4 Variables with a significant influence on whether heads encountered different types of behaviour Secondary sector Larger school size Higher levels of FSM registration Closer to school capacity Poorer school condition Shorter length of service Higher level of ASN pupils Low-level disruptive behaviour around the school
Disengagement
Disengagement -
secondary sector only
Aggression and violence
towards other pupils
Discriminatory verbal abuse towards other pupils
Table 5.5 Variables with a significant influence on whether teachers encountered different types of behaviour
Secondary sector Larger school size Higher levels of FSM registration Closer to school capacity Poorer school condition Shorter length of service Higher level of ASN pupils Low-level disruptive behaviour in the classroom
Low-level disruptive behaviour around the school
Disengagement
Disengagement
-secondary sector only
Aggression and violence
towards other pupils
Discriminatory verbal abuse towards other pupils
Abuse towards staff
Table 5.6 Variables with a significant influence on whether support staff encountered different groups of behaviour
Secondary sector Larger school size Higher levels of FSM registration Closer to school capacity Poorer school condition Shorter length of service Higher level of ASN pupils Low-level disruptive behaviour in the classroom
Disengagement
Disengagement
-secondary sector only
Aggression and violence
towards other pupils
Discriminatory verbal abuse towards other pupils
Abuse towards staff
[image:42.595.39.576.354.547.2]Conclusions
5.10 Overall, the variables included in the analysis only explained a small amount of the variation in experiences of disruptive pupil behaviour (and they explain more of heads’ experiences of disruptive pupil behaviour than that of teachers or support staff). The aspects that had the greatest impact were school sector (secondary staff experienced more disruptive behaviour), higher levels of free school meal registration (staff working in schools with a higher rate of free school meal registration experienced more disruptive behaviour) and length of service (less experienced staff experienced more disruptive behaviour). It is also important to note that there were some variables that we thought might have an influence on behaviour, however, this was not evidenced. These were the suitability of the school33 and urban/rural classification. When all the variables are taken into account, suitability does not appear to explain any variation in experiences of behaviour.
5.11 Level of free school meal registration (a proxy for deprivation) was the variable that had the most consistent influence on experiences of behaviour across the three staff groups. While this may not come as a surprise, it indicates the importance of a continued focus on reducing inequalities and providing support for parents/early years interventions in areas of high deprivation.