APPLICATION OF NETWORK
COMPLEXITY ANALYSIS
Matthew
McKay
A thesis submitted for the degree of Doctor of Philosophy of The
Australian National University
October 2015
The Australian National University
DECLARATION
I certify that this is my original work except where otherwise indicated or acknowledged in the thesis.
This thesis is a contribution to network complexity analysis, which has shown a high degree of explanatory power in visualising the process of economic diversification, both across countries and over time. The thesis comprises a stage-setting introduction, a primer on the network complexity analysis and measures of economic complexity, three core chapters and a concluding chapter that summarises the key findings and makes suggestions for further research.
The first core chapter (Chapter 3) aims to place network complexity analysis, which has been criticised as a purely data driven analytical tool, within a theoretical economic context. By building a bridge between the mainstream theories of comparative advantage and the new analytical tool, the chapter demonstrates that the predictions of the theory of comparative advantage are borne out in the network analysis.
The next two chapters are novel empirical applications of network complexity analysis, using a structural construct called the product space. Chapter 4 deals with the impact of trade liberalisation on export performance, covering 96 liberalisation episodes in 129 countries over 1962–2012. The first stage of the analysis involves constructing measures of product emergence. These are then used in econometric analysis to examine the average within-country impact of trade liberalisation on product emergence and diffusion. The findings indicate that trade liberalisation is associated with an increase in the rate of product emergence and a moderate reorientation toward products that are more dissimilar to those in the pre-reform export composition.
I thank my supervisor Prof. Prema-chandra Athukorala for his excellent supervision and for providing me with the opportunity to pursue this topic in applied computational development economics. His constant enthusiasm for understanding our world through the lens of economics is inspiring. I have learnt so much through our many conversations, in addition to tutoring his graduate course on development economics. I also thank Dr. Paul Burke, who provided me with excellent feedback on my drafts and always challenged me on coming up with ways to improve clarity of thought and expression.
Second I would like to thank my wife Louise McKay, who provided me with seemingly endless moments of encouragement and for providing the environment through which I could pursue these years of study. I would not have wanted to share this journey with anyone else.
I am very grateful to the Arndt-Corden Department of Economics (ACDE) at the Australian National University (ANU) and all faculty members who crafted an environment in which graduate students were an integral part of the academic community. The dedication of faculty in attending the PhD seminar series is appreciated by all graduate students and offered a valuable opportunity for feedback and further discussion and interaction. I learnt a lot from the questions that these experienced practitioners of economic development asked of us fearful presenters. My thanks also extends to the many questions and comments made by the participants of the various seminar opportunities both at ANU and the Monash PhD Conference. From the Monash conference thanks is extended particularly to Dr. Laura Puzzello and Prof. Robert Breunig. Each and every one of these experiences provided a mixture of encouragement, challenges, and insights to new avenues of thought.
worth the investment.
CHAPTER 1 INTRODUCTION ... 19
CHAPTER 2 ECONOMIC COMPLEXITY AND THE NETWORK STRUCTURE OF INTERNATIONAL TRADE ... 29
2.1 INTRODUCTION ... 29
2.2 ECONOMIC AND PRODUCT COMPLEXITY ... 32
2.2.1 Example: 3 Countries, 5 Products ... 34
2.2.2 Relationship to Other Measures of Diversification or Concentration ... 37
2.2.3 Relating to Country Capabilities ... 38
2.3 THE PRODUCT SPACE:ASTRUCTURAL VIEW OF PRODUCT SIMILARITIES ... 40
2.3.1 Example: 3 Countries, 5 Products (Continued) ... 42
2.4 LIMITATIONS OF FOCUSING ON EXPORTS ... 46
2.5 CONCLUSION ... 47
CHAPTER 3 THE THEORY OF COMPARATIVE ADVANTAGE AND PRODUCT COMPLEXITY ANALYSIS ... 49
3.1 INTRODUCTION ... 49
3.2 THE THEORY OF COMPARATIVE ADVANTAGE ... 50
3.2.1 Ricardian Models ... 52
3.2.2 Heckscher-Ohlin Models ... 55
3.2.3 Key Observations ... 60
3.3 THE THEORY OF COMPARATIVE ADVANTAGE AND THE NETWORK STRUCTURE OF TRADE .... 61
3.3.1 Data ... 61
3.3.2 The Pattern of Specialisation ... 62
3.3.3 Economic Complexity and Comparative Advantage: A Sorting Heuristic ... 77
3.3.4 The Product Space (ϕpp') and Comparative Advantage ... 81
3.4 AMEASURE OF TRADE DISTORTION ... 89
3.5 CONCLUSION ... 94
CHAPTER 4 PROBABLE AND IMPROBABLE PRODUCT EMERGENCE DURING TRADE LIBERALISATION ... 97
4.1 INTRODUCTION ... 97
4.2 TRADE LIBERALISATION,GROWTH, AND EXPORT RESPONSE ... 101
4.3 THE PRODUCT SPACE ... 103
4.4 MEASUREMENT OF PRODUCT EMERGENCE AND DIFFUSION ... 108
4.4.1 Vectors of Improbable and Probable Emergence (“Jumps”) ... 109
4.4.2 Diffusion Measures ... 110
4.7 RESULTS AND DISCUSSION ... 123
4.8 CONCLUSION ... 131
CHAPTER 5 PRODUCT FRAGMENTATION AND TRADE PATTERNS ... 133
5.1 INTRODUCTION ... 133
5.2 THE PROCESS OF PRODUCTION FRAGMENTATION ... 135
5.3 DATA ... 139
5.4 PRODUCTION FRAGMENTATION AND WORLD TRADE PATTERNS ... 141
5.4.1 Parts and Components and Product Space Communities ... 150
5.5 PRODUCT FRAGMENTATION AND ECONOMIC COMPLEXITY ... 156
5.5.1 Differentiated Final Assembly Products ... 159
5.5.2 Patterns of Emergence in the Product Space ... 163
5.6 CONCLUSION ... 173
CHAPTER 6 CONCLUSION ... 175
6.1 FURTHER RESEARCH ... 179
REFERENCES ... 181
APPENDIX A DATASET COMPILATION ... 199
A.1. INTERNATIONAL TRADE DATASETS ... 199
A.2. NBERWORLD TRADE FLOW DATASET ... 199
A.2.1. Treatment of Country Codes ... 201
A.2.2. Treatment of Product Codes ... 203
A.2.3. Additional Adjustments for Dynamic Consistency ... 206
A.2.4. Constructed Datasets 1962 to 2000 ... 216
A.2.5. Constructed Datasets 1974 to 2000 ... 219
A.2.6. Constructed Datasets 1984 to 2000 ... 219
A.3. CEPIIBACIWORLD TRADE FLOW DATASET ... 220
A.4. COMBINED (NBER/CEPII)TRADE DATASETS ... 221
A.4.1. Bilateral Trade Datasets ... 221
A.4.2. Export Datasets ... 222
A.5. ATLAS OF COMPLEXITY (REFERENCE DATASET) ... 223
A.6. OTHER DATASETS (WDI,PENN,UNCTAD TRADE INTENSITIES) ... 224
APPENDIX B REVEALED COMPARATIVE ADVANTAGE ... 225
B.1. BALASSA RCA(BRCA) ... 225
B.2. SYMMETRIC RCA(SRCA) ... 228
B.3. WEIGHTED RCA(WRCA) ... 228
B.5.1. Impact on Product Rankings ... 231
B.5.2. Impact on Product Identification (Mcp Matrix) ... 232
B.6. EKRCA(EKRCA) ... 233
B.7. OTHER RCAMEASURES ... 234
B.8. EMPIRICAL CONSIDERATIONS – COMPUTATION OF BALASSA RCA ... 235
B.9. HILLMAN CONDITIONS ... 236
B.10. CONCLUSION AND RECOMMENDATION ... 237
APPENDIX C EXAMPLES OF COMPLEXITY RANKINGS ... 239
C.1. EXAMPLES OF COMPLEXITY INDICATORS ... 239
C.2. ECONOMIC COMPLEXITY INDICATOR (ECI) ... 239
C.3. PRODUCT COMPLEXITY INDICATOR (PCI) ... 239
C.4. PROXIMITY DATA ... 239
C.5. THE ATLAS OF COMPLEXITY FORMULATION OF ECI AND PCI ... 239
APPENDIX D A COUNTRY SPACE ... 261
APPENDIX E A SERIATION APPROACH ... 267
E.1. CONCLUSIONS ... 270
E.1.1. Future Work ... 271
APPENDIX F ROBUSTNESS RESULTS FOR PRODUCT EMERGENCE AND TRADE LIBERALISATION REGRESSIONS ... 273
F.1. COUNTRY TABLES ... 273
F.2. ALTERNATIVE DATASETS ... 274
F.3. NBER1984 TO 2000– RESTRICTED SAMPLE #2 ... 277
F.4. ESTIMATES OF WIDTH OF DIFFUSION IN NBER 1962 TO 2000 ... 279
APPENDIX G EXAMPLE PROXIMITY VALUES AND SYMMETRY ... 281
G.1. SYMMETRIC VERSUS ASYMMETRIC PROXIMITY MATRICES ... 282
APPENDIX H PRODUCT FRAGMENTATION AND PARTS AND COMPONENTS ... 285
H.1. PARTS AND COMPONENTS DEFINITION ... 285
H.2. PARTS AND COMPONENTS COMPOSITION OF DIFFERENT PRODUCT CLASSIFICATIONS ... 287
H.3. PERCENTAGE PARTS AND COMPONENTS OF MANUFACTURING EXPORTS IN DIFFERENT REGIONS ... 293
H.4. PRODUCT SPACE IN LEAMER PRODUCT CATEGORIES ... 294
APPENDIX I ‘PYECONLAB’ PYTHON PACKAGE ... 295
I.1. SUB PACKAGES ... 295
I.1.3. Trade ... 296
I.1.4. Util ... 298
I.1.5. WDI ... 298
CEPII Centre d’Etudes Prospectives et d’Informations Internationales
ECI Economic Complexity Index (Indicator)
FAP Final Assembly Product
FE Fixed Effects
FM Final Manufactures
FP Final Product
GDP Gross Domestic Product
GDPPC Gross Domestic Product Per Capita
GMM General Method of Moments
HO Heckscher-Ohlin
HS Harmonised System of international trade classification
IO Input-Output
!!" Matrix with Country and Product Data
MNE Multinational Enterprise
NBER National Bureau of Economic Research
PC Parts and Components
PCI Product Complexity Index (Indicator)
PS Product Space
PSB Production Sharing Based
PSN Product Space Network
RCA Revealed Comparative Advantage
SITC Standard International Trade Classification
FIGURE 1.1: BIPARTITE NETWORK OF 3 COUNTRIES AND 5 PRODUCTS ... 21
FIGURE 2.1: BIPARTITE NETWORK OF 3 COUNTRIES AND 5 PRODUCTS ... 35
FIGURE 2.2: METHOD OF REFLECTIONS FOR 2 ITERATIONS ... 36
FIGURE 2.3: NETWORK REPRESENTATION OF THE PRODUCT SPACE ... 44
FIGURE 2.4: COUNTRY INFORMATION IN NODES OF THE PRODUCT SPACE ... 45
FIGURE 3.1: BASIC MCP MATRIX ... 63
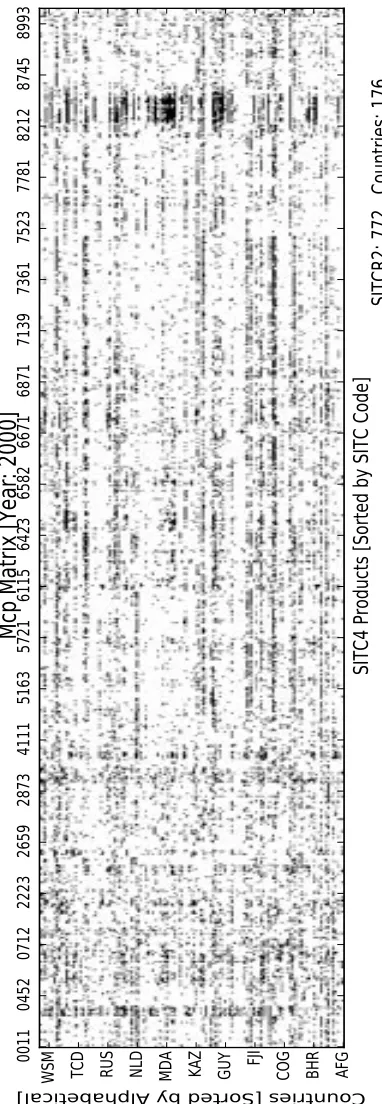
FIGURE 3.2: MCP FOR THE YEAR 2000 SORTED BY COUNTRY DIVERSITY AND PRODUCT UBIQUITY ... 64
FIGURE 3.3: MCP FOR THE YEAR 2000, SORTED BY GDPPC AND PRODUCT UBIQUITY ... 67
FIGURE 3.4: MCP FOR THE YEAR 2000, SORTED BY PHYSICAL CAPITAL STOCK AND CAPITAL INTENSITY ... 69
FIGURE 3.5: MCP FOR THE YEAR 2000 SORTED BY HUMAN CAPITAL STOCK AND HUMAN CAPITAL INTENSITY .... 70
FIGURE 3.6: MCP FOR THE YEAR 2000 SORTED BY LAND ENDOWMENT AND LAND INTENSITY ... 71
FIGURE 3.7: MCP FOR THE YEAR 2000 SORTED BY ECI AND PCI ... 73
FIGURE 3.8: MCP FOR THE YEAR 2000, SCALED BY COUNTRY SHARE IN WORLD TRADE AND PRODUCT SHARE IN WORLD TRADE ... 74
FIGURE 3.9: RCA FOR THE YEAR 2000, SCALED BY COUNTRY SHARE IN WORLD TRADE AND PRODUCT SHARE IN WORLD TRADE ... 76
FIGURE 3.10: GERMANY’S (DEU) RCA VECTOR SORTED BY PCI ... 77
FIGURE 3.11: ITERATIONS OF THE METHOD OF REFLECTIONS FOR THE YEAR 2000 ... 79
FIGURE 3.12: PATTERNS OF MCP MATRICES AND IMPACT ON THE ϕPPʹ MATRIX ... 82
FIGURE 3.13: PROXIMITY MATRIX FOR THE YEAR 2000 SORTED BY PCI ... 85
FIGURE 3.14: PROXIMITY SORTED BY K-MEANS CLUSTERING (GROUP PARAMETER OF 10) ... 86
FIGURE 3.15: PROXIMITY SORTED BY LALL (SITC L3) AND UBIQUITY (WITHIN GROUPS) ... 88
FIGURE 3.16: A MEASURE OF TRADE DEVIATION ... 90
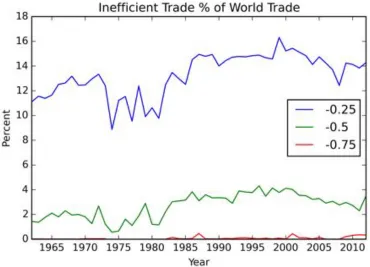
FIGURE 3.17: VALUE (% OF WORLD TRADE) OF PRODUCTS THAT ARE NEGATIVELY DEVIATED FROM COUNTRY RELATIVE POSITIONS ALONG THE DIAGONAL LINE OF SPECIALISATION ... 93
FIGURE 4.1: PROXIMITY HISTOGRAM FOR THE YEAR 2000 ... 108
FIGURE 4.2:PROBABLE AND IMPROBABLE CLASSIFICATION ALGORITHM ... 110
FIGURE 4.3: PRODUCT RELATIONSHIPS BETWEEN NEW EXPORTS AND CURRENT EXPORTS ... 112
FIGURE 4.4: TOTAL PROBABLE PRODUCT EMERGENCE FOR THE YEARS 1963 TO 2012 ... 117
FIGURE 4.5: TOTAL IMPROBABLE PRODUCT EMERGENCE FOR THE YEARS 1963 TO 2012 ... 118
FIGURE 4.6:COUNTRY EXAMPLES OF PROBABLE AND IMPROBABLE PRODUCT EMERGENCE AND TRADE LIBERALISATION EPISODES ... 119
FIGURE 5.1: WORLD EXPORTS OF PARTS AND COMPONENTS (PC) AND FINAL MANUFACTURES (FM) ... 142
FIGURE 5.2: WORLD SHARE (%) IN PARTS AND COMPONENT EXPORTS BY SELECT REGIONS ... 145
FIGURE 5.3: WORLD SHARE (%) IN PARTS AND COMPONENTS EXPORTS ... 146
FIGURE 5.6: PRODUCT SPACE (SITC REV 3. L5) IN ATLAS OF COMPLEXITY COLOURS ... 153
FIGURE 5.7: PRODUCT SPACE (SITC REV 3 L5) ATLAS LAYOUT IN LALL (2000) CATEGORIES ... 154
FIGURE 5.8: PRODUCT SPACE (SITC REV 3 L5) ATLAS LAYOUT WITH PARTS AND COMPONENTS ... 155
FIGURE 5.9: PROCESS OF PRODUCT FRAGMENTATION IN BIPARTITE NETWORK STRUCTURE ... 158
FIGURE 5.10: PROXIMITY MATRIX GROUPED INTO PSB AND FINAL GOODS, SORTED BY PRODUCT COMPLEXITY INDICATOR FOR THE YEAR 2000 ... 167
FIGURE 5.11: PROXIMITY MATRIX OF PARTS AND COMPONENTS ONLY IN THE YEAR 2000 ... 168
FIGURE 5.12: KENYA’S PRODUCT EMERGENCE DIAGRAM FROM 1995 TO 2013 ... 170
TABLE 3.1: TOP 20 NEGATIVE DEVIATIONS FROM THE LINE OF SPECIALISATION FOR THE USA IN THE YEAR 2000
... 91
TABLE 4.1: EXAMPLES OF PROXIMITY VALUES FOR THE YEAR 2000 ... 107
TABLE 4.2: EXPORT DATASET STATISTICS ... 114
TABLE 4.3: DESCRIPTIVE STATISTICS OF PROBABLE AND PERSISTENT EXPORT EMERGENCE FOR THE YEARS 1962 TO 2012 ... 121
TABLE 4.4: FIXED EFFECTS PANEL REGRESSION OVER ALL COUNTRIES ... 124
TABLE 4.5: FIXED EFFECTS REGRESSION OVER DEVELOPING COUNTRIES ONLY ... 125
TABLE 4.6: TRADE LIBERALISATION AND THE AVERAGE, VARIANCE, AND WIDTH OF PROXIMITY (FE ESTIMATES) [REGRESSION DATASET ‘D’] ... 128
TABLE 4.7: WIDTH OF DIFFUSION FOR ALL COUNTRIES ... 129
TABLE 5.1: BASIC STATISTICS OF TRADE DATASET ... 139
TABLE 5.2: GEOGRAPHIC PROFILE OF TOTAL EXPORT AND PSB EXPORTS (%) ... 143
TABLE 5.3: GEOGRAPHIC PROFILE OF TOTAL IMPORT AND PSB IMPORTS (%) ... 144
TABLE 5.4: SHARES OF PSB PRODUCTS IN MANUFACTURING EXPORTS (%) ... 148
TABLE 5.5: SHARES OF PSB PRODUCTS IN MANUFACTURING IMPORTS (%) ... 149
TABLE 5.6: AIRCRAFT COMMUNITY IN THE PRODUCT SPACE ... 151
TABLE 5.7: ECONOMIC COMPLEXITY INDICATOR (ECI) RANKS WITH FINAL ASSEMBLY PRODUCT ADJUSTMENTS FOR THE YEAR 2000 ... 162
TABLE 5.8: PRODUCT COMPLEXITY INDICATOR (PCI) RANKS WITH FINAL ASSEMBLY PRODUCT ADJUSTMENTS FOR THE YEAR 2000 ... 163
TABLE 5.9: PROXIMITY DESCRIPTION FOR DIFFERENT PRODUCT TYPES ... 164
TABLE 5.10: PROXIMITY BETWEEN AND WITHIN FINAL PRODUCTS AND PARTS AND COMPONENT MANUFACTURES ... 165
CHAPTER 1
INTRODUCTION
“Ultimately, development is the expression of the total amount of productive knowledge that is embedded in a society. But the process by which this knowledge is accumulated has a structure that we are only now starting to understand.” (Hausmann & Hidalgo 2014)
International trade is one of the fundamental driving forces behind economic development and globalisation. Trade orientation is often noted as one key feature of any successful development story, as the South East Asian experience has so successfully demonstrated in recent decades. This view is supported by arguments grounded in international trade theory (Ricardo 1817; Haberler 1930; Ohlin 1933; Samuelson 1949; Vanek 1963; Dornbusch, Fischer & Samuelson 1977; Dixit & Norman 1980; Wilson 1980; Leamer 1984; Evenett & Keller 2002; Eaton & Kortum 2002; Fisher 2011; Chaney 2014), as well as a large body of empirical trade research that seeks to identify the variety of channels that link trade and development (Krueger 1997, 1998; Baldwin & Gu 2004; Winters 2004; Wacziarg & Welch 2008; Topalova & Khandelwal 2011; Costinot, Donaldson & Komunjer 2011; Costinot & Donaldson 2012). Much of the economic literature travels down the road of increasing complexity as models and analytical methods improve to allow for more realistic assumptions, or to incorporate different phenomenon that we observe from real world trade data such as intra-industry trade.
levels of economic development, both across countries and dynamically over time. Another finding is that clusters of highly related products found within a network that is constructed from a revealed measure of product similarities (the product space), exhibit strong correlation with more traditional product classifications that are used to group products according to type in the empirical trade literature (Leamer 1984; Lall 2000; Hausmann & Klinger 2006; Hidalgo et al. 2007). What these early findings suggest is that alternative techniques, such as the network complexity approach, offer interesting new measures that incorporate a high degree of explanatory power in differentiating between different development paths, and can be complementary to the more traditional forms of analysis.
The network complexity approach incorporates a new dimension for analysis by preserving embedded relational information and structure. This allows for more micro-level contextual analysis to be done in collaboration with broader macro-micro-level analysis. The idea of adopting a network analysis approach is not entirely new to the study of international trade given the rich theoretical and empirical literature surrounding the gravity model (Anderson 1979; Feenstra 2001; Evenett & Keller 2002; Anderson & van Wincoop 2003; Silva & Tenreyro 2006; Helpman, Melitz & Rubinstein 2008; Chor 2010). The gravity model describes a network in which one estimates the edge values (i.e. value of exports) between any two countries (i.e. nodes) dependant on different attributes of nodes and edges. In the standard gravity model, GDP is an example of a node attribute, while the distance between two countries is an edge attribute. Network science, in recent years, has rapidly expanded to provide a rich analytical toolkit, that is not only geared towards edge value predictions, but also allows the analysis of broader structural consequences that relational data can imply. For example, network analysis provides a range of different measures of centrality that can emphasise direct network relationships, or higher-order relationships based on the connectivity structure of the network.
construct a network, the focus in this thesis is on the bipartite network, a mapping between countries and the products that they export.1
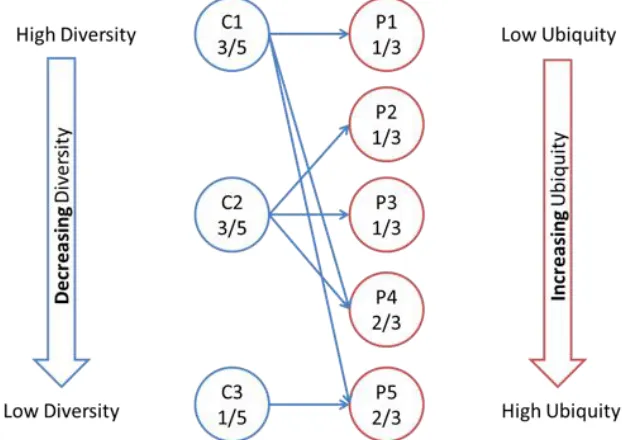
[image:21.595.165.476.354.574.2]As demonstrated in Figure 1.1, consider a column of country nodes and a column of product nodes. The edges (that are defined in the diagram) pair countries with the products that they export with revealed comparative advantage. From the perspective of each country node, the sum of all edge links is a measure of diversification (the total number of exported products from a given country). Applying the same operation from the perspective of a product node provides a measure of ubiquity, a uniqueness rating for any given product. A ubiquitous product is one that is exported by many countries. Ubiquity and diversity, as determined by the bipartite network structure, are at the core of the recent literature on economic complexity.
Figure 1.1: Bipartite Network of 3 Countries and 5 Products
Notes: 1. The blue lines connect each country to the products that it exports. 2.
Countries are sorted by decreasing diversity (the total number of products that a country exports), and products are sorted by increasing ubiquity (total number of countries that export that product).
This thesis adds to the network complexity analysis research by first considering how these network methods relate to the standard theoretical foundation of comparative
advantage. There is a vast amount of literature regarding the different sources of comparative advantage arising from differences in technologies (Ricardo 1817; Dornbusch, Fischer & Samuelson 1977; Wilson 1980) or from differences in factor endowments (Ohlin 1933; Vanek 1963; Deardorff 1982). One of the key conclusions arising from this literature on international trade is that country heterogeneity is a fundamental determinant of comparative advantage. Any trading equilibrium that offers a different opportunity cost between any two goods to that which would otherwise be found in autarky provides an opportunity for gains from trade to be realised.2 It is this heterogeneity that fits naturally within a network analysis framework. Network analysis techniques preserve disaggregation and can be used to analyse this heterogeneity at both the micro and macro levels.
Chapter 2 provides a primer on the network complexity analysis pioneered by Hausmann & Klinger (2006) and Hidalgo et al. (2007), and outlines the two primary strands of the foundational literature on which this thesis stands. The chapter explains how economic and product complexity indicators are computed and builds an understanding of the techniques using a small model of three countries and five products. This is then followed by the introduction of the product space, which is a network representation of revealed product similarities.
The focus of Chapter 3 is to examine the mechanics of how the product complexity indicators are computed in the context of predictions made by the mainstream theories of comparative advantage. One key outcome of comparative advantage is its emphasis on resultant patterns of specialisation that form from the international reorganisation of production. However, determination of these patterns quickly becomes confounded when considering the real world context of many-countries and many-products. General laws of comparative advantage often suffer from the presence of multiple solutions and the inability to determine the exact cross-sectional pattern of trade without imposing additional assumptions to the model.
The network complexity framework approaches identification of trade patterns directly from the data, rather than an underlying theory. The Balassa (1965) measure of revealed comparative advantage is used to identify products that each country is
relatively good at producing. This serves as an input for the construction of the bipartite mapping between countries and products used in the method of reflections to compute economic and product complexity.3 The network techniques are commonly discussed with a focus on two characteristics of trade: country diversity and product ubiquity (Hidalgo et al. 2007; Tacchella et al. 2012). A diverse country that exports many non-ubiquitous products will be ranked as more economically complex when compared with a country that has concentrated and ubiquitous exports. An alternative perspective is to view the method of reflections as a sorting heuristic that works to organise rows and columns in the cross-country trade matrix to deliver a pattern that is consistent with the notion of specialisation. Viewed in this way, ECI, PCI and the product space reveal patterns that are intrinsically linked with the predictions of both the Ricardian and Hecksher-Ohlin models.
Chapter 4 presents an empirical study that looks at trade liberalisation and the structural effects it has on patterns of export emergence across the product space network. A network of product similarity is used to characterise the structural change in export patterns by considering both the rate and distance of product emergence by comparing pre-liberalisation to post-liberalisation levels. To capture the rate of product emergence, the extensive margin is split into products that are near (probable) and far (improbable) from that country’s position in the product space network. Additional measures that describe the relative distance of product diffusion are also computed to explore a continuous measure of diffusion distance. Both of these indicators are in turn used in a panel regression to estimate the impact of trade liberalisation on diffusion patterns. The findings indicate that trade liberalisation is associated with an 18% to 24% increase in the rate of product emergence and a moderate shift to exports that are increasingly dissimilar to those in the pre-reform export basket. This provides some indirect evidence that trade liberalisation is therefore supportive of both the accumulation and diversification of the underlying set of capabilities in an economy.
The process of product fragmentation and its impact on the quality of information contained in the observed bipartite network structure between countries and products is the topic discussed in Chapter 5. Through improvements in production technology, coupled with large reductions in transportation costs, product fragmentation in recent decades has allowed developing countries to participate in the production of relatively complex products by providing assembly services based on their comparative advantage in labour. Products that are most susceptible to this process, called final assembly products (FAP), are identified and then differentiated by income level in the cross-country pattern of trade.
Once final assembly products are differentiated the results show that countries in East and South East Asia, in addition to Eastern Europe, drop in the economic complexity rankings due to the altered structure of the bipartite network. Low-type final assembly products, those made by less developed economies, are also typically found in the bottom quartile of the product complexity rankings. The positive bias in complexity is due to the network links between developing economies that specialise in the assembly segment of production and more advanced developed economies, such as Japan and Germany, which export products in the same SITC product code. More developed economies are both more likely to have the full suite of capabilities required to produce all segments of a product, and are likely to produce higher quality products. In this instance, network analysis inaccurately links the two types of economies, which inflates the developing economy complexity ranking due to the indirect association to relatively more advanced economies (that have lower average product ubiquity and higher average diversification) that is propagated through the network analysis.
participation in more sophisticated final goods. The same result was not observed in the Electronics sector, which found equal rates of diffusion between the three product groups. This is likely due to the restricted time frame of the sample to the years 1995 and 2012, or could be a reflection that it is hard to differentiate between final products and final assembly products within the already mature Electronics sector. The Electronics industry has been a frontier sector in the process of product fragmentation, in which much of the global dynamism may have occurred prior to 1995 not allowing it to be captured in this study.
A secondary outcome of the research undertaken for this thesis is the development of a Python package: pyeconlab. This package will be made available through github and will serve as a platform for future work with product level trade data. The package is split into sub modules for cleaning different datasets, compiling basic statistics, and building standardised data structures that can then be used with a variety of analytical tools. The heart of the package consists of python objects that make working with product level trade data much simpler. More details of this work can be found in Appendix I.
System (HS92) and is concorded to SITC revision 3 at the 5-digit level to enable the identification of parts and components at a sufficiently disaggregated level.
In summary, this thesis is a collection of essays that provide three main contributions. First it shows a complementarity between the traditional literature of comparative advantage and new network analytical techniques. These new analytical techniques can be viewed as a sorting heuristic that organises countries and products along a diagonal line of specialisation that correlates with patterns that are determined by theories of comparative advantage. Relatively complex countries tend to specialise in relatively complex exports, albeit with a large degree of observed heterogeneity. A key advantage of the new network complexity techniques is that they perform well in a many-country, many-product environment, an environment in which traditional analysis becomes complex and plagued with multiple solutions without the imposition of further assumptions on the underlying theory.
Second, the network complexity approach provides disaggregated metrics that are useful when looking at the structural evolution in country export baskets over time. This thesis uses the product space network as a way to characterise how country exports structurally change in light of trade liberalisation policy. This analysis shows that trade liberalisation tends to increase the rate of export emergence, in addition to a moderate increase in the distance of diffusion. These findings imply that trade liberalisation assists to increase the rate of accumulation and the level of diversity in underlying country capabilities on the export side.
CHAPTER 2
ECONOMIC COMPLEXITY AND THE NETWORK
STRUCTURE OF INTERNATIONAL TRADE
“By using data on the products exported by each country … it is possible to create measures of an economy that conserve the identity of the elements involved.” (Hidalgo 2015, pg. 162)
Abstract
The network structure of trade can be used to derive revealed measures of economic and product complexity. These new metrics fundamentally rely on two characteristics of trade: country diversity and product ubiquity. A complex economy is one that is both diversified and exports many non-ubiquitous (rare) products, whereas an un-complex economy has concentrated exports in a few ubiquitous products. This chapter surveys these new economic complexity analysis techniques to provide a platform from which the remaining chapters are based. The concepts underpinning the economic and product complexity
indicators (ECI and PCI), and the product space network are explained using a
small 3-country 5-product model.
2.1 INTRODUCTION
Network complexity analysis is one approach to understanding economic systems based on the multidisciplinary branch of the computational sciences, often referred to
as complexity economics (Arthur 2013; Helbing & Kirman 2013; Krishna & Levchenko
Deem 2010; Baskaran et al. 2011; Barigozzi, Fagiolo & Mangioni 2011; Kali et al. 2013; Benedictis et al. 2013; Chaney 2014; Dueñas & Fagiolo 2014; Shi et al. 2014; Zhu et al. 2014). In essence, adopting a network approach can be useful for analysing any form of relational data.
The network complexity approach developed by Hausmann and Hidalgo and their co-researchers, is a data-centric technique that is used as a foundation for this thesis. It casts the cross-sectional pattern of trade into a bipartite network between countries and their exported products (Hausmann & Klinger 2006; Hidalgo et al. 2007; Hidalgo & Hausmann 2008; Hausmann & Hidalgo 2014). The bipartite network is formed by filtering trade data through the Balassa (1965) definition of revealed comparative advantage (RCA) as a way to identify products that a country is relatively “good” at producing. 4 Another way to interpret the Balassa indicator is that it identifies products in country export baskets that have a higher share than the average expectation based on world product shares (Kunimoto 1977). While other measures of RCA are available, for the purpose of continuity with other research, the Balassa RCA indicator is used as the foundational indicator in this thesis.5 The other measures are reviewed and discussed in Appendix B.
This measure of revealed comparative advantage (RCA) is defined:
!"!!" = !!"
!!" !
!!" !
!!" !,!
where,
!!" = Export of product p from country c !!"
! = Total export from country c
4 The use of the word filter is used in this context as this indicator of revealed comparative advantage is reducing noise that is contained in international trade data by excluding products that a country may export but not relatively well.
!!"
! = Total export of product p !!"
!,! = Total world export
There are two primary strands to this literature: (1) revealed indicators of economic complexity (ECI) and product complexity (PCI), and (2) the product space (PS). The complexity indicators use two primary dimensions – country diversity and product ubiquity – to rank countries and products.6 Complex economies are classified as those that are diversified as well as having relatively non-ubiquitous products.
The product space, on the other hand, uses the cross-country pattern of trade to compute conditional probabilities of co-export as a revealed measure of product similarities. The information contained in this measure is best represented as a network in which product proximity is indicative of similarity in the factors of production. The key assumption is that two products exported by a similar set of countries, are most likely to exhibit similar underlying capabilities (or factors of production). It is useful to think of country capabilities as an overarching abstraction that includes the usual factors of production capital, labour, land, and other inputs such as production technology, information, institutions, or anything else that influences the capacity to produce.
The starting point for computing ECI, PCI, and the PS is the cross-country pattern of exports, as defined by the M!" matrix.7 Exports are used as an internationally comparable data source that indirectly provides information about what production capabilities a country has acquired through the types of products that are exported. Using the RCA matrix, the M!" matrix is derived by coding this information into a binary relationship between countries and products, focused on a cut-off value in which RCA is greater than or equal to one (!"#≥ 1).8 Therefore countries are deemed to be relatively good at producing a certain product when that product holds
6 It shares some similarities with the rankings defined by Feenstra & Rose (2000) which is motivated by the product-cycle theory of international trade (Vernon 1966).
7 Economic and product complexity indicators (ECI and PCI) and the Product Space (PS) are computed using a library of functions written in Python, which are described in Appendix H.
a value share in country exports that is greater than that products share in world trade. The M!" matrix defines the set of products that are produced by all countries in any given year. For convenience the t subscript has been dropped from the following notation.
!!" = 1 0
!"#≥ 1
!"#< 1
The !!" matrix therefore takes the form: 9
!!" =
(!"#≥ 1)!!!,!!! ⋯ (!"#≥1)!!!,!!!
⋮ ⋱ ⋮
(!"#≥1)!!!,!!! ⋯ (!"#≥ 1)!!!,!!!
!
This !!" matrix incorporates two direct primary statistics: country diversity and
product ubiquity. Diversity and Ubiquity are defined as:
!"#$%&"'(=!!,! =∑
!!!"
!"#$%#&'= !!,! = ∑
!!!"
Country diversity is computed by summing across the columns of the matrix, which is counting the number of products any given country exports with RCA and provides a direct measure of diversification. Summing down each column, on the other hand, gives a measure of product ubiquity. A product that is exported by many countries is deemed ubiquitous.
2.2 ECONOMIC AND PRODUCT COMPLEXITY
The method of reflections is an iterative procedure to compute a ranking of country
complexity (ECI) and product complexity (PCI) indicators. Using country characteristics (diversity) and product characteristics (ubiquity) of exports, the method involves successive averaging over the contextual bipartite network structure between countries and products. Both country and product characteristics, as defined by the bipartite network, are the key determinants to the economic complexity approach. It is
this incorporation of context that sets this technique apart from others. The method of reflections iterates over these two dimensions, normalised by product ubiquity and country diversification, as defined by the jointly determined equations below.
!!,! = 1
!!,! !!"
!
⋅!!,!!!
!!,! =
1
!!,! !!"
!
⋅!!,!!!
where,
!!,!is a vector containing each countries’ diversification score !!,! is a vector containing each products’ ubiquity score
!!,! is the nth iteration over the country dimension
!!,! is the nth iteration over the product dimension
While this procedure converges towards a global fixed-point value, iteration is terminated when a stable rank ordering of countries and products is achieved. The rank ordering of countries and products can be used as the indicator of economic and product complexity respectively. A country that exports a diversified range of products, and at the same time exports relatively unique (non-ubiquitous) products, is deemed as relatively economically complex.
These rankings can be better understood by considering the mechanics behind the method of reflections. The first iteration of this method characterises country export baskets by computing the average product ubiquity for each country.10 The next iteration computes average country diversity of the average product ubiquity. Therefore higher order influences, based on the network structure, are propagated with subsequent iteration. A relatively less complex economy’s complexity ranking would increase if it exported a product that is (a) relatively unique and (b) exported by relatively diversified economies that also produce other relatively unique products.
These higher order influences play an important role in determining the final rank of countries and products.11
!"# =!"#$%&' !"#$ !ℎ!" ∆!"#$ !!,!−!!,!!! = 0 !"# ∀! ∈ !
!"#=!"#$%&' !"#$ !ℎ!" ∆!"#$ !!,!−!!,!!! = 0 !"#∀ ! ∈!
The recent atlas of complexity considers the eigenvector of the second largest eigenvalue of the recursive formulation of the above equations (Hausmann & Hidalgo 2014). The reason the method of reflections formulation is used here is that it allows one to more clearly understand the mechanics of the underlying computation. Both approaches yield very similar results. The recursive formulation is defined in Appendix C.
2.2.1 EXAMPLE: 3 COUNTRIES, 5 PRODUCTS
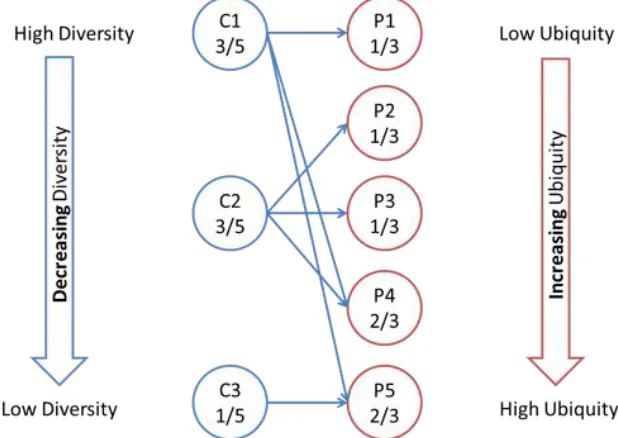
To explore the mechanics behind this iterative method, consider the case of three countries (C1, C2, and C3) and five products, as shown in Figure 2.1. The bipartite network structure in Figure 2.1 sorts’ country nodes by decreasing diversity and product nodes by increasing ubiquity. The tied relationships that can be observed in the diagram are arbitrary.
The resulting !!" matrix of this bipartite network is:
!"#=
!1 !2 !3 !4 !5 !1
!2
!3
1 0 0 1 1
0 1 1 1 0
0 0 0 0 1
Now let us explore how the network information assists in ranking countries and products to compute the ECI and PCI indices. Figure 2.2 traces the logic of the method of reflections through two iterations.
Figure 2.1: Bipartite Network of 3 Countries and 5 Products
Notes: 1. The blue lines connect each country to the products that it exports. 2.
Countries are sorted by decreasing diversity (the total number of products that country exports), and products are sorted by increasing ubiquity (total number of countries that export that product).
Starting with the initial bipartite network, the method of reflections computes the average product ubiquity of each country’s exports.12 Therefore, as Country 1 is connected to P1, P4, and P5, the average ubiquity score for this country is:
1
3+
2
3+
2
3 ∗
1 3 =
5
9≅ 0.56
For C2 and C3, the average product ubiquity scores are is approximately 0.44 and 0.67 respectively. Country 2 has a lower average product ubiquity, which induces a change in the country rank from C1-C2-C3 to C2-C1-C3 when ordered based on the computed average values. The reason is that Country 1 exports one non-ubiquitous product and two relatively ubiquitous products, while Country 2 exports two non-ubiquitous products and one relatively ubiquitous product. Both Country 1 and Country 2 share the same diversity score, but due to the different product ubiquity compositions, the average ubiquity is lower for Country 2 and therefore scores a lower average on the
country complexity ranking.13 Country 3 only exports one relatively ubiquitous product. This country is deemed less complex by the lack of diversity and the relative ubiquity of its product. The key assumption here is that on average, relative uniqueness in products is associated with a higher required levels of complexity as a precondition to export them.
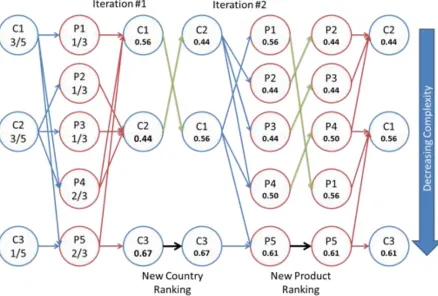
Figure 2.2: Method of Reflections for 2 Iterations
Notes: 1. The first two columns of this diagram show the bipartite network observed in
Figure 2.1. The diagram then demonstrates the iterative process to compute ECI and PCI on a reduced example of 3 x countries and 5 x products. 2. Within each step of the iteration process, stage one shows the country or product node values computed through the method of reflections, and stage two considers any change in the ranking of countries or products prior to the next iteration. 3. The final two columns show the rankings of Products and Countries with decreasing revealed measures of complexity.
Further iteration yields information relevant for product nodes, this time computing the average diversity of the average country ubiquity for each product. Here Product 1 is exported by Country 1 only, which makes it the average product ubiquity of Country 1 (~0.56). Products 2 and 3 are only exported by Country 2 and therefore exhibit
scores of (~0.44, ~0.44) respectively. Product 4 however is exported by Country 1 and Country 2 and is computed by averaging the two countries’ average ubiquity scores:14
0.44+0.56 1
2≃ 0.50
Similarly for Product 5, there are two exporters and the result is averaged scores of Country 1 and Country 3. This process of iteration continues until rank convergence in both countries and products is achieved. Each odd step reveals country ranking information, and each even step reveals product-ranking information as the method reflects averages over both dimensions of the bipartite network structure. As the number of iterations gets large, the values converge towards a global fixed point. Therefore country diversity and product ubiquity information is captured in the small deviations from this global average.15 These deviations allow for ordinal information (rank) to be captured.
2.2.2 RELATIONSHIP TO OTHER MEASURES OF DIVERSIFICATION OR CONCENTRATION
Here the method of reflections is briefly compared with the Herfindahl metric that is frequently used in economic analysis to measure country diversification. The real benefit of the method of reflections is that it integrates diversification information alongside product ubiquity information to extract more meaningful contextual information.
The Herfindahl index of concentration is defined as:
! =∑!!! !!!
!
where
!! =share of export in product i
14 As this method converges to a global fixed point, floating point numbers are used to distinguish rank order.
While a good measure of diversification, the Herfindahl index cannot differentiate between a country that exports 20 percent wheat and 80 percent pineapples with one that exports 20 percent automobiles and 80 percent aircraft.16 While the two aforementioned economies are equally diversified, the products that they export have vastly different characteristics requiring different levels of sophistication. This highlights a key benefit of the network approach, in that it incorporates product characteristics that are endogenously defined by the bipartite structure over all exporters.
2.2.3 RELATING TO COUNTRY CAPABILITIES
The previous section demonstrated how the network complexity measures are computed, focusing on the mechanics rather than the meaning. In this section the conceptual foundation is discussed using the dominant explanation in the literature, which uses an abstract set of country capabilities in the context of the two key parameters: diversity and ubiquity (Hausmann & Klinger 2006; Hidalgo et al. 2007; Hidalgo & Hausmann 2008; Hausmann & Hidalgo 2011, 2014). Conceptually the set of capabilities could include anything ranging from factor endowments, product-specific technological processes, supportive trade and non-trade infrastructure, institutions – in essence, it can be any factor that allows a country to be more “capable” in production.
The key assumption in the network complexity model is that countries with a larger and more diverse set of underlying capabilities are able to combine them in more complex ways, which from a combinatorial perspective, provides a greater capacity to innovate and endogenously produce other capabilities (in turn being able to produce new goods and services). From this perspective, complexity increases as countries acquire new capabilities through a process of accumulation. The unobserved set of capabilities can be measured indirectly through the analysis of the observable outcomes of this underlying process.
So what are capabilities? Let us consider Adam Smith’s famous pin factory. The factory requires a number of inputs to enable it to produce pins. First it requires land, labour, and capital. However what are really required are specific types of land, labour, and capital that are fit for purpose. A pin worker needs specific human capital to know what to do to make a pin. In addition there are many different ways one could make pins, which fundamentally relies on the way that land, labour, and capital are organised. Adam Smith made the case for the reorganising of production through the specialisation of labour to maximise efficiency. Capabilities can therefore include new methods of production; more modern examples include new production methods such as just in time inventory management. The atlas of complexity groups all of these factors and treats them as “knowledge that is embedded in society”. Some elements in the set of capabilities are measurable, while others are not.
The literature primarily links this set of capabilities to country diversification and product ubiquity. These two indicators are observable measures that can be used to infer characteristics of the unobservable attributes of the set of capabilities.
The diversity of a country’s exports is a crude approximation of the variety of capabilities available in the country, just as the ubiquity of a product is a crude approximation of the variety of capabilities required by a product. (Hausmann & Hidalgo 2014, p. 20)
Having the capacity to produce a larger number of products is indicative of having a larger underlying set of capabilities. Ubiquity is a measure of the relative rareness of products that this capability set is able to produce as an indicator of the type of capabilities that are contained in each country set of capabilities. It is not these indicators in isolation that determines overall complexity, it is the joint effect of diversification, in addition to the type of products (as determined by ubiquity) that determine levels of complexity. The method of reflections averages over both dimensions using the bipartite network structure of trade, where diversified countries that export more unique (non-ubiquitous) products are ranked as more complex than countries that exhibit relatively concentrated exports in ubiquitous products.
diversity and ubiquity together (Hausmann & Hidalgo 2014). Consider the following two products and countries: 17
Medical imaging devices are only made by a few countries such as Germany and the United States, which are both highly diversified exporters. Medical imaging devices are therefore complex because they are both non-ubiquitous (inferred to mean they require a novel set of capabilities to produce) and in addition are exported by countries that are inferred to have large underlying sets of capabilities due to a high degree of diversification.
Diamonds are only made by a few countries such as Botswana and Sierra Leone. Given this rarity one may conclude that diamonds’ are difficult to produce, but the fundamental reason for this rarity is due to geographic endowments. Once the structures of Botswana and Sierra Leone’s exports are taken into account these countries are, however, relatively concentrated in the export of resources and lack diversification. These average country characteristics can be used to discount the observed rareness.
As these examples demonstrate, the attributes of country diversification and product ubiquity in concert provide useful information regarding underlying capabilities based on context.
2.3 THE PRODUCT SPACE: A STRUCTURAL VIEW OF PRODUCT
SIMILARITIES
Another strand of the economic complexity literature considers a structural view of exports by constructing a network of product relatedness called the product space. The same !!" matrix can be used to define a proximity !!!ʹ matrix that considers the
cross-sectional conditional probability of co-exporting any two products !(!! ∣!!). Proximity is a measure of product relatedness, and is a useful transformation of the data contained in the !!" matrix when exploring the links to the HO model (Chapter 3)
and providing structure to study diffusion characteristics (Chapter 4).
Proximity is computed from the minimum joint probabilities of co-exporting any two goods, Product 1 (P1) and Product 2 (P2): 18
!!!!! = ! !!!! •!!!! !"#(!!!,!,!!!,!)
As conditional probability is not a symmetric function (i.e. !(!! ∣!!) ≠!(!! ∣!!)), the denominator is taken to be the maximum ubiquity between Product 1 (!!) or Product 2 (!!).19 This uses the most conservative conditional probability and forces the relationships to be symmetric, an important property when finding a minimum spanning tree for visualising the network.20 Symmetry is a useful property in the network context, as it enables the construction of an undirected network, where the relationship shared between any two nodes (also known as an edge) is the same. Put more simply, proximity is derived as the number of countries that export both !! and !!, divided by the total number of countries that export !! or !! (whichever is higher). The resultant square matrix takes the form:21
!!!ʹ=
!ʹ
!
1 ⋯ ! !!!!!!"ʹ! !"#(!!!,!,!!ʹ!,!)
⋮ ⋱ ⋮
!!!! ! !!"ʹ!
!"#(!!!,!,!!ʹ!,!) ⋯ 1
In practice proximity quantifies the main idea that if any country exports t-shirts it is more likely to export trousers than it is to export automobiles. Framed using the capabilities approach, given that t-shirts and trousers share more similar factors of
18 Minimum conditional probabilities are used so the network remains undirected. This means that when two column vectors of cross-country product patterns are multiplied elementally the sum of joint products is divided by the maximum of either product’s ubiquity (the sum of each column vector in the !!" matrix).
19 The idea of using asymmetric probabilities is discussed in Appendix G. The primary disadvantage is that it generates a directed network.
20 In network science terminology, a symmetric similarity matrix forms an undirected network, which is advantageous in that it allows the use of many network algorithms that depend on this characteristic (such as Minimum Spanning Tree). A minimum spanning tree is a sub graph that has a minimum number of edges but ensures a complete network (where all nodes are connected).
production such as labour skills (i.e. sewing), they are much more likely to be co-exported. T-shirts and automobiles, on the other hand, do not share many similar factors or capabilities. While the two products may have some overlapping factors (i.e. production of seats requires some similar capabilities as T-shirts in that stitching and sewing are both inputs to both products), automobiles are more complex products and thus require more capabilities than would be required of producing t-shirts. In this case, automobiles require both a different set of inputs and a more diverse range of required capabilities (such as higher levels of human and physical capital) to produce. Proximity is therefore a measure of similarity in the unobserved set of capabilities. The key to symmetric conditional probability is that it produces high scores for products that have relatively similar ubiquity characteristics as well as being exported by similar countries. Proximity therefore serves as an indirect measure of overlap in the underlying set of capabilities. In the product space, two products that are near to each other are likely to share capabilities that are required to make each product. Products that are far away have very different sets of capabilities that are required in their underlying production processes. This idea is often best visualised as a network which intuitively captures the idea that some products are more similar to each other according to their relative positions to one another.
This constructed product space has already delivered some interesting findings. Countries that specialise in the periphery of the product space typically have lower gross domestic product per capita (GDPPC) relative to a country that is spread across the product space (Hidalgo et al. 2007).22 In addition countries tend to diffuse locally to products that are close to other products that it currently exports.
2.3.1 EXAMPLE: 3 COUNTRIES, 5 PRODUCTS (CONTINUED)
Continuing with the three-country, five-product example used to explore measures of economic and product complexity, we can compute the proximity matrix and observe how it relates to a network representation of a product space matrix. A network diagram is adopted to explore the notion of a core and periphery structure that is observed and why it forms.
22 The atlas of complexity provides access to numerous country product space maps.
Recall the sorted !!" matrix:
!!" =
!2 !3 !4 !1!5 !2
!1 !3
1 1 1 0 0
0 0 1 1 1
0 0 0 0 1
In this matrix rows are sorted by the economic complexity indicator and columns are sorted by the product complexity indicator. The proximity matrix is computed by comparing all pairwise combinations of products (columns in the matrix). Each column is pairwise multiplied and then summed to compute the total number of countries that export both products. This sum is subsequently normalised with the maximum ubiquity characteristics of either column, which is equivalent to the minimum conditional probability of co-export. The resultant matrix is:
!!!ʹ =
!2 !3 !4 !1 !5 !2
!3 !4 !1 !5
1 1 0.5 0 0
1 1 0.5 0 0
0.5 0.5 1 0.5 0.5 0 0 0.5 1 0.5
0 0 0.5 0.5 1
Figure 2.3 shows one of many possible clustered network layouts of the proximity relationships between products. 23
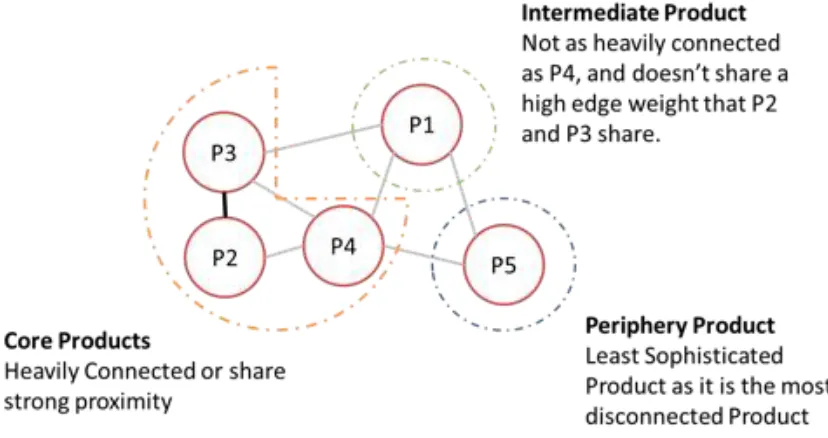
Figure 2.3: Network representation of the product space
Notes: 1. Nodes in the network represent Products. 2. Edges in the network are
proximity values computed through conditional probability of co-export. 3. This diagram only presents one possible clustering and relative layout of nodes.
What is evident is that P2, P3, and P4 are more heavily connected (based on edge weights and the total number of edges that connect them to one another) than P1 and P5. P5 is a less connected periphery product. P1 could be considered an intermediate product with relatively high connectedness but relatively low edge weights. Other clustering outcomes can also be considered and depend on the algorithms used to analyse the network. In the product space literature, random walk clustering is employed to find the 34 product space communities (Hidalgo et al. 2007).24
Overlaying country information within each product node identifies a country’s relative position in the product space. Countries that are rated as more complex
23 Given a network consists of relational data, there are many ways to view the actual layout of nodes. Network science uses many visualisation techniques, such as force-directed layouts to view the structure of relationships. However many of these techniques will never produce the same exact layout due to random starting conditions.
typically occupy the densely-connected core of the product space, as illustrated in Figure 2.4. In this instance Country 3 occupies a single periphery product node (marked in blue dotted lines). Country 3 exports one product P5 that has a direct relationship with P4 and P1. The connections suggest that countries that export P5 tend to also export P1 and P4. However P5 has relatively low proximity values that connect it to P1 and P4 due to the large ubiquity effect operating through the denominator of the conditional probability. Country 2 on the other hand occupies all of the densely connected core products P2, P3, and P4 in the network and is classified as the most complex economy.
Figure 2.4: Country Information in Nodes of the Product Space
Notes: 1. This is the same diagram as Figure 2.3 except country information has been
placed on each node in the network. 2. This presents only one possible clustering and network layout.
2.4 LIMITATIONS OF FOCUSING ON EXPORTS
To conclude this discussion it is important to note some limitations of the economic complexity and product space approach, particularly with respect to its focus on export data. These limitations are summarised in the following three points (Hausmann & Klinger 2006):
1. Uses export data rather than country production data. This is a limitation as
exports are not necessarily a full representation of what a country has the ability to produce (domestic market production and non-tradeables).
2. Collected export data captures goods but not services. Services are an increasingly
important component of world trade, particularly as developed countries transition from production-based economies to service based economies.
3. Export patterns are observed ex-post and are influenced by various distortions
such as tariffs and other protectionist policies, which could distort the pattern of exports which serves as an input to these data intensive techniques. (e.g. domestic agricultural subsidies in the USA and Europe have the capacity to distort export patterns).
2.5 CONCLUSION
The purpose of this chapter is to serve as a primer for the network complexity approach that is used in the remainder of this thesis. The key benefit of these new analytical techniques is that they operate at high levels of disaggregation, which allows for a larger degree of heterogeneity when compared to aggregative approaches such as Leamer’s ten types of products or Lall’s technological intensity classification. The disaggregated analysis, made possible by the network complexity approach, caters to the great richness of variation we often observe between countries and allows for more detailed contextual analysis.
CHAPTER 3
THE THEORY OF COMPARATIVE ADVANTAGE
AND PRODUCT COMPLEXITY ANALYSIS
“Economists ought to abandon the idea that models are either true or false in favour of the notion that models are sometimes useful and sometimes misleading” (Leamer, 1993)
Abstract
This chapter relates the measurement of economic complexity back to the traditional literature on international trade to show that the two approaches are complementary. The method of reflections can be viewed as a sorting heuristic that provides a ranking of countries and products in a many-country, many-product setting that reorders the information contained in the global pattern of exports to be in line with macro patterns of specialisation. These observed patterns of specialisation are broadly comparable to those predicted by both the Ricardian and Heckscher-Ohlin models of international trade.
3.1 INTRODUCTION
from this viewpoint, the rankings of economic and product complexity are correlated to the patterns of specialisation we would expect to observe based on the two fundamental theories of comparative advantage.
The chapter is structured as follows. The theory of comparative advantage is discussed in Section 3.2, with a focus on how it relates to the real-world context of many countries, many products, and many factors. Both the Ricardian and Heckscher-Ohlin frameworks are used to set expectations regarding the structure of the !!" matrix in this high dimensionality setting. The economic complexity and product space approach is then discussed in Section 3.3. The data driven analytical techniques used in computing revealed measures of the economic complexity index (ECI) and the product complexity index (PCI) are briefly reviewed. These measurements are then framed in the primary explanatory framework of country capabilities and compared to the Ricardian and Hecksher-Ohlin models. This section then brings the two theoretical discussions together by considering their intersection at the cross-country pattern
(!!") of international export data for the year 2000.25 A key outcome of Section 3.3 is
that it demonstrates how effective the method of reflections technique is at producing the multi-dimensional indicators of revealed economic and product complexity. In Section 3.4 a new measure of trade distortion is proposed and computed, using real-world data, to demonstrate this observed complementarity. Section 3.5 provides the main conclusions from this chapter.
3.2 THE THEORY OF COMPARATIVE ADVANTAGE
“Comparative advantage is the best example of an economic principle that is undeniably true yet not obvious to intelligent people” (Samuelson 1969)
Comparative advantage, in its most basic form, is driven by country heterogeneity that results in differences in relative prices when comparing autarkic conditions with those that would prevail under free trade. This heterogeneity can be driven from a range of sources such as differences in technology, endowments, institutions, geography, market design, and the structure of demand (Ricardo 1817; Ohlin 1933; Vanek 1963;
Helpman & Krugman 1985; Davis 1995; Eaton & Kortum 2002; Costinot 2009; Morrow 2010; Chor 2010; Markusen 2013).
This chapter places its focus on the two fundamental frameworks of comparative advantage, the Ricardian and Heckscher-Ohlin models of international trade. The Ricardian model formalised the concept of comparative advantage by introducing a model in which labour is the sole factor in production and heterogeneity arose due to differences in labour productivity. Other sources of heterogeneity were subsequently explored in the Heckscher-Ohlin model in which factor endowments are the prime motivations to trade. These two fundamental models have laid a rich foundation that has shaped the way we think about both the gains from trade and the generation of overall trade patterns.
The network complexity framework of analysis has been predominantly focused on the idea of country capabilities, a construct that ultimately provides a more general level of abstraction when considering the factors that drive comparative advantage. For example, the set of capabilities could represent a discrete range of different production processes, in which some processes are more efficient then others. This can be aligned with a Ricardian view of international trade. Alternatively the set of capabilities could include different discrete factor endowments providing a natural Hecksher-Ohlin perspective.