This is a repository copy of
Constraining the Gap Size in the Disk around HD 100546 in
the Mid-infrared
.
White Rose Research Online URL for this paper:
http://eprints.whiterose.ac.uk/138693/
Version: Published Version
Article:
Jamialahmadi, N, Ratzka, T, Panic, O orcid.org/0000-0002-6648-2968 et al. (6 more
authors) (2018) Constraining the Gap Size in the Disk around HD 100546 in the
Mid-infrared. The Astrophysical Journal, 865 (2). ARTN 137. ISSN 0004-637X
https://doi.org/10.3847/1538-4357/aadae4
[email protected] https://eprints.whiterose.ac.uk/
Reuse
Items deposited in White Rose Research Online are protected by copyright, with all rights reserved unless indicated otherwise. They may be downloaded and/or printed for private study, or other acts as permitted by national copyright laws. The publisher or other rights holders may allow further reproduction and re-use of the full text version. This is indicated by the licence information on the White Rose Research Online record for the item.
Takedown
If you consider content in White Rose Research Online to be in breach of UK law, please notify us by
Constraining the Gap Size in the Disk around HD 100546 in the Mid-infrared
Narges Jamialahmadi1, Thorsten Ratzka2 , Olja Panić3,8, Hassan Fathivavsari1, Roy van Boekel4, Sebastien Flement5,
Thomas Henning4, Walter Jaffe6, and Gijs D. Mulders7,9 1
School of Astronomy, Institute for Research in Fundamental Sciences(IPM), P.O. Box 19395-5746, Tehran, Iran;[email protected],[email protected] 2
Institute for Physics/IGAM, NAWI Graz, Karl-Franzens-Universität, Universitätsplatz 5/II, A-8010 Graz, Austria
3
School of Physics and Astronomy, University of Leeds, Woodhouse Lance, Leeds LS29JT, UK
4Max Planck-Institut für Astronomie, Königstuhl 17, D-69117 Heidelberg, Germany 5
Laboratoire J.-L. Lagrange, UMR 7293, University of Nice Sophia-Antipolis, CNRS, Observatoire de la Cote DAzur, Boulevard de lObservatoire—CS 34229, F-06304 NICE Cedex 4, France
6
Sterrewacht Leiden, Niels Bohrweg 2, 2333 CA Leiden, The Netherlands
7
Lunar and Planetary Laboratory, The University of Arizona, Tucson, AZ 85721, USA
Received 2018 May 29; revised 2018 August 14; accepted 2018 August 14; published 2018 October 1
Abstract
We refine the gap size measurements of the disk surrounding the Herbig Ae star HD 100546 in the N band. Our new mid-infrared interferometric (MIDI)data have been taken with the UT baselines and span the full range of orientations. The correlated fluxes show a wavy pattern in which the minima separation links to a geometrical structure in the disk. Wefit each correlatedflux measurement with a spline function, deriving the corresponding spatial scale, while assuming that the pattern arises interferometrically due to the bright emission from the inner disk and the opposing sides of the wall of the outer disk. We thenfit an ellipse to the derived separations at their corresponding position angles, thereby using the observations to constrain the disk inclination toi=47°±1°and
the disk position angle to PA=135°. 0±2°. 5 east of north, both of which are consistent with the estimated values
in previous studies. We also derive the radius of the ellipse to 15.7±0.8 au. To confirm that the minima
separations translate to a geometrical structure in the disk, we model the disk of HD 100546 using a semianalytical approach taking into account the temperature and optical depth gradients. Using this model, we simultaneously reproduce the level and the minima of the correlated fluxes and constrain the gap size of the disk for each observation. The values obtained for the projected gap size in different orientations are consistent with the separation found by the geometrical model.
Key words:protoplanetary disks– stars: individual(HD 100546)–techniques: interferometric
1. Introduction
The protoplanetary disks surrounding young stellar objects
(YSOs) evolve by various physical mechanisms such as photoevaporation (Hollenbach et al. 1994; Alexander et al.
2006; Armitage 2011), accretion/ejection (Lynden-Bell & Pringle1974; Armitage2011; Alexander et al.2014), and dust growth and planet formation (Crida & Morbidelli 2007; Espaillat et al. 2014; Testi et al. 2014). These processes can occur at the same time with timescales of up to a few million years and can cause substantial evolution in the disks such as clearing disk cavities. In this case, the disks are named the transitional disks.
The first transitional disk was recognized as a subclass of protoplanetary disks by Strom et al.(1989)and Skrutskie et al.
(1989)from near-infrared(NIR)ground-based photometry and
IRAS (MIR) photometry. Detailed studies of these objects became feasible as progressively more sophisticated instru-ments, e.g., theSpitzer Space Telescope(Werner et al. 2004), identified a new class of disks called pretransitional disks around the stars LKCa 15 and UX Tau A(Espaillat et al.2007). The spectral energy distribution (SED) of such disks, which provides indirect evidence of gaps, lacks an MIRflux(5–20μm)
and has a significant excess at NIR (2–5 μm) and longer wavelengths compared to the full protoplanetary disks. The
specified shapes of these SEDs demonstrates that pretransitional disks comprise an inner disk and an outer disk separated by a gap. One of the proposed formation scenarios of the gapped disks is the disk–planet interaction while the geometrical structure of such gaps are still under debate.
HD 100546 (110 ± 0.6 pc from the second Gaia Data Release; Gaia Collaboration et al.2016,2018)hosts a widely studied pretransitional disk, which was first identified by Bouwman et al. (2003), modeling the spectral energy distribution (SED). They concluded that HD 100546 has a small inner disk of a few au and a more massive outer disk beyond ∼10 au. They speculated about the presence of a planetary companion in the gap. The gas- and dust-rich disk of HD 100546 is one of the best laboratories for studying forming planetary systems. Direct and indirect observations reveal that the disk hosts two embedded companion candidates (e.g., Bouwman et al. 2003; Quanz et al. 2013, 2015; Brittain et al.2014; Currie et al.2015).
The geometrical structures of the disk around HD 100546 were widely studied in multiwavelength observations. The results of the various studies are listed in Table1. Please note that in the literature the distance of 97 pc is commonly used. In this work, we use the updated distance of 110 pc, as measured byGAIA.
As a complementary study, in this paper, we present our mid-infrared interferometric data, consisting of 15 independent two-element baseline measurements obtained with the Very Large Telescope Interferometer (VLTI) and its instrument © 2018. The American Astronomical Society. All rights reserved.
8
Royal Society Dorothy Hodgkin Fellow.
9
MIDI(Leinert et al.2003). With a large span of the projected position angles, these data provide unique measurements of the gap geometry in the mid-infrared in unprecedented detail. It is unique since we have multi-epoch N-band data, which has not been done before. These data give us more information about the geometry of the disk than previous N-band observations on HD 100546. Constraining the precise size of the gap of HD 100546 at various wavelengths is important for learning about the processes at work that form this gap. Moreover, HD 100546 exhibits multiple signposts of planets and will be a prime target for all future instruments.
2. Observations and Data Reduction
HD 100546 was interferometrically observed in the N band
(8–13μm)in 2012 and 2013 using the MIDI/VLTI(ESO GTO program 090.C-0931(A)–(E), PI: O. Panić). In this paper, we
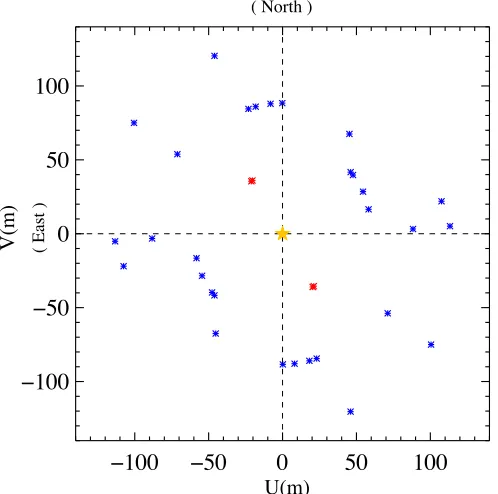
focus on our observations carried out with the 8 m unit telescopes. We performed the observations with the prism as a dispersive element(R∼30)and in the HIGH-SENS mode, i.e., the total fluxes and the correlated fluxes were measured consecutively. Table 2 gives the log of observations, and Figure 1 presents the corresponding uv-coverage. For the calibration of the correlatedfluxes and the determination of the transfer function, calibrator stars were observed within about half an hour before or after the target in the same region of the sky. We used the calibrator stars before and after the target and then averaged the results. In the cases for which the transfer function of one of the calibrators was peculiar, we used only one calibrator(Table3).
To reduce the data, we used v2.0 of MIA+EWS.10
For weak correlated fluxes the EWS branch with its shift-and-add algorithm in the complex plane is more accurate. In this paper, MIA with its power spectrum analysis was only used to check the EWS results.
[image:3.612.45.570.75.223.2]We present some of the calibrated correlated fluxes (black lines) with better quality in Figure 2 and the remaining measurements in Figure4.
Table 1
A Comparison between the Geometrical Parameters of the Disk of HD 100546 from Various Studies
Reference Instrument Wavelength Range i(°) PA(°)
Physical Cavity Size(au)
Corresponding Cavity Size at 110 pc(au)
Quanz et al.(2011) VLT/NACO H and K band 47.0±2.7 138.0±3.9 ∼15.0 ∼16.9
Avenhaus et al.(2014) VLT/NACO L band L 138±3 14.0±2.0 15.8±2.3
Garufiet al.(2016) VLT/SPHERE Visible L L 11.0±1.0 12.4±1.1
Brittain et al.(2014) VLT/CRIRES NIR spectroscopy 42 L 12.9-+1.31.5 14.6-+1.51.7
Mulders et al.(2013) VLTI/MIDI MIR 53 145 ~10.0 to 25.0 ∼11.3 to 28.2
Panićet al.(2014) VLTI/MIDI MIR 53±8 145±5 11.0±1.0 12.4±1.2
Menu et al.(2015) VLTI/MIDI MIR L L 18.8±1.2 21.2±1.4
Pineda et al.(2014) ALMA 870μm 41.94±0.03 145.14±0.04 L L
Wright et al.(2015) ATCA 7 mm 40±5 140±5 25.0 28.2
Follette et al.(2017) MagAO and GPI optical and NIR 42 145 15.0 15.0
Our work VLTI/MIDI MIR 47±1 135±2.5 15.7±0.8 15.7±0.8
[image:3.612.316.569.342.690.2]Note.Listed are the inclination,i, the position angle, PA, and the cavity size of the disk. The absolute sizes of the cavity have been derived for a common distance of 110 pc(for further details see the text).
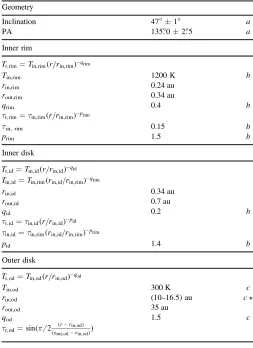
Table 2
The Best Parameters Obtained for an Inner Disk and Outer Disk Separated by a Gap
Geometry
Inclination 47°±1° a
PA 135°. 0±2°. 5 a
Inner rim
= ( )
-T T r r q
r,rim in,rim in,rim rim
Tin,rim 1200 K b
rin,rim 0.24 au
rout,rim 0.34 au
qrim 0.4 b
t =t (r r )-p r,rim in,rim in,rim rim
τin, rim 0.15 b
prim 1.5 b
Inner disk
= ( )
-T T r r q
r,id in,id in,id id
= ( )
-T T r r q
in,id in,rim in,id in,rim rim
rin,id 0.34 au
rout,id 0.7 au
qid 0.2 b
t =t (r r )-p r,id in,id in,id id
t =t (r r )-p
in,id in,rim in,id in,rim rim
pid 1.4 b
Outer disk
= ( )
-T T r r q
r,od in,od in,od od
Tin,od 300 K c
rin,od (10–16.5)au cå
rout,od 35 au
qod 1.5 c
t = (p (-- ) )
( )
sin 2 r r
r r
r,od in,od
out,od in,od
Note.The parameters marked witha,b, andcare the ones constrained by the geometrical model, the one-component disk model, and the two-component disk model, respectively. The parameter marked withcåis constrained for each individual observation by our two-component-disk model with all other parametersfixed.
10
http://www.strw.leidenuniv.nl/~nevec/MIDI/
3. Results
3.1. Geometrical Model
The observed correlated fluxes show a wavy pattern with clear minima, which vary with baseline length and orientation. In interferometric observations, a sinusoidal signal in the correlatedflux is a sign of binary-like structure in the sky(see Chesneau et al.2006; Ratzka et al.2009). Therefore, the most elementary interpretation of the minima in our data is two separated point sources in the sky, i.e., a binary or a structure similar to a binary that causes the minima. If the wavelength dependence of the separation is weak, the separation can be directly accessed. The only parameter influencing the location of the minima is the angular separation. Here, the inner disk and the opposite sides of the disk wall can mimic a binary when observed with an interferometer.
For each observation, we constrain the position of two consecutive minima and derive the angular gap size along the baseline direction. Afterward, we fit an ellipse to all of the separations with the aim of deriving the position angle, the inclination, and the size of the gap. For the given distance, the angular separation can be converted to au.
The identification of the minimum locations requires some effort since the sampling of the MIDI data is quite low and the minima are not always symmetric. Therefore, we try to fit a spline function to the correlated fluxes in each data set before identifying its corresponding minima. The spline function also enables us to predict the correlatedflux in wavelength ranges affected by noise. We found that by the different selection points used in our splinefit around each minimum, the minima positions change slightly. We repeat this process 100 times and each time record the minima from the fit. The mean of these 100 minima is taken as the best minimum, their standard deviation provides the uncertainty of this minimum. The minima of the spline fit are then taken as the minima of the corresponding correlatedflux. The spatial frequencies at which
two consecutive minima occur are then subtracted and converted to au for the given distance.
An example of a splinefit on a correlatedflux is shown as the green curve in panel(a)of Figure2.
We present in Figure 3 the separations and their corresp-onding error bars as blue points. The ellipse fit to the data points gives i=47°±1° and PA=135°±2°. 5. Note that the uncertainties are only the formal ones in the framework of the specific model. We derive a radius of the ellipse of 15.7±0.8 au. These results are roughly consistent with the
values found in previous studies listed in Table1. Please note that the PA and the cavity size we derive are not consistent with the value derived in the MIR study by Panićet al.(2014). The
actual difference of the cavity size along PA of 30°is 1.5 au,
i.e., the separations found for the old data are not consistent with the new data(Figure3). The reason for this may be the variability of the source in the seven-year period(Section3.2). The determination of the minima locations with the spline method, however, does not take into account another restriction of the binary model. The periodicity of the binary signal has to be consistent with a maximum at spatial frequency of 0. To justify and confirm the minimum determination of the correlated fluxes, we use a simplistic binary model of two point sources with equal brightness. In this model, the correlated flux only depends on the angular separation along the baseline direction. The data points and the ellipsefitted to the derived separations are shown in red in Figure3. Wefind
i=46°±0°. 5 and PA=134°±1° as well as a semimajor
axis of 15.3±0.7 au. This confirms that the previous results
are robust and shows that the two approaches are consistent with each other. Please note that the two older measurements
(2004, 2005)represented by the red points in Figure1 are not included in our geometrical model described above.
3.2. Two-component Disk Model
For a more detailed interpretation of our data, we use a semianalytical model (Jamialahmadi et al. 2015b,2018). This model of protoplantary disks around YSOs Jamialahmadi et al.
(2015a) takes the temperature and surface density power law
into account. Pretransitional disks can be modeled with two components separated by a gap.
In afirst step, we start, however, with constructing an one-component disk model, which only comprises an inner rim and an inner disk at less than 1 au both with a temperature and optical depth power law (Table 2). The outer disk is added later. The inclinationiand the position angle PA of the disk are fixed to the values constrained by our ellipse fitting (on data points fitted by the spline function; see Section 3.1). The temperature at the inner radius of the rim (Tin,rim) in the rim temperature power law is a free parameter, ranging from 600 K
(Panićet al.2014)to 1750 K(Tatulli et al.2011). The exponent
qrim varies between 0.1 to 1.5.
The temperature of the inner radius of the inner disk(Tin,id) is equal to the temperature of the inner rim at the inner radius of the inner disk(rin,id). The exponentqidvaries again between 0.1 to 1.5.
As shown in Table2, wefix the rim location to the value of
rin,rim=0.24 constrained by Benisty et al.(2010)and Tatulli
et al. (2011). We also set the inner radius of the inner disk,
[image:4.612.46.295.53.300.2]rin,id, which is equal to the outer radius of the inner rim as well as the outer radius of the inner disk to the values measured by Panićet al.(2014), i.e., 0.34 au and 0.7 au, respectively.
In our disk model, the observer receives the following flux for each disk elementary surface areaA, i.e., the area defined by our pixel size in the simulated brightness maps of our model:
t
= -
-l l ⎜ ⎟
⎡
⎣
⎢ ⎛
⎝
⎜ ⎞
⎠ ⎟⎤
⎦ ⎥⎛
⎝ ⎞ ⎠
( ) [ ]
( ) ( )
dF i B T
i A D 1 exp
cos , 1
r r 2
where Bl is the Planck function, which depends on the
temperature of the disk at each radius; the quantity A/D2
represents the solid angle of each elementary surface area as seen at the distance D; iis the disk inclination; and τris the optical depth as a function of radius.
Wefirst used an optically thick rim and an inner disk where τrim=τid=1. Since using this definition we could not
reproduce the slope of our correlated fluxes, so we then assumed a power law for the optical depth,t =t (r r )-p
r in in ,
[image:5.612.44.570.77.617.2]for which the value decreases with increasing distance from the
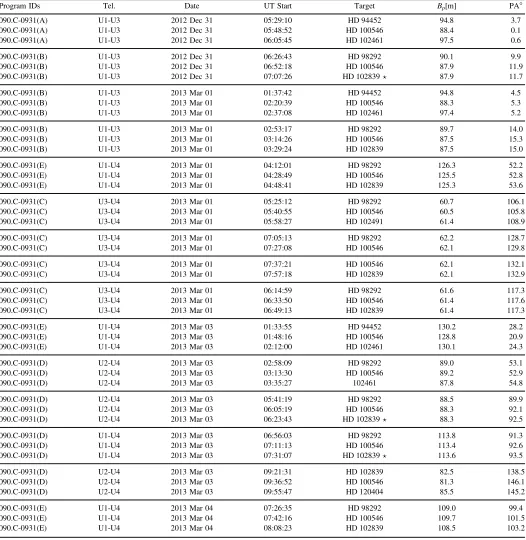
Table 3 Log of Observations
Program IDs Tel. Date UT Start Target Bp[m] PA°
090.C-0931(A) U1-U3 2012 Dec 31 05:29:10 HD 94452 94.8 3.7
090.C-0931(A) U1-U3 2012 Dec 31 05:48:52 HD 100546 88.4 0.1
090.C-0931(A) U1-U3 2012 Dec 31 06:05:45 HD 102461 97.5 0.6
090.C-0931(B) U1-U3 2012 Dec 31 06:26:43 HD 98292 90.1 9.9
090.C-0931(B) U1-U3 2012 Dec 31 06:52:18 HD 100546 87.9 11.9
090.C-0931(B) U1-U3 2012 Dec 31 07:07:26 HD 102839å 87.9 11.7
090.C-0931(B) U1-U3 2013 Mar 01 01:37:42 HD 94452 94.8 4.5
090.C-0931(B) U1-U3 2013 Mar 01 02:20:39 HD 100546 88.3 5.3
090.C-0931(B) U1-U3 2013 Mar 01 02:37:08 HD 102461 97.4 5.2
090.C-0931(B) U1-U3 2013 Mar 01 02:53:17 HD 98292 89.7 14.0
090.C-0931(B) U1-U3 2013 Mar 01 03:14:26 HD 100546 87.5 15.3
090.C-0931(B) U1-U3 2013 Mar 01 03:29:24 HD 102839 87.5 15.0
090.C-0931(E) U1-U4 2013 Mar 01 04:12:01 HD 98292 126.3 52.2
090.C-0931(E) U1-U4 2013 Mar 01 04:28:49 HD 100546 125.5 52.8
090.C-0931(E) U1-U4 2013 Mar 01 04:48:41 HD 102839 125.3 53.6
090.C-0931(C) U3-U4 2013 Mar 01 05:25:12 HD 98292 60.7 106.1
090.C-0931(C) U3-U4 2013 Mar 01 05:40:55 HD 100546 60.5 105.8
090.C-0931(C) U3-U4 2013 Mar 01 05:58:27 HD 102491 61.4 108.9
090.C-0931(C) U3-U4 2013 Mar 01 07:05:13 HD 98292 62.2 128.7
090.C-0931(C) U3-U4 2013 Mar 01 07:27:08 HD 100546 62.1 129.8
090.C-0931(C) U3-U4 2013 Mar 01 07:37:21 HD 100546 62.1 132.1
090.C-0931(C) U3-U4 2013 Mar 01 07:57:18 HD 102839 62.1 132.9
090.C-0931(C) U3-U4 2013 Mar 01 06:14:59 HD 98292 61.6 117.3
090.C-0931(C) U3-U4 2013 Mar 01 06:33:50 HD 100546 61.4 117.6
090.C-0931(C) U3-U4 2013 Mar 01 06:49:13 HD 102839 61.4 117.3
090.C-0931(E) U1-U4 2013 Mar 03 01:33:55 HD 94452 130.2 28.2
090.C-0931(E) U1-U4 2013 Mar 03 01:48:16 HD 100546 128.8 20.9
090.C-0931(E) U1-U4 2013 Mar 03 02:12:00 HD 102461 130.1 24.3
090.C-0931(D) U2-U4 2013 Mar 03 02:58:09 HD 98292 89.0 53.1
090.C-0931(D) U2-U4 2013 Mar 03 03:13:30 HD 100546 89.2 52.9
090.C-0931(D) U2-U4 2013 Mar 03 03:35:27 102461 87.8 54.8
090.C-0931(D) U2-U4 2013 Mar 03 05:41:19 HD 98292 88.5 89.9
090.C-0931(D) U2-U4 2013 Mar 03 06:05:19 HD 100546 88.3 92.1
090.C-0931(D) U2-U4 2013 Mar 03 06:23:43 HD 102839å 88.3 92.5
090.C-0931(D) U1-U4 2013 Mar 03 06:56:03 HD 98292 113.8 91.3
090.C-0931(D) U1-U4 2013 Mar 03 07:11:13 HD 100546 113.4 92.6
090.C-0931(D) U1-U4 2013 Mar 03 07:31:07 HD 102839å 113.6 93.5
090.C-0931(D) U2-U4 2013 Mar 03 09:21:31 HD 102839 82.5 138.5
090.C-0931(D) U2-U4 2013 Mar 03 09:36:52 HD 100546 81.3 146.1
090.C-0931(D) U2-U4 2013 Mar 03 09:55:47 HD 120404 85.5 145.2
090.C-0931(E) U1-U4 2013 Mar 04 07:26:35 HD 98292 109.0 99.4
090.C-0931(E) U1-U4 2013 Mar 04 07:42:16 HD 100546 109.7 101.5
090.C-0931(E) U1-U4 2013 Mar 04 08:08:23 HD 102839 108.5 103.2
Note.The excluded calibrator stars are indicated with an asterisk.
central star. For the inner rim, τin is assumed to be τin,rimat
rin,rim. For the inner disk, τin is calculated from the optical depth of the inner rim atrin,id. The slope of the correlatedfluxes are very sensitive to the value ofτin. We vary this parameter in a range between 0 to 1 to obtain the best slope. The exponent of
pin the optical depth power law is defined asprimfor the inner
rim and pid for the inner disk. We vary these parameters between 0.1 to 1.5.
After creating the image of the disk(including the star)for each wavelength, we calculate the correlated flux. The correlated flux is the modulus of the Fourier transform for the observed spatial frequency. The inner disk in our model only creates a slope with which we can reproduce the slope of our data. To do so, wefirst define the slope of each correlated flux using the lower and the upper wavelengths and their corresponding correlated flux value as shown in Figures 2
and 4 by the solid magenta lines. Exploring the range of free parameters in our model, we could reproduce the slope of the correlatedfluxes assuming an inner disk smaller than 1 au. The reducedc2of our best model, which is the difference between the model and the data weighted by the number of elements of the data is 1.4. We summarize the parameters constrained in our best model marked withbin Table2. We present the best model by dashed magenta lines in Figures2and 4.
In a next step, we use a two-component disk model adding an outer disk to the inner one, separated by a gap. The temperature of the inner radius of the outer disk(Tin,od)in the outer disk temperature power law is a free parameter and varies in a physical consistent temperature range 200–300 K as used for an illuminated wall by Mulders et al.(2011). The exponent
qodin the power law varies between 0.1 to 1.5. We set the outer radius of the outer disk(rout,od)to a high enough value of 35 au to provide a gradual decrease in the radial brightness, as doing otherwise may introduce a spurious interferometric signal. For the optical depth we use the expression introduced by Panić
[image:6.612.47.569.54.329.2]et al.(2014). Since the contrast between the wall of the outer disk and the gap causes a high contrast in the flux, they
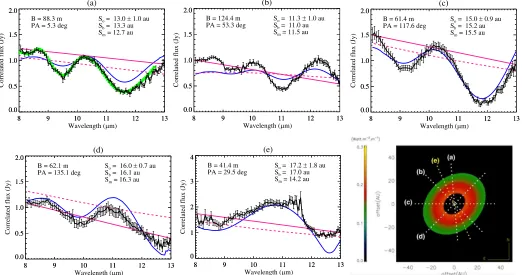
Figure 2.Bottom right plot is the synthetic image of HD 100546 atλ=10μm, using our best model. With the projected baselines indicated we derive the correlated
fluxes shown in panels(a)–(e). Overplotted on the measured correlatedfluxes(black)is the slope of the correlatedfluxes(solid magenta)and the best model of the slope of the correlatedfluxes(dashed magenta), including the inner disk and its inner rim. The blue lines represent the best model including the inner and the outer disk. The green curve in panel(a)is the spline functionfitted to this measurement. We list the separations derived from splinefitting(So), full binary model(Sb), and
from our two-component disk model(Sm≡rin,od), respectively. Panel(e)corresponds to the observation in 2005(Panićet al.2014).
Figure 3.Separations derived from splinefitting(blue), full binary model(red), and our two-component disk model(green), respectively. The corresponding ellipsefits on these data points are also overplotted with the same color codes. The result quoted is that of the spline fitting. The two measurements that deviate from the other points have been obtained in 2004/2005 (Panić
[image:6.612.46.295.406.589.2]introduced a sine function (see Table 2) to gradually smooth the peak of theflux behindrin,od. With respect to the inner disk we kept the best parameters obtained for the one-component disk model reproducing the slope of our correlatedfluxes(see Table2).
The temperature of the outer disk and the exponentq affect the level of the correlated fluxes, and the inner radius of the outer diskrin,odaffects the location of their minima. Therefore, we first adjust the level of the correlated fluxes for all observations exploring the range of the temperature andqfor a givenrin,od. Then, we varyrin,odfor each observation between 7 to 17 au assuming that the other parameters presented in Table 2 are fixed. The results vary between 10 and 16.5 au.
[image:7.612.52.563.54.555.2]This step is done manually. The correlatedfluxes are presented in Figure 2 for five different baseline configurations. The remaining plots are presented in Figure 4. Adding the outer disk to the one-component disk model causes the wavy pattern of our correlatedfluxes. Using our best model, we successfully reproduce the minima separations and roughly the level of each correlated flux for the specific value of rin,od for the given distance. The data points and the corresponding fitted ellipse are represented in Figure 3. The underpredicted flux in our model compared to some of the observed data in Figure2and Figure4 could be due to an asymmetry at the corresponding orientations, which has not been included in our symmetrical model.
Figure 4.Results for all measured correlatedfluxes not shown in Figure2. In the bottom right, we use the UT data from 2004 published by Panićet al.(2014). For further details see Figure2.
We see also a pronounced signal in the differential phases, which is produced by an asymmetry in the outer edge of the gap as detected by Panićet al.(2014). This asymmetry may be
caused by a bright wall of the outer disk, which is tilted away from the observer. Wefind aflux ratio of less than 0.25 in the observed differential phases. We will discuss this issue in a forthcoming paper in detail.
Indeed, the separations as derived from our data are representative of the geometrical structure of the disk and allow a unique estimation of the gap size. As demonstrated in Figures 2and4we can reproduce the minima locations of the correlated fluxes for the older measurements. However, the corresponding separations deviate from the ones found from our new data. This implies that the deviation of the separation measurements shown in Figure2between the old data and new data could be due to the difference in the geometry of the disk, i.e., the projected gap size in that direction. We note that Panić
et al.(2014)already witnessed variability even between the two older data points, which had roughly the same baseline length and orientation and were taken with only about a one-year time difference. They suggested that this time variability is because of the different spatial distribution of the brightness on au scales. We expected to observe the variability due to the seven-year time difference between thefirst two epochs and our new data, which was confirmed by our new cavity size. The exact reason for this variability, however, requires further invest-igation and might be a combination of temperature and structural effects.
4. Summary and Conclusion
We have presented multi-epoch interferometric N-band data with a good uv-coverage obtained with VLTI/MIDI. The measured correlatedfluxes are characterized by a wavy pattern, which varies with baseline length and orientation. However, some minima are less significant than others, which may or may not be related to the silicate feature that is present in the total N-bandfluxes(van Boekel et al.2005). Our multi-epoch data allow us to estimate the gap size of the disk of HD 100546 in the N band. We show that the separation obtained by direct measurement of the separation of the minima of our new data in 2012 and 2013 are satisfactorily fitted by an ellipse. We derive an inclination of 47°±1° and a PA of 135°±2°. 54,
which are consistent with the values estimated by previous studies. We also constrain gap size to 15.7±0.8 au. We show
by our model that the inner radius of the outer disk estimated for each observation is consistent with the separation obtained from the geometrical model. Please note that our projected gap size estimation takes into account the updated distance of HD 100546 measured byGAIA,∼13% larger than the distance of 97 pc that is commonly used in literature. Taking into account this fact, our projected gap size estimation bears striking similarity to the multiwavelengths values found by the previous studies listed in Table 1. However, one has to be careful in comparing the sizes since the different wavelength regimes and observing methods trace potential different structures.
Reconstructing images of the disk of HD 100546 at the L and N band with the upcoming second-generation VLTI instrument, the Multi AperTure mid-Infrared SpectroScopic Experiment (MATISSE; Lopez et al. 2006), will constitute a
unique perspective to further assess the nature of the geometrical structure of HD 100546 and will be a natural continuation for our study. MATISSE will recombine up to four telescopes. More detailed models including also our data obtained with the auxiliary telescopes will be presented in a forthcoming paper.
The research leading to these results has received funding from the European Union’s Horizon 2020 research and innovation programme under Grant Agreement 730890
(OPTICON). O.P. is funded by the Royal Society Dorothy Hodgkin Fellowship. Based on observations collected at the European Organization for Astronomical Research in the Southern Hemisphere.
ORCID iDs
Thorsten Ratzka https://orcid.org/0000-0001-9557-8232
Gijs D. Mulders https://orcid.org/0000-0002-1078-9493
References
Alexander, R., Pascucci, I., Andrews, S., Armitage, P., & Cieza, L. 2014, in Protostars and Planets VI, ed. H. Beuther et al.(Tucson, AZ: Univ. Arizona Press),475
Alexander, R. D., Clarke, C. J., & Pringle, J. E. 2006,MNRAS,369, 229
Armitage, P. J. 2011,ARA&A,49, 195
Avenhaus, H., Quanz, S. P., Meyer, M. R., et al. 2014,ApJ,790, 56
Benisty, M., Tatulli, E., Ménard, F., & Swain, M. R. 2010,A&A,511, A75
Bouwman, J., de Koter, A., Dominik, C., & Waters, L. B. F. M. 2003,A&A,
401, 577
Brittain, S. D., Carr, J. S., Najita, J. R., Quanz, S. P., & Meyer, M. R. 2014,
ApJ,791, 136
Chesneau, O., Collioud, A., De Marco, O., et al. 2006,A&A,455, 1009
Crida, A., & Morbidelli, A. 2007,MNRAS,377, 1324
Currie, T., Cloutier, R., Brittain, S., et al. 2015,ApJL,814, L27
Espaillat, C., Calvet, N., D’Alessio, P., et al. 2007,ApJL,670, L135
Espaillat, C., Muzerolle, J., Najita, J., et al. 2014, in Protostars and Planets VI, ed. H. Beuther et al.(Tucson, AZ: Univ. Arizona Press),497
Follette, K. B., Rameau, J., Dong, R., et al. 2017,AJ,153, 264
Gaia Collaboration, Brown, A. G. A., Vallenari, A., et al. 2018,A&A,616, A1
Gaia Collaboration, Prusti, T., de Bruijne, J. H. J., et al. 2016,A&A,595, A1
Garufi, A., Quanz, S. P., Schmid, H. M., et al. 2016,A&A,588, 8
Hollenbach, D., Johnstone, D., Lizano, S., & Shu, F. 1994,ApJ,428, 654
Jamialahmadi, N., Berio, P., Meilland, A., et al. 2015a,A&A,579, A81
Jamialahmadi, N., Lopez, B., Berio, P., et al. 2018,MNRAS,473, 3147
Jamialahmadi, N., Lopez, B., Berio, P., Flament, S., & Spang, A. 2015b,
Ap&SS,355, 105
Leinert, C., Graser, U., Richichi, A., et al. 2003, Msngr,112, 13
Lopez, B., Wolf, S., Lagarde, S., et al. 2006,Proc. SPIE,6268, 62680Z
Lynden-Bell, D., & Pringle, J. E. 1974,MNRAS,168, 603
Menu, J., van Boekel, R., Henning, Th., et al. 2015,A&A,581, 107
Mulders, G. D., Paardekooper, S.-J., Panić, O., et al. 2013,A&A,557, 68
Mulders, G. D., Waters, L. B. F. M., Dominik, C., et al. 2011,A&A,531, A93
Panić, O., Ratzka, T., Mulders, G. D., et al. 2014,A&A,562, A101
Pineda, J. E., Quanz, S. P., Meru, F., et al. 2014,ApJL,788, L34
Quanz, S. P., Amara, A., Meyer, M. R., et al. 2013,ApJL,766, L1
Quanz, S. P., Amara, A., Meyer, M. R., et al. 2015,ApJ,807, 64
Quanz, S. P., Schmid, H. M., Geissler, K., et al. 2011,ApJ,738, 23
Ratzka, T., Schegerer, A. A., Leinert, C., et al. 2009,A&A,502, 623
Skrutskie, M. F., Forrest, W. J., & Shure, M. 1989,AJ,98, 1409
Strom, K. M., Strom, S. E., Edwards, S., Cabrit, S., & Skrutskie, M. F. 1989,
AJ,97, 1451
Tatulli, E., Benisty, M., Ménard, F., et al. 2011,A&A,531, A1
Testi, L., Birnstiel, T., Ricci, L., et al. 2014, in Protostars and Planets VI, ed. H. Beuther et al.(Tucson, AZ: Univ. Arizona Press),339
van Boekel, R., Min, M., Waters, L. B. F. M., et al. 2005,A&A,437, 189
Werner, M. W., Roellig, T. L., Low, F. J., et al. 2004,ApJS,154, 1