This is a repository copy of Ligand-based virtual screening using a genetic algorithm with
data fusion.
White Rose Research Online URL for this paper:
http://eprints.whiterose.ac.uk/116212/
Version: Published Version
Article:
Holliday, J., Sani, N. and Willett, P. orcid.org/0000-0003-4591-7173 (2018) Ligand-based
virtual screening using a genetic algorithm with data fusion. Match: Communications in
Mathematical and in Computer Chemistry, 80 (3). ISSN 0340-6253
[email protected]
https://eprints.whiterose.ac.uk/
Reuse
This article is distributed under the terms of the Creative Commons Attribution (CC BY) licence. This licence
allows you to distribute, remix, tweak, and build upon the work, even commercially, as long as you credit the
authors for the original work. More information and the full terms of the licence here:
https://creativecommons.org/licenses/
Takedown
If you consider content in White Rose Research Online to be in breach of UK law, please notify us by
This work is licensed under a Creative Commons Attribution 4.0 International License.
Ligand–Based Virtual Screening Using a
Genetic Algorithm with Data Fusion
John D. Holliday
1, Nor Sani
1, 2, Peter Willett
1 1Information School, University of Sheffield, 211 Portobello,Sheffield S1 4DP, United Kingdom
2Faculty of Information Science and Technology, National University of Malaysia,
43600 UKM Bangi, Malaysia
(Received November 22, 2016)
Abstract
Substructural analysis provides a simple and effective way of ranking the 2D fingerprints representing the molecules in a database upon the basis of weights that denote a substructural fragment’s contribution to the overall activity or inactivity of a molecule. A substructural analysis method has been described recently that is based on the use of a genetic algorithm (GA), with the resulting sets of weights proving to be more effective for ligand-based virtual screening than existing approaches. However, the inherently non-deterministic nature of a GA means that different runs are likely to result in different sets of weights and hence in variations in the effectiveness of screening. This paper describes the use of data fusion to combine the rankings generated in multiple GA runs, and demonstrates that the resulting fused rankings are markedly superior to GA runs on average, and in some cases can even exceed the performance of the very best individual GA run.
Introduction
Virtual screening methods play an important role in the discovery of novel bioactive molecules,
such as pharmaceuticals or agrochemicals, and involve the use of computational techniques to
score the molecules in a database in descending order of probability of exhibiting the desired
activity. High-ranked molecules can then undergo high-throughput or in vitro biological testing
to ascertain whether they are, in fact, active. Here, we consider ligand-based virtual screening
(LBVS) methods, where the only information available for the discovery process are sets of Communications in Mathematical
and in Computer Chemistry
molecules that have been tested previously and that are hence known to be either active or
inactive. Specifically, we focus on substructural analysis, which was pioneered by Cramer et
al. in the early 1970s [1, 2] and subsequently developed by Hodes et al. [3, 4]: it was probably the first LBVS method to be used on a large scale, forming an important component of a
National Institutes of Health programme to develop novel anticancer agents [5, 6].
A molecule in a chemical database is often described by a fingerprint, a bit-string in
which bits are set to on (or off) depending upon whether a substructural feature is present (or
absent) in that molecule. In substructural analysis, a weight is associated with each bit that is
computed on the basis of how frequently the corresponding substructural feature occurs, or
does not occur, in sets of molecules that have been tested previously for activity. The weight
hence describes the probability that a molecule with that feature will prove to be active, and a
score is computed for a molecule by combining the weights for all of its constituent features.
The resulting scores are used to rank a database in descending order, with those at the top of
the ranking then being considered for biological screening since they are assumed to have the
greatest a priori probabilities of activity. Substructural analysis hence embodies the
assu-mption that a given substructure can influence the activity of a molecule, regardless of the
environment in which the feature occurs: this is clearly an extremely crude assumption but the
approach has been found to be of value for screening in drug-discovery programmes [7, 8].
A variety of weighting schemes have been described for use in substructural analysis,
as reviewed by Ormerod et al. [9]. In their comparison, the most generally useful was found
to be one that was originally developed by Robertson and Spark Jones [10] for use in text
searching (where the aim is to rank a database of documents in order of decreasing probability
of relevance to a query, as against decreasing probability of activity in a biological screen in
the present context) and that is analogous to LBVS systems based on naïve Bayesian classifier
weights such as that used in the Pipeline Pilot software [11-13]. Rather than the detailed
probabilistic models that underlie these approaches to substructural analysis, Holliday et al.
have recently described an approach to weighting that is based on the use of a genetic algorithm
(or GA) [14]. The approach proved to be highly effective in operation but it was noted that the
inherently non-deterministic nature of GAs meant that different runs could result in different
database rankings. This brief communication seeks to address this limitation of the previous
work. The GA is described in the next section, together with the use of data fusion (vide infra)
to combine multiple runs of the algorithm. We then report detailed experiments using three
-624-large datasets for which bioactivity data are available; and compare the effectiveness of the
basic GA with the results obtained using a range of different data fusion rules.
Combining GA runs using data fusion
A GA provides a non-deterministic way of tackling computational problems characterised by
solution spaces that are too large for exploration using conventional, deterministic algorithms.
The approach has been very extensively employed, not least in applications in
chemoinformatics and drug discovery [15]. In the present context, the space is that of all the
possible weights that could be assigned to each of the bits comprising the 2D fingerprint used
to describe each of the molecules in a database. The chromosome in the GA is a vector in
which the i-th element contains the weight associated with the substructural feature denoted by
the i-th bit in the fingerprint. In the experiments reported here, the fingerprint encoded the 166
MDL structural key definitions in the widely used Pipeline Pilot software, so that the
chromosome contained 166 real values, each corresponding to one of the bits in the fingerprint.
The score for a particular molecule was then the sum of the weights for those features that it
contained (as denoted by the bits that were set to on), and a database was ranked in order of
decreasing sums of scores to identify those molecules with the greatest probability of activity.
A training-set that contains molecules of known activity and inactivity is used to derive the
final sets of weights, with the fitness of an individual chromosome, c, being assessed by
identifying the number of active molecules at the top of the ranked training-set when it is ranked
using the set of weights encoded in c. Specifically, the fitness function was the enrichment
factor based on the top-1% of the ranked training-set (vide infra): by using conventional
crossover and mutation operators, the fitness function hence evolves chromosomes (i.e., sets
of weights) that are able to maximise the enrichment factor, and thus the effectiveness of LBVS
when those weights are subsequently applied to test-set molecules for which activity data are
unavailable.
The design and implementation of the GA are described in detail by Holliday et al.,
who found that it provided consistently better enrichments in simulated LBVS experiments
than did the Robertson-Spark Jones and Pipeline Pilot weights mentioned previously [14]. That
said, the non-deterministic nature of the GA means that different runs may converge on
different solutions: this can be problematic if these solutions are markedly different in character
since there will be little or no basis for deciding which of the available solutions should be
different runs will result in different sets of weights and, accordingly, different rankings and
different levels of enrichment when these weights are applied to test-set molecules. Holliday
et al. noted that this was an inherent limitation of the GA approach and reported experiments demonstrating that such variations did indeed occur in practice. For example, in one series of
ten runs using the cyclooxygenase inhibitors in the MDDR database, the mean correlation
coefficient between the sets of weights, when averaged over all 45 distinct pairs of runs, was
only 0.79 [14]. That said, it is important to note that the principal output from a substructural
analysis is not the set of weights themselves (although these could provide valuable information
for, e.g., suggesting a possible topological pharmacophore); instead, it is the top-ranked
test-set molecules that are identified using the weights, since it is these compounds that are being
highlighted for further investigation.
In the absence of any obvious means of identifying the best from among a set of
rankings, an alternative is to consider ways of combining them and we here draw upon the
concept of data fusion, which is a method for combining the information gained from different
sensors to achieve an effective or improved decision when compared to that achievable when
only a single sensor is available [16]. Data fusion has been used in many different problem
domains [17], including chemoinformatics, where it has been shown to enhance the
effectiveness of similarity searching [18] and used to combine multiple runs of ligand-protein
docking programs and multiple clusterings of a given dataset [19, 20]. When data fusion is
used for similarity searching, the sensors that are combined are the rankings of the molecules
in a database that result when different similarity measures are used to conduct a similarity
search, e.g., a search might be conducted using different fingerprints or different similarity
coefficients. The individual rankings are then combined using a fusion rule (vide infra) to
obtain a single, combined ranking of the molecules in the database that represents the final
output of the search. The obvious advantage of data fusion is that there is no need to choose
from amongst different rankings of the same set of compounds; but there are two further
advantages that have become apparent as the approach has become widely adopted for
similarity searching [18]. First, use of fusion offers a much more consistent level of
performance (as evaluated using a measure such as the enrichment factor) than when individual
rankings are used; second, the fused level of performance is normally superior to the average
individual similarity search, and may occasionally be superior to even the best individual
search. This is because, as noted by Sheridan and Kearsley, there is no single similarity
measure that can be expected to give the best possible results in all possible circumstances [21].
-626-Similarity searching generates a ranking of the molecules in a database that is entirely
comparable to that resulting from a substructural analysis study, and it is hence possible to
consider applying the fusion rules used in similarity searching to the rankings resulting from
multiple runs of the GA described above. Hence, rather than generating, e.g., ten different sets
of GA-based weights and the ten consequent rankings of the molecules comprising a test-set,
and then having to choose one of these as a basis for deciding which molecules should go
forward for biological screening, the ten rankings are here fused to give just a single ranking
to provide the input to the screening process. Our implementation of this combined GA/fusion
procedure is described in the next section.
Experimental details and results
Our approach has been evaluated in simulated LBVS experiments using three common
databases that contain both structural and bioactivity information: the MDL Drug Data Report
database (MDDR); the World Of Molecular Bioactivity database (WOMBAT); and the
European Bioinformatics Institute’s ChEMBL database. The MDDR and WOMBAT datasets
used here are described in detail by Gardiner et al. [22]: the MDDR dataset contains eleven
activity classes and 102,514 molecules, and the WOMBAT dataset contains 14 activity classes
and 138,127 molecules. A total of 15 activity classes were obtained from the much larger
ChEMBL database by choosing activities that matched one of the classes in the MDDR and
WOMBAT datasets; and then each of the 1,352,681 molecules in version 18 of the database
was recorded as being active in a specific class if there was a measured pIC50 for that activity
of ≥ 5.0 and if there was an associated confidence score of 9; all other molecules were then
assumed to be inactive for that class. The molecules in the three datasets were characterised
using MDL fingerprints, which encode 166 important substructural fragments and which were
generated using Pipeline Pilot software. The training-set for a particular activity class was
generated by randomly selecting 10% of the actives and 10% of the inactives, with the
remaining 90% of the database providing the test-set for which virtual screening was carried
out. The GA was run on the training-set, weights determined for each of the 166 fragments
comprising a fingerprint, and then these weights used to rank the molecules in the test-set. For
example, there are 982 molecules noted as being renin inhibitors in the ChEMBL dataset, so
the training-set contained 98 of these active molecules and 135,170 other, inactive molecules,
In their original paper, Holliday et al. reported parameterization experiments that were
undertaken to optimize the effectiveness of the GA, and suggested the following settings:
roulette-wheel selection; one-point crossover with a crossover rate pf 0.95; real-value mutation
with a mutation rate of 0.01; a population of 200 chromosomes; and 500 iterations of the GA
[14]. These parameters were used to obtain all of the rankings discussed here, with the
effectiveness of a ranking of the test-set molecules being measured using the enrichment factor
as follows. Assume that a database contains A active molecules, so that selecting 1% of the
molecules at random would yield 0.01A actives, and that the top-1% of the ranking resulting
from some virtual screening method (such as the GA considered here) yields a actives. Then
the enrichment factor is a/0.01A, with a value greater than unity meaning that the virtual
screening method has resulted in an increase in the number of actives when compared with the
number obtained by random selection.
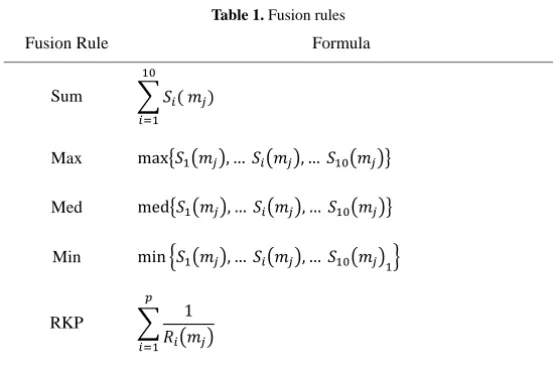
The GA was run ten times on each activity class in each dataset, and the ten resulting
rankings in each case were then combined into a single ranking using one of the fusion rules
listed in Table 1, where Si (mj) denotes the score for the j-th molecule in the i-th of the n GA
rankings. To illustrate the operation of a fusion rule, the Sum rule simply aggregates all of the
n scores, and then ranks the test-set molecules in decreasing order of these sums of scores; in like vein, the Med, Max and Min rules rank the test-set molecules on the basis of the median,
maximum or minimum scores. These four rules can also be applied if the scores, Si (mj), are
converted to the corresponding ranks, Ri (mj). Thus, if we take the Sum formulation there are
two fusion rules: SumS and SumR for fusing the scores and the ranks, respectively; and
similarly so for Med, Max and Min. However, the final rule in Table 1, the RKP (from
reciprocal rank) rule, which was first developed to rank the outputs of text search engines [23], is applicable only to the ranks. Assume that a threshold – here the top 1% - is applied to each
of the ten rankings and that a molecule mj appears in p of these: then the molecule is scored by
adding the reciprocal of its rank positions in those p rankings. There was thus a total of nine
different fusion rules that could be used to combine the sets of ten GA rankings for each activity
class. It is worth noting in passing that the Sum (when applied to ranks) and RKP rules involve
mathematical operations on ordinal data: this is mathematically inappropriate but has been
found to be effective in operation in both chemical and textual applications [18, 23] and these
rules have hence been included in the present study.
-628-Table 1. Fusion rules
Fusion Rule Formula
Sum ( )
Max max , … , …
Med med , … , …
Min min , … , …
RKP 1
The results that were obtained for the 15 ChEMBL activity classes are shown in Table
2. For each of the 15 activity classes, we list first the mean enrichment factor when averaged
over the ten GA runs that were carried out for this activity class, with each of the nine
subsequent columns listing the enrichment factor obtained when the fusion rule listed at the
top of the column was used to fuse the ten GA rankings. The comparable sets of results for the
[image:8.423.72.350.69.252.2]Table 2. Enrichment factor of actives when using nine different fusion rules on the ChEMBL activity classes
Activity Class GA RKP MaxR MedR SumR MinR MedS SumS MaxS MinS
5HT1A agonists 39.7 40.2 40.5 40.5 40.7 40.2 39.5 40.5 40.6 40.5
5HT3 antagonists 55.1 59.4 56.3 57.8 58.3 53.7 53.1 57.3 56.3 55.7
5HT reuptake inhibitors 34.5 35.1 35.4 33.4 34.5 35.1 33.0 34.7 35.8 33.9
Acetylcholinesterase inhibitors 36.8 37.1 40.9 33.8 35.8 41.5 41.2 38.2 35.8 31.1
AT1 antagonists 81.4 84.2 84.2 85.3 85.3 81.1 82.1 84.2 85.3 84.2
Cyclooxygenase inhibitors 38.3 40.0 39.2 40.0 39.2 37.6 39.2 37.6 39.2 35.2
D2 antagonists 31.8 32.5 33.4 31.5 33.0 34.0 31.7 33.1 30.7 30.6
Factor Xa inhibitors 47.4 50.0 49.6 47.0 48.5 47.9 47.6 49.1 50.0 47.3
HIV protease inhibitors 64.9 68.4 67.5 65.9 67.3 66.8 63.8 67.7 66.6 65.0
Matrixmetalloprotease inhibitors 68.8 69.7 69.4 68.0 69.4 69.1 68.0 69.1 69.9 67.1
Phosphodiesterase inhibitors 40.2 41.5 44.5 39.3 41.5 42.4 39.3 42.8 40.6 45.9
Protein kinase C inhibitors 58.6 60.0 58.4 58.4 58.4 59.5 57.4 58.4 59.0 59.0
Renin inhibitors 56.6 58.7 59.4 56.5 58.3 58.4 56.1 58.9 56.9 56.3
Substance P antagonists 70.1 73.0 73.2 70.5 71.8 72.4 71.4 71.7 72.8 70.5
Thermolysin inhibitors 46.8 48.3 48.7 48.3 48.4 48.0 47.5 48.8 48.3 45.4
-630-5HT1A agonists 19.2 20.2 19.8 19.1 19.9 19.4 19.6 19.9 19.6 19.6
5HT3 antagonists 41.2 43.6 43.43 41.8 42.8 42.5 42.7 43.3 42.7 41.7
5HT reuptake inhibitors 17.9 18.9 18.6 18.3 19.2 19.2 19.5 18.9 18.9 18.0
AT1 antagonists 48.0 49.0 49.0 49.5 48.9 48.8 48.5 48.9 49.4 47.9
Cyclooxygenase inhibitors 29.3 30.2 30.6 30.8 30.8 29.6 29.0 30.2 30.8 30.9
D2 antagonists 17.4 18.3 18.0 14.3 17.1 19.4 19.7 17.4 19.4 14.0
HIV protease inhibitors 47.0 49.0 49.0 47.7 48.7 47.7 45.3 48.9 49.5 47.9
Protein kinase C inhibitors 29.0 31.1 30.9 28.4 29.4 30.4 29.7 30.6 31.4 26.7
Renin inhibitors 70.4 72.2 72.5 71.8 72.0 71.3 71.9 71.8 72.3 69.3
Substance P antagonists 29.2 30.9 30.4 28.9 30.2 30.0 28.9 30.5 30.5 28.9
Thermolysin inhibitors 48.3 49.5 49.8 49.0 49.9 49.1 47.6 49.9 49.0 48.8
[image:10.423.75.522.81.263.2]-631-Table 4. Enrichment factor of actives when using nine different fusion rules on the WOMBAT activity classes
Activity Class GA RKP MaxR MedR SumR MinR MedS SumS MaxS MinS
5HT1A agonists 55.7 58.7 57.6 58.5 57.4 57.0 53.10 57.4 56.5 55.7
5HT3 antagonists 43.5 44.4 44.4 43.4 44.4 43.9 43.43 44.4 46.5 43.4
Acetylcholinesterase inhibitors 51.1 51.4 52.1 50.3 51.9 51.0 53.20 51.2 49.9 54.3
AT1 antagonists 80.7 83.0 83.0 83.7 83.4 83.13 82.52 83.0 82.4 83.6
Cyclooxygenase inhibitors 67.4 67.6 67.6 67.4 67.4 67.43 66.9 67.6 67.6 67.8
D2 antagonists 40.8 41.9 41.0 42.7 41.8 40.90 42.0 41.4 41.4 41.3
Factor Xa inhibitors 45.7 47.8 45.0 41.2 43.0 47.89 43.3 44.6 40.4 45.7
HIV protease inhibitors 53.6 57.3 57.1 51.3 54.7 55.47 55.5 55.7 56.4 54.2
Matrixmetalloprotease inhibitors 63.4 64.6 65.0 64.6 64.6 63.68 63.8 64.6 65.0 62.6
Phosphodiesterase inhibitors 49.3 51.9 52.1 49.8 51.7 51.68 49.8 51.9 52.8 48.3
Protein kinase C inhibitors 74.0 72.7 73.4 71.9 71.9 71.88 72.7 71.9 75.0 71.1
Renin inhibitors 78.8 80.6 80.6 80.6 80.8 80.33 77.5 81.0 81.0 81.7
Substance P antagonists 49.2 51.6 52.6 49.8 52.8 50.80 50.8 52.2 51.0 51.4
Thermolysin inhibitors 56.1 58.8 58.6 55.2 57.8 58.58 58.8 57.8 58.1 55.2
[image:11.423.83.522.82.307.2]-632-Discussion and conclusions
Two factors are immediately obvious from inspection of the results in Table 2. First, the mean
values for the ten GA runs are normally slightly less than the fused scores. With nine fusion
rules and 15 activity classes the mean GA run value can be compared with a fusion value 135
times: of these comparisons, the enrichment factor for the fused run exceeded the mean-GA
factor 99 times. Second, while the differences between the various fusion rules are quite small
(as illustrated for the MDDR activity classes in Figure 1) there are variations in performance
between the rules, and it is hence reasonable to consider which is the most generally effective.
Figure 1. Variations in enrichment factor for the eleven activity classes in the MDDR dataset. For
each class (as denoted by the initial characters of the class name listed in the left-hand column of Table 3) the three columns denote first the mean enrichment factor for the GA, and then the largest and the smallest enrichment factors for that class over the complete set of fusion rules.
The variations were analyzed using the Kendall Coefficient of Concordance, W, which
provides a means of quantifying the degree of association between k different rankings of n
different objects [24]. In the present context, k=15 and n=10 since each of the 15 activity
classes enables us to rank the 9 fusion rules and the GA in decreasing order of enrichment
the χ2 test of statistical significance, since χ2 = k(n-1)W with n-1 degrees of freedom. In the case of the ChEMBL results shown in Table 2, the computed value for W is 0.38, with an
associated value for χ2of 51.30 that is significant (p≤0.01). If a significant value is obtained then an overall ranking of the n objects is given by their mean ranks when averaged over the k
rankings as described by Siegel and Castellan [24]. Allocating scores of 9 (for the highest
enrichment factor for a particular activity class) down to 0 (for the lowest such factor) then the
mean scores for the ten approaches are listed in the column headed ChEMBL in Table 5, this
corresponding to the following ordering of fusion rules
RKP > MaxR > SumS, MaxS > SumR > MinR > MedR > MinS > Mean GA > MedS,
i.e., the RKP rule gave the best overall level of performance across the 15 activity class
rankings.
Table 2 detailed the enrichment factors for the ChEMBL dataset, the largest of the three
considered here. Very similar pictures of behavior were observed with the MDDR and
WOMBAT datasets as shown in Tables 3 and 4, with statistically significant levels of
agreement being obtained for the comparison of the various fusion rules in both cases: the
resulting mean ranks are included in the appropriate columns of Table 5. The final column of
this table gives the mean score for each of the ten types of ranking when taken across all three
datasets, where it will be seen that the RKP rule gives the best overall results and that the mean
[image:13.423.88.333.396.549.2]GA results are inferior to those resulting from every one of the fusion rules.
Table 5. Kendall W analysis using nine fusion rules and mean GA scores for the MDDR, WOMBAT
and ChEMBL databases
Fusion Database Mean
Rule MDDR WOMBAT ChEMBL Score
RKP 7.0 6.5 6.7 6.7
MaxR 6.4 6.3 6.6 6.4
MaxS 6.6 5.3 5.7 5.9
SumS 5.7 5.3 5.7 5.6
SumR 5.6 5.0 5.6 5.4
MinR 4.0 3.8 4.7 4.2
MedR 3.0 3.4 3.2 3.2
MedS 3.5 3.5 1.9 3.0
MinS 2.0 3.9 2.5 2.8
Mean GA 1.3 2.1 2.4 1.9
-634-The finding that RKP is the most effective fusion rule here is in line with a previous
study that found it was also the best for fusing the outputs of multiple similarity searches [25].
In fact, this fusion rule gives results that are sometimes comparable to those obtained with the very best individual GA run (rather than the mean-GA results considered thus far). Of the 15
ChEMBL activity classes, the best GA enrichment factor exceeded the RKP factor for seven classes while the converse applied for another seven classes (and there was one class - the AT1
antagonists - where the factors were the same). The results are less striking for the other two
datasets: for MDDR, the best GA factor exceeded the RKP factor for seven classes while the converse applied for four classes; and for WOMBAT, the corresponding figures were nine and
three (with two classes where the factors were the same)
In our previous paper [14], we demonstrated that a GA was able to produce dataset
rankings that were noticeably superior in terms of enrichment to those resulting from
established weighting schemes for substructural analysis. However, it was also demonstrated
that the GA’s non-deterministic nature meant that there was some degree of variation in the weights generated in multiple runs and, consequently, in the effectiveness of screening that
could be expected if the approach was to be used in practice. In this short paper, we have suggested the use of data fusion as a way of combining the rankings resulting from multiple
runs of the GA. The resulting, fused rankings are consistently better than the average
effectiveness of screening (as measured by the enrichment factor) and in some cases are
comparable with the maximum GA effectiveness. The simplicity and the effectiveness of this
joint procedure hence suggest itself as a useful addition to existing methods for LBVS.
That said, there are two inherent limitations to the use of data fusion. The first is the need to specify the nature of the fusion rule that is used to combine the various rankings of the
molecules comprising a database. The second is the identification of suitable weights and their
assignment to each ranking as a means of specifying the relative importance or effectiveness of each individual measure. It is, however, common to assign each measure the same weight,
as was the case in the work reported here. This uniform weighting approach can be enhanced
by the use of machine learning techniques but these require extensive training data that is unlikely to be available during the early stages of a drug discovery programme when LBVS is
most valuable [18]. An alternative approach that does not suffer from these limitations involves
the use of partial ordering methods, as exemplified by the Hasse diagram. This provides a
simple way of ordering objects where multiple criteria can be used without the need to specify
a fusion rule or to assign weights to the rankings that are being combined, and has already
are only suitable for use where small numbers of objects are involved, whereas applications of
the sort considered here involve databases containing hundreds of thousands or millions of
molecules. The development of efficient algorithms for the generation of Hasse diagrams
could hence enhance still further the attractiveness of the GA approach to LBVS.
References
[1] R. D. Cramer, G. Redl, C. E. Berkoff, Substructural analysis. A novel approach to the problem of drug design, J. Med. Chem. 17 (1974) 533–535.
[2] G. Redl, R. D. Cramer, C. E. Berkoff, Quantitative drug design, Chem. Soc. Rev. 3 (1974) 273–292.
[3] L. Hodes, G. F. Hazard, R. I. Geran, S. Richman, A statistical–heuristic method for automated selection of drugs for screening, J. Med. Chem. 20 (1977) 469–475.
[4] L. Hodes, Computer-aided selection of novel antitumor drugs for animal screening, ACS Sympos. Ser. 112 (1979) 583–602.
[5] L. Hodes, Computer-aided selection of compounds for antitumor screening: Validation of a statistical–heuristic method, J. Chem. Inf. Comp. Sci. 21 (1981) 128–132.
[6] L. Hodes, Selection of molecular fragment features for structure–activity studies in antitumor screening, J. Chem. Inf. Comp. Sci. 21 (1981) 132–136.
[7] S. Anzali, G. Barnickel, B. Cezanne, M. Krug, D. Filimonov, V. Poroikov, Discrimi-nating between drugs and nondrugs by prediction of activity spectra for substances (PASS), J. Med. Chem. 44 (2001) 2432–2437.
[8] A. M. Capelli, A. Feriani, G. Tedesco, A. Pozzan, Generation of a focused set of GSK compounds biased toward ligand–gated ion–channel ligands, J. Chem. Inf. Model. 46 (2006) 659–664.
[9] A. Ormerod, P. Willett, D. Bawden, Comparison of fragment weighting schemes for substructural analysis, Quant. Struct. Activ. Relat. 8 (1989) 115–129.
[10] S. E. Robertson, K. Spärck Jones, Relevance weighting of search terms, J. Am. Soc. Inf. Sci. 27 (1976) 129–146.
[11] J. Hert, P. Willett, D. J. Wilton, P. Acklin, K. Azzaoui, E. Jacoby, A. Schuffenhauer, New methods for ligand–based virtual screening: use of data fusion and machine learning to enhance the effectiveness of similarity searching, J. Chem. Inf. Model. 46 (2006) 462–470.
-636-[12] M. Hassan, R. D. Brown, S. Varma–O’Brien, D. Rogers, Cheminformatics analysis and learning in a data pipelining environment, Mol. Diversity 10 (2006) 283–299.
[13] X. Y. Xia, E. G. Maliski, P. Gallant, D. Rogers, Classification of kinase inhibitors using a Bayesian model, J. Med. Chem. 47 (2004) 4463–4470.
[14] J. D. Holliday, N. Sani, P. Willett, Calculation of substructural analysis weights using a genetic algorithm, J. Chem. Inf. Model. 55 (2015) 214–221.
[15] D. E. Clark, Evolutionary Algorithms in Computer–Aided Molecular Design, Wiley-VCH, Weinheim, 2000.
[16] D. L. Hall, S. A.H. McMullen, Mathematical Techniques in Multisensor Data Fusion, Artech House, Boston, 2004.
[17] B. V. Dasarathy, A representative bibliography of surveys in the information fusion domain, Inf. Fusion 11 (2010) 299−300.
[18] P. Willett, Combination of similarity rankings using data fusion, J. Chem. Inf. Model. 53 (2013) 1–10.
[19] M. Feher, Consensus scoring for protein-ligand interactions, Drug Discov. Today 11 (2006) 421−428.
[20] C. W. Chu, J. D. Holliday, P. Willett, Combining multiple classifications of chemical structures using consensus clustering, Bioorg. Med. Chem. 20 (2012) 5366–5371.
[21] R. P. Sheridan, S. K. Kearsley, Why do we need so many chemical similarity search methods? Drug Discov. Today 7 (2002) 903−911.
[22] E. J. Gardiner, V. J. Gillet, M. Haranczyk, J. Hert, J. D. Holliday, N. Malim, Y. Patel, P. Willett, Turbo similarity searching: Effect of fingerprint and dataset on virtual-screening performance, Stat. Anal. Data Mining 2 (2009) 103–114.
[23] R. Nuray, F. Can, Automatic ranking of information retrieval systems using data fusion, Inf. Proc. Manag. 42 (2006) 595–614.
[24] S. Siegel, N. J. Castellan, Nonparametric Statistics for the Behavioural Sciences, McGraw–Hill, New York, 1988.
[25] B. Chen, C. Mueller, P. Willett, Combination rules for group fusion in similarity–based virtual screening, Mol. Informatics 29 (2010) 533–541.
[27] R. Todeschini, V. Consonni, H. Xiang, J. D. Holliday, M. Buscema, P. Willett, Similarity coefficients for binary chemoinformatics data: Overview and extended comparison using simulated and real data sets, J. Chem. Inf. Model. 52 (2012) 2884– 2901.
[28] P. Lind, Construction and use of fragment–augmented molecular Hasse diagrams, J. Chem. Inf. Model. 54 (2014) 387–395.