Teacher Voice
Omnibus Survey
Research report
July 2017
2
Contents
List of figures 3
List of tables 5
1. Introduction 6
2. Executive Summary 7
2.1. Curriculum reform 7
2.2. Teacher workload 7
2.3. Professional development 8
2.4. School arrangements for alternative provision 9
2.5. Pupil Premium 9
2.6. Character education 10
2.7. Teacher supply 10
2.8. Tolerance and values of respect 11
2.9. Bullying 11
2.10. Careers education, raising aspirations and apprenticeships 13
2.11. Support for pupils with special educational needs 15
2. 12. Primary and Sports Premium 16
3. Curriculum reform 18
4. Teacher workload 21
5. Professional development 24
6. School arrangements for alternative provision 25
7. Pupil premium 27
8. Character education 28
9. Teacher supply 30
10. Tolerance and values of respect 32
11. Bullying 34
12. Careers education, raising aspirations and apprenticeships 39
13. Support for pupils with special educational needs 50
14. Primary and Sports Premium 54
Annex 1: Supporting information 57
3
List of figures
Figure 1 How confident is your school to teach, from September 2017, the third wave of
new GCSEs? 18
Figure 2 What proportion of pupils in your school who started Key Stage 4 in September 2016 are studying the range of subjects required to enter the EBacc? 19
Figure 3 What has your school done to evaluate and reduce unnecessary workload? 22
Figure 4. Are you aware of the newly published standard for teachers' professional
development? 24
Figure 5 In what circumstances do you most commonly use alternative provision? 25
Figure 6 How many extra-curricular activities does your school offer? 28
Figure 7 If you had teacher supply issues in the following subjects, how likely would you
be to attempt to recruit teachers from outside the UK? STEM 30
Figure 8 If you had teacher supply issues in the following subjects, how likely would you be to attempt to recruit teachers from outside the UK? Modern foreign languages 31
Figure 9 How confident are you in implementing the new duty on schools to 'have regard to the need to' prevent children and young people from being drawn into terrorism? 32
Figure 10 How often have you seen or received reports of any of the following types of
bullying amongst pupils in the last 12 months? 34
Figure 11 Percentage of respondents who replied they were very and fairly confident they would know what to do if they saw or heard of the following types of bullying occurring at
their school 37
Figure 12 Percentage of classroom teachers and senior leaders who replied they were very confident they would know what to do if they saw or heard of the following types of
bullying occurring at their school 38
Figure 13 Statements that apply to careers education in your school 40
Figure 14 In general, how would you describe the aspirations of pupils in your school? 42
Figure 15 Three most significant barriers your school faces in raising aspirations –
Primary 43
4
Figure 17 What, if anything, do you do to encourage pupils to have high aspirations
and/or to help them achieve their potential? (Primary) 46
Figure 18 What, if anything, do you do to encourage pupils to have high aspirations
and/or to help them achieve their potential? (Secondary) 47
Figure 19 Techniques used to identify whether the support provided to pupils on SEN
Support is improving their progress/attainment 51
Figure 20 Activities found to be most useful in improving the support provided to pupils
on SEN Support 52
Figure 21 In the 2015/16 school year, how confident are you that a member of staff has met the parents/carer of each pupil on SEN Support at least three times to set clear
5
List of tables
Table 1 Representation of (weighted) primary schools compared to primary schools
nationally 58
Table 2 Representation of (weighted) secondary schools compared to secondary schools
nationally 59
Table 3 Representation of all schools (weighted) compared to all schools nationally 60
Table 4 Comparison of the achieved (weighted) sample with the national population by
grade of teacher (not including academies) 61
Table 5 Comparison of the achieved (weighted) academies sample with the national
population by grade of teacher 61
6
1. Introduction
The Department for Education (DfE) submitted a total of 32 questions to be included in the Teacher Voice Omnibus Survey and a Senior Leader Booster Survey conducted in the autumn of 2016. The Teacher Voice Omnibus Survey was completed online between 4th and 9th November 2016, and the Senior Leader Booster Survey was completed online and on paper between 26th November and 16th December 2016.
The questions explored teachers’ and senior leaders’ views on, and activities relating to a range of areas such as: curriculum reform, professional development, alternative
provision, character education, bullying, careers, and support for pupils with special educational needs.
In total, 1,936 practising teachers from 1,629 schools in the maintained sector in England completed the survey. One thousand and forty-seven (54 per cent) of the respondents were teaching in primary schools and 889 (46 per cent) were teaching in secondary schools. In terms of role, 1002 respondents (52 per cent) were classroom teachers and 934 (48 per cent) were senior leaders.
Findings are provided for the overall sample, and are broken down by school phase (primary and secondary) and role (senior leader or classroom teacher), where relevant.
Both the primary school sample, secondary school and combined samples differed significantly from the national population by free school meals eligibility. To address this, weights were calculated using the free school meals data and then applied to the
7
2. Executive Summary
2.1. Curriculum reform
The English Baccalaureate (EBacc) forms part of the process of reform of GCSEs in England. Pupils achieve the EBacc if they attain grades A*-C or grades 9-5 for those reformed GCSEs (English and mathematics in 2017), in the core academic subjects of English, mathematics, history or geography, two sciences, and a language. The content of the GCSEs is also changing as part of these reforms with the aim of making them more demanding. New qualifications in English language, English literature and
mathematics were introduced from September 2015, with the first examinations in these subjects in summer 2017; and from September 2016 schools have been working to revised syllabuses in a further 20 subjects.
Most secondary senior leaders (89 per cent) said that the preparation and start of
teaching for the new GCSEs that were introduced in September 2016 had gone very well or fairly well. However, the proportion who said it had gone very well (16 per cent) was much smaller than that which said fairly well (73 per cent).
Secondary school leaders were also asked how confident their school was to teach the third wave of the new GCSEs from September 2017. Nearly three-quarters (72 per cent) said they were fairly confident or very confident but less than one in ten (9 per cent) said they were very confident. Around one in five (19 per cent) said they were not very
confident but hardly any (2 per cent) indicated they were not at all confident.
Nearly two-thirds of secondary school respondents (62 per cent) said that more than half of the pupils who started in Key Stage 4 in September 2016 were studying the range of subjects required to enter the EBacc. Around a fifth (18 per cent) said that more than 91 per cent of learners would be studying those subjects in September 2017.
When asked about how they intended to develop the EBacc in future, around two-thirds (68 per cent) of secondary school staff said they intended to keep the proportion of pupils studying the range of subjects required to enter the EBacc broadly the same from
September 2017. A third of senior leaders (33 per cent) and a quarter (25 per cent) of classroom teachers said that a higher percentage of pupils would be studying the EBacc subjects in future.
2.2. Teacher workload
8
more government and schools could do to minimise workload. Three independent review groups were set up to address tasks most commonly identified as burdensome by
respondents to the workload challenge – recording, analysing and monitoring data; ineffective marking; and lesson planning. They published their reports in March 2016. DfE has also published the report from the Teacher Workload Survey 2016 alongside an
action plan, which provides an update as well as further commitments to help tackle workload.
Senior leaders and classroom teachers were asked what their school had done to evaluate and reduce unnecessary workload from a pre-selected list of options. About a quarter (26 per cent) indicated that they had used advice from Ofsted, and a similar proportion (23 per cent) said they had used the independent reports on marking, planning and resources and/or data management, as a basis to review current policies. Nearly a fifth (17 per cent) said they had carried out a workload survey of staff. Nearly half (47 per cent) of all respondents said they had not used any of the listed methods.
A higher percentage of senior leaders than classroom teachers indicated that they had used each of the methods listed in the survey. There was little difference in the response of secondary school respondents compared with primary schools. Nearly two-fifths (39 per cent) of senior leaders indicated that they had used advice from Ofsted. Thirty-six per cent of senior leaders said they had used independent reports on marking, planning and resources and/or data management as a basis to review current policies. A fifth (20 per cent) of senior leaders said they had actively addressed the recommendations for schools in the three reports. Just over a quarter (28 per cent) of senior leaders said that they had not used any of the methods included in the survey.
When considering impact, 40 per cent of those who said their school had evaluated workload, reported that average teacher workload had reduced. Nearly a third (32 per cent) cited a reduction of up to two hours per week with the remainder (8 per cent) identifying reductions of up to five hours or more per week. However, more than half (57 per cent) said that it had no impact on the hours they worked.
2.3. Professional development
The new standard for teachers’ professional development was published by the DfE in July 2016. The standard states that professional development must be prioritised by school leadership and should have a focus on improving and evaluating pupil outcomes, underpinned by robust evidence and expertise, include collaboration and expert
challenge and be sustained over time.
9
the standard but not the area it covers. A fifth (20 per cent) said they were not aware of the new standard. The responses from primary and secondary senior leaders were similar, although a higher proportion of primary school leaders knew of the new standard and the aspects it covers.
2.4. School arrangements for alternative provision
In England, schools (including maintained schools, Academies, and Free Schools) are responsible for ensuring that appropriate provision is made for pupils who are excluded from schools for a fixed term. Schools can also direct children off-site, into alternative provision without issuing an exclusion to address behavioural issues. When arranging alternative provision, it is expected that schools/academies will ensure that the provision appropriately meets the needs of pupils and enables them to achieve good educational attainment on par with their mainstream peers, regardless of their circumstances or the settings in which they find themselves.
Overall, more than half of the senior leaders (53 per cent) responded that they did not use alternative provision and most of the others (24 per cent) did so for regular, fixed days, alongside mainstream education.
More than two-fifths (43 per cent) of secondary senior leaders used alternative provision for regular, fixed days, alongside mainstream education, while about a fifth (22 per cent) did so to provide education during fixed-period exclusion. They also indicated that they directed pupils offsite for varying lengths of time in order to address behavioural issues: nearly a quarter (23 per cent) did so over one academic year, a fifth (20 per cent) did so over one term (but under one academic year) and a fifth (20 per cent) did so for more than two weeks (but less than half a term).
More than half (54 per cent) of the secondary school leaders who used alternative
provision said that it cost them more than £5,000 each year. They included a fifth (19 per cent) of secondary school leaders who said alternative provision cost their school more than £25,000 per year.
The amounts reported by the primary school leaders who used alternative provision were usually much smaller and most of those who provided information said it cost their school up to £5,000 a year. Most of the others either did not respond to the question or said that the information was not available.
2.5. Pupil Premium
10
encouraged to commission external reviews of the way they use the funding, although these are not compulsory.
Nearly two-thirds of the school leaders (62 per cent) said they had not yet commissioned such a review but only a small number said they were not aware that they could do so. A higher percentage of secondary school leaders (42 per cent) than primary school leaders (23 per cent) said they had done so. The vast majority (23 out of 24) of those who had commissioned a review said they had found it helpful or very helpful.
2.6. Character education
The term character and resilience refers to attitudes and traits that have been found to be associated with academic success, employability and making a positive contribution to British society. Learning which helps to deliver character and resilience can be delivered through lessons in school, sports and extra-curricular activities. Policy innovations
include: an expansion of the National Citizenship Service with an expectation that
schools give the opportunity to 16 and 17 year old pupils pupils to take part; and to build evidence-based approaches that support the development of non-cognitive skills in school children.
The survey explored what extra-curricular opportunities schools offered in eight pre-selected types of activities. Most secondary schools offered ICT (75 per cent), performing arts (75 per cent), homework, breakfast or after-school clubs (75 per cent), arts, crafts and skills (75 per cent), and awards and service activities (72 per cent), and a large number offered academic subject-related clubs (67 per cent). More than half provided sport/outdoor activity (57 per cent), and volunteering (55 per cent).
Primary schools provided opportunities in arts, craft and skills (83 per cent),
homework/breakfast clubs (80 per cent), and sport/outdoor activities (80 per cent). The percentage of primary schools who offered performing arts (70 per cent), ICT (60 per cent), and academic subject-related clubs (57 per cent) was lower than was the case for secondary schools. Only small numbers of primary schools offered opportunities for awards and services, and volunteering.
2.7. Teacher supply
11
School senior leaders were asked whether they would consider recruiting teachers from outside the UK if they had teacher supply issues.
A higher proportion of secondary school leaders said they would attempt to recruit outside the UK. Around two-fifths (41 per cent) of secondary school leaders and 14 per cent of primary school leaders also said that they would recruit people from outside the UK to teach Modern Foreign Languages (MFL). More than a third (36 per cent) of secondary school leaders and eight per cent of primary school leaders said they might recruit STEM teachers from outside the UK.
2.8. Tolerance and values of respect
There is a Prevent duty on schools to 'have regard to the need to prevent children and young people from being drawn into terrorism’. The Prevent duty advice (2015) states that this should be embedded as part of schools’ existing wider safeguarding duties, and advises on positively building the resilience of all children to radicalisation. Support, advice and resources for teachers, school leaders and parents is available on the website Educate Against Hate.
Nearly three-quarters (71 per cent) of classroom teachers replied that they were
confident or fairly confident in implementing the new duty on schools to, 'have regard to the need to 'prevent children and young people from being drawn into terrorism’. Less than a tenth (9 per cent) said they were not confident. Only 2 per cent of the teachers who responded said they were not aware of this responsibility. The responses from teachers in primary and secondary schools were similar.
When asked how confident they were that their school effectively teaches the values of respect and tolerance of those from different backgrounds, more than half (57 per cent) of all respondents said that they were very confident and nearly two-fifths (38 per cent) said that they were fairly confident that they did so. A higher percentage of senior leaders (68 per cent) said they were very confident compared with less than half of the classroom teachers (47 per cent). A higher percentage of primary school respondents (61 per cent) than those in secondary schools (53 per cent) said that they were very confident that their school was effective in doing so.
2.9. Bullying
12
and respond to commitments in the 2016 Hate Crime Action Plan and the Government’s response to the Women and Equalities Committee’s inquiry into sexual harassment and sexual violence in schools, the Department for Education and the Government Equalities Office are building their evidence base. The aim of the evidence base is to better
understand the scale of the problem in relation to the various types of bullying in schools.
The survey asked respondents whether they had encountered any of nine specific forms of bullying in the previous 12 months and to what extent they felt confident that they would be able to deal with those situations if they arose.
Most respondents (94 per cent) said that they rarely or never witnessed anti-Semitic bullying and 85 per cent said they had never done so. Similarly, most respondents (91 per cent) said that they had rarely or never witnessed anti-Muslim behaviour although less than three-quarters of respondents (72 per cent) said they had never witnessed it. Most (92 per cent) indicated that they had rarely or never seen other forms of bullying based on religion and nearly three-quarters (73 per cent) said they had never done so.
Although four-fifths (80 per cent) of respondents said that they had rarely or never seen instances of bullying based on race or nationality during the last year, less than a third (30 per cent) reported that they had never seen it during that period.
Most respondents (92 per cent) said they rarely or never saw instances of bullying based on disability in the previous twelve months and around two-thirds (64 per cent) said they had never seen it during that period. Most respondents (91 per cent) said that they rarely or never encountered transphobic behaviour and four-fifths (81 per cent) had never done so in the previous year. There was slightly more evidence that respondents had
witnessed some form of homophobic or biphobic bullying in the previous year. Although four-fifths of respondents (81 per cent) had rarely or never seen such behaviour, less than half (48 per cent) had never done so and 13 per cent indicated that they had seen it sometimes.
Although nearly three-quarters (73 per cent) of all respondents said that they had rarely or never witnessed instances of sexist or sexual language used to degrade girls, a much smaller proportion (42 per cent) responded that they had never done so during the last year and a fifth (17 per cent) said they encountered it sometimes. Likewise, most
respondents (87 per cent) said they rarely or never saw examples of boys touching girls inappropriately but far fewer (29 per cent) replied ‘never’ and 8 per cent indicated it happened sometimes.
13
schools. However, it should be emphasised that a minority of secondary school
respondents recalled seeing any of the different forms of bullying noted in the survey. At the same time, a higher percentage of senior leaders than classroom teachers reported never or rarely seeing the different forms of bullying listed in the survey.
Most respondents said that they were confident that they would know what to do if they saw or heard about the various examples of bullying. Around two-thirds (68 per cent) said they were very confident that they would be able to respond appropriately to examples of bullying based on race or nationality and most of the others (29 per cent) said they were fairly confident. The pattern of responses was similar with respect to dealing with anti-Muslim behaviour, anti-Semitic behaviour, other forms of bullying based on religion, and bullying based on disability.
More than two-thirds of respondents said they were very confident (68 per cent) in dealing with sexist or sexual language used to degrade girls and most of the others (27 per cent) said they were fairly confident. At the same time, more than two-thirds of
respondents (68 per cent) said they were very confident in dealing with examples of boys touching girls inappropriately and most others (26 per cent) said they were fairly
confident.
Most respondents said they were very confident in dealing with homophobic or biphobic bullying (62 per cent) and most others said they were fairly confident (30 per cent). Just over half of all respondents (55 per cent) said they would be very confident in dealing with transphobic bullying and most of the others said they were fairly confident (29 per cent).
In all cases a higher percentage of respondents in secondary schools than those in primary schools said they were very confident in dealing with these types of bullying. Likewise senior leaders indicated that they were more confident than classroom teachers in dealing with the examples of bullying examined in the survey.
2.10. Careers education, raising aspirations and
apprenticeships
One of the commitments of the recently published ‘Building our Industrial Strategy’ Green Paper was that the Government will publish a comprehensive careers strategy later this year. High quality careers provision on academic and technical routes, including
apprenticeships, is a key priority for the Government.
14
said that their school has an identified lead individual with responsibility for overseeing the institution’s careers programme; and the school provides personal guidance (i.e. one-to-one sessions) to its pupils (senior leaders 80 per cent and teachers 69 per cent). Secondary senior leaders believed that the main source of information they used to help pupils make informed decisions about their education and career choices was
career/subject-specific web tools (85 per cent) in contrast to 59 per cent of classroom teachers. A high proportion (77 per cent) of both secondary classroom teachers and senior leaders said that their main information source was their own personal knowledge and experience.
The Secretary of State for Education has made clear in a recent speech the importance of high aspirations for all pupils. More broadly, the Secretary of State has signalled her determination (here) to improve social mobility through education, which means levelling up opportunity for the most disadvantaged pupils, and those who are just about
managing, to ensure that all young people can fulfil their potential across every life phase. A key part of this is making sure the education system prepares young people and adults for career success.
Overall, more respondents described the aspirations of the pupils in their school as ‘very high’ or ‘high’ rather than ‘low’ or ‘very low’. For example, 48 per cent of primary
respondents described pupils’ aspirations as ‘very high’ and ‘high’, while 16 per cent described them as ‘very low’ and ‘low’. The corresponding figures for secondary
respondents were 45 per cent and 19 per cent. Just over a third (35 per cent) of primary and secondary respondents described the aspirations of their pupils as ‘average’.
Proportionally more primary respondents (41 per cent of senior leaders and 36 per cent of classroom teachers) than secondary respondents (31 per cent of senior leaders and 33 per cent of classroom teachers) felt that the aspirations of their pupils were ‘high’. Additionally, more secondary senior leaders (17 per cent) than secondary classroom teachers (11 per cent) and more primary senior leaders (10 per cent), than primary classroom teachers (9 per cent) felt that the aspirations of their pupils were ‘very high’.
In terms of overcoming barriers to raising aspirations, two-thirds of primary respondents (66 per cent of senior leaders and 61 per cent of classroom teachers) felt that lack of support from parents was one of the most significant barriers their school faces in raising the aspirations of its pupils. As in primary schools, secondary senior leaders cited lack of support from parents (55 per cent) as a significant barrier; whereas this was viewed as significant by only just over one third of classroom teachers (37 per cent). Nearly half of secondary teachers (45 per cent) identified pupils' lack of motivation as one of their most significant barriers in raising aspirations (in contrast to 38 per cent of senior leaders).
15
in primary schools, and 90 per cent of senior leaders and 70 per cent of teachers in secondary schools); building life skills (88 per cent of senior leaders and 78 per cent of teachers in primary schools, and 78 per cent of senior leaders and 63 per cent of
teachers in secondary schools); and providing talks from role models/inspirational people (68 per cent of senior leaders and 51 per cent of teachers in primary schools, and 89 per cent of senior leaders and 71 per cent of teachers in secondary schools).
Over half of primary respondents (53 per cent of senior leaders and classroom teachers) said that building life skills was the most effective way to raise aspirations and help pupils achieve their potential. For senior leaders in secondary schools a focus on raising
attainment (26 per cent of senior leaders) and talks from role models/inspirational people (16 per cent) were considered to be most effective. Secondary classroom teachers said that talks from role models/inspirational people (23 per cent) and building life skills (20 per cent) were viewed as most effective at raising aspirations.
In order to promote apprenticeships four-fifths of secondary senior leaders said that they shared literature about apprenticeships (80 per cent) and approximately three-fifths said they invited education or training providers (62 per cent) or employers (60 per cent) to talk about apprenticeships or took pupils to a careers or apprenticeships fair (60 per cent). Nearly three-quarters (69 per cent) of secondary senior leaders said that a mechanism to match schools with employers offering apprenticeships and willing to speak to pupils would help to further promote apprenticeships in their school.
2.11. Support for pupils with special educational needs
The Special Educational Needs and Disabilities Code of Practice 2015 applies to children and young people aged 0-25 years. Schools should respond to pupils’ needs by
providing personalised and differentiated teaching and learning support. They must also involve parents and pupils fully in decision-making processes about how to meet pupils’ special educational needs. The SEN Support category was introduced as part of
extensive SEND reforms in 2014 to replace School Action and School Action Plus as a means of supporting children and young people that have special educational needs (SEN) but did not have a statement of SEN, Learning Difficulty Assessment or an Education, Health and Care plan (EHC plan). In 2016, 12 per cent of the total pupil population in England (991,980 pupils) were on SEN support (DfE, SFR 29/2016 (2016)).
16
frequent and focused assessments of progress (than are used for pupils without SEN) and 31 per cent used the SEN component of a computerised management information system.
Teachers were asked to identify which activities they found useful to support pupils on SEN Support. The activities teachers identified as most useful focused on school-based training and sharing practice: school-led training/CPD (53 per cent); sharing practice between teachers or schools (48 per cent); and case meetings with, or input from, special educational needs coordinators (‘SENCOS’) or specialists (41 per cent). Nearly a third of teachers (31 per cent) said progress discussions with pupil's parents (beyond normal parents' evenings etc.) were useful in supporting pupils on SEN Support, while a quarter (26 per cent) identified specific teacher training or CPD (not provided by their school) as useful for this purpose.
The survey asked respondents to rate their level of confidence that in the 2015/16 school year a member of staff had met with the parents/carers of each pupil with SEN at least three times to set clear outcomes and review progress. This question was asked of three groups of staff: senior leaders in primary and secondary schools and classroom teachers in primary schools. Most (79 per cent) respondents across the three groups of staff
reported being ‘very’ or ‘fairly’ confident that these meetings had taken place. Only 11 per cent of respondents indicated that they were ‘not very confident’ or ‘not at all confident’ that these meetings had taken place. Primary leaders were the most confident about this, with 59 per cent saying they were ‘very confident’, compared with 44 per cent of
secondary school leaders and 38 per cent of primary classroom teachers who said they were ‘very confident’ that the meetings had taken place.
2. 12. Primary and Sports Premium
The PE and sports premium is paid to schools with primary-aged pupils to enable them to make ‘additional and sustainable improvements to the quality of the PE and sports they offer’. In 2016-17, a total of £160 million was made available and this is set to rise to £320m per annum from September 2017. Schools are able to use the funding at their discretion but they are required to demonstrate that the way they use it will add value to their PE provision. They may not use the money to pay for the statutory minimum provision outlined in the National Curriculum or to enable staff to access Planning,
Preparation, and Assessment time. The way the grant is used is monitored by governors and schools must publish details of how they use the funding on their website. In
addition, Ofsted consider its impact and how it is monitored as part of their inspections.
17
awareness that the funding for the premium would be doubling than classroom teachers. The two main areas where senior leaders planned to allocate more than 25 per cent of total funding in 2017 were to the least physically active pupils (28 per cent) and
disadvantaged pupils (21 per cent). Fewer senior leaders indicated that they planned to focus this allocation on pupils with high sporting ability (17 per cent), pupils with
swimming and water safety needs (15 per cent) and pupils with SEN (10 per cent). Nearly half of respondents (47 per cent) who were aware of the funding increase said they intended to provide additional help to pupils struggling to meet the minimum
18
3. Curriculum reform
Since 2010, the government has been engaged in a process of reform of GCSEs in England in order to ensure they match with the highest performing education systems around the world and that they provide a firm basis upon which to measure and compare school performance. The changes initiated by the government have included:
the introduction of a new grading scale from 9-1 for GCSE
the use of formal examinations as the method of assessment through a
presumption that an alternative will only be used if an examination is not possible
minimal use of ‘tiered’ papers so that the majority of pupils sit the same paper examinations available only in the summer examination series.
[image:18.595.66.469.413.629.2]The content of the GCSEs is also changing as part of these reforms with the aim of making them more demanding. New qualifications in English language, English literature and mathematics were introduced from September 2015, with the first examinations in these subjects in summer 2017; and from September 2016 schools have been working to revised syllabuses in a further 20 subjects.
Figure 1 How confident is your school to teach, from September 2017, the third wave of new GCSEs?
Source: Senior leaders; Teacher Voice Omnibus Survey November 2016 and Senior Leader booster November 2016
19
the number who responded very well (16 per cent). A similar response was given when secondary school leaders were asked how confident their school was to teach the third wave of the new GCSEs from September 2017. As Figure 1 indicates nearly three quarters (72 per cent) said they were fairly confident or very confident but just under one in ten (9 per cent) said they were very confident. Around one in five (19 per cent) said they were not very confident but hardly any (2 per cent) indicated they were not at all confident.
The most frequently-cited subjects by respondents when asked if there were any subjects from a list of the new GCSEs introduced in 2016 they were particularly concerned about were modern languages (21 respondents), computer science (20 respondents), sciences (19 respondents) and religious education/studies (11
respondents). Twelve respondents noted a concern that the guidance they had received had not been sufficient.
The most frequently-cited subjects by respondents when asked if there were any subjects from a list of the new GCSEs introduced in 2017 they were particularly concerned about were design and technology (48 respondents) and business (10 respondents).
As part of the government reforms, entry to and achievement of the English
[image:19.595.94.445.535.723.2]Baccalaureate (EBacc) was introduced as a measure in performance tables in 2010. Pupils achieve the EBacc if they attain grades A*-C or grades 9-5 for those reformed GCSEs (English and mathematics in 2017), in the core academic subjects of English, mathematics, history or geography, two sciences, and a language. These changes form part of a broader agenda to develop a ‘rigorous, knowledge-rich, academic curriculum [that] benefits everyone’ (DfE, 2016, p.24).
20
Source: Senior leaders and classroom teachers, Teacher Voice Omnibus Survey November 2016 and Senior Leader booster November 2016
Figure 2 shows that nearly a fifth (18 per cent) of all respondents said that more than 90 per cent of pupils in their school were studying the range of subjects required to enter the EBacc and about three-fifths (62 per cent) of all respondents said that more than 50 per cent of pupils were studying the range of subjects required to enter the EBacc. A higher percentage of classroom teachers than senior managers said that pupils are studying the range of subjects required to enter the EBacc.
Nearly two-thirds of secondary school respondents (62 per cent) said that more than half of the pupils who started in Key Stage 4 in September 2016 were studying the range of subjects required to enter the EBacc. A fifth (18 per cent) said that 91 per cent or more of learners would be studying those subjects in September 2017. However, a higher
percentage of classroom teachers than senior leaders said that pupils were, or would be, studying the subjects leading to EBacc.
21
4. Teacher workload
Removing unnecessary workload is high on the education agenda. The Government undertook the Workload Challenge in 2014, which asked teachers about unnecessary or unproductive tasks, strategies in schools to manage workload and what more
government and schools could do to minimise workload. The three tasks that were most commonly reported as adding unnecessary burdens were: recording, inputting,
monitoring and analysing data, excessive/depth of marking and detail/frequency of
lesson planning. Respondents most commonly said that the burden of their workload was driven by accountability/perceived pressures of Ofsted, tasks set by senior/middle
leaders, working to policies set at local/school level and policy change at national level.
The government has taken action to remove unnecessary workload; including establishing review groups to explore the three tasks that teachers said were most burdensome in the Workload Challenge – ineffective marking, use of planning and resources, and data management. The reports, published on 26 March 2016, set out principles and made recommendations to be taken at every level in the school system.
In addition, the department introduced the DfE Protocol which includes lead-in times for significant changes to accountability, curriculum and qualifications. Ofsted also set out clear guidance about what they do and do not need to see in inspections in order to reduce workload; this is now incorporated into The School Inspection Handbook.
On 24 February 2017 the department published the results of the 2016 teacher workload survey, a commitment from the Workload Challenge. The findings provide additional information about where the department should be targeting workload reduction, and the DfE has published an action plan with a full update of work and future commitments to help reduce teacher workload.
Senior leaders and classroom teachers were asked what their school had done to
evaluate and reduce unnecessary workload from a pre-selected list of options (all options detailed in Figure 3) and through an open ended question.
22
[image:22.595.69.510.166.406.2]policies. However, more than a quarter (28 per cent) of senior leaders said that they had used none of the methods included in the survey.
Figure 3 What has your school done to evaluate and reduce unnecessary workload?
Source: Senior leaders and classroom teachers; Teacher Voice Omnibus Survey November 2016 and Senior Leader booster November 2016
There was little difference in the response of secondary school respondents compared with primary schools, although the percentage in primary schools (29 per cent) who said they had used Ofsted advice was higher than was the case in secondary schools (22 per cent).
Those who said that their school had evaluated staff workload were asked what impact it had made on the hours they worked. More than half (57 per cent) said that it had made no difference at all, while nearly a third (32 per cent) felt it had made a difference of up to two hours per week. Only 8 per cent thought it made a difference of more than two hours per week. A larger proportion of classroom teachers (67 per cent) than senior leaders (52 per cent) said it had made no difference to the hours they worked. Phase was also a factor influencing responses. Nearly two-thirds (63 per cent) of secondary school respondents felt it had made no difference and about half (51 per cent) of those in primary schools were of the same opinion. Not surprisingly, therefore, a higher
23
to two hours but the percentage of secondary school respondents who held that view was lower (26 per cent).
The small number of respondents (9 per cent) who provided other activities they had undertaken to evaluate and reduce unnecessary workload gave a variety of different answers. Of these, the largest single response (36 respondents) was that they had
conducted some form of internal evaluation. Another 15 said that they had discussed with staff and 12 mentioned reviewing marking policies and reallocating tasks from teachers to other staff. Other steps taken included offering training on how to manage workload, establishing wellbeing groups, reducing the number of staff briefings, changing
24
5. Professional development
The new standard for teachers’ professional development was published by the DfE in July 2016. The standard states that effective teaching requires considerable knowledge and skill, which should be developed as teachers’ careers progress. Achieving the delivery of high-quality professional development, which benefits pupils by giving them access to the best teaching, requires head teachers, school leadership teams, teachers and training organisations working in a productive partnership. The standard states that professional development must be prioritised by school leadership and should have a focus on improving and evaluating pupil outcomes, underpinned by robust evidence and expertise, include collaboration, expert challenge and be sustained over time.
[image:24.595.82.468.342.579.2]As Figure 4 below shows, the responses from primary and secondary senior leaders were similar, but the proportion of primary school leaders (52 per cent) who knew of the new standard and the aspects it covers was higher than was the case among secondary school leaders (45 per cent).
Figure 4. Are you aware of the newly published standard for teachers' professional development?
Source: Senior leaders; Teacher Voice Omnibus Survey November 2016 and Senior Leader booster November 2016
25
6. School arrangements for alternative provision
In England, schools (including maintained schools, Academies, and Free Schools) are responsible for ensuring that appropriate provision is made for pupils who are excluded from schools for a fixed term. Schools can also direct children off-site, into alternative provision without issuing an exclusion to address behavioural issues.
When arranging alternative provision, it is expected that schools/academies will ensure that the provision appropriately meets the needs of pupils and enables them to achieve good educational attainment on par with their mainstream peers, regardless of their circumstances or the settings in which they find themselves.
The alternative provision put in place must be suitable and full time or as close to full time as in the child’s best interest because of his or her health needs. A personalised plan for intervention should be prepared by the school setting clear objectives for improvement and attainment, timeframes, arrangements for assessment and monitoring progress, and a baseline of the current position against which to measure progress.
[image:25.595.109.484.483.704.2]Overall, more than half of the senior leaders (53 per cent) responded that they did not use alternative provision and most of the others (24 per cent) did so for regular, fixed days, alongside mainstream education. As Figure 5 shows, there were important differences between the practice reported by primary and secondary school leaders: whereas around three quarters (76 per cent) of primary school leaders did not make use of alternative provision, about a fifth (19 per cent) of secondary school leaders said they did not do so.
Figure 5 In what circumstances do you most commonly use alternative provision?
26
More than two-fifths (43 per cent) of secondary senior leaders used alternative provision for regular, fixed days, alongside mainstream education, while about a fifth (22 per cent) did so to provide education during fixed period exclusion. They also indicated that they directed pupils offsite for varying lengths of time in order to address behavioural issues: nearly a quarter (23 per cent) did so over one academic year, a fifth (20 per cent) did so over one term (but under one academic year) and a fifth (20 per cent) did so for more than two weeks (but less than half a term).
The small percentages of primary school leaders who said they used alternative
provision did so mainly for regular, fixed days, alongside mainstream education (11 per cent) and for education during fixed period exclusion (8 per cent).
More than half (54 per cent) of the secondary school leaders who used alternative
27
7. Pupil premium
The pupil premium was introduced in 2011 as a means of raising the attainment of disadvantaged pupils. Since its introduction, the eligibility criteria for the pupil premium have been extended and now include:
pupils who have been registered for free school meals at any point in the last six years
children looked after by a local authority for a day or more
children who have left care in England and Wales through adoption or via a Special Guardianship or Child Arrangements Order.
Schools are expected to use the funding to raise the attainment of disadvantaged pupils of all abilities so they can reach their potential. They are free to decide how the funding is spent, though the government has funded the Education Endowment Foundation to identify what works in raising the attainment of disadvantaged pupils and communicate this to schools. Use of the funding varies between schools, but includes building capacity, support for small group working, work to promote attendance and positive behaviour, and strengthening the feedback given to pupils.
While schools have considerable freedom in how they use the funding, they are held to account for its outcomes in terms of the attainment and progress of eligible pupils. Data relating to these outcomes are published in school performance tables, and are
emphasised in Ofsted inspections.
As part of the arrangements for implementing the pupil premium, schools are encouraged to commission external reviews of the way they use the funding, although these are not compulsory. When asked, nearly two-thirds of the school leaders (62 per cent) said they had not commissioned such a review but only a small number said they were not aware that they could do so. Furthermore, it is worth noting that a higher percentage of
28
8. Character education
The term character and resilience refers to attitudes and traits that have been found to be associated with academic success, employability and making a positive contribution to British society. Learning which helps to deliver character and resilience can be delivered through lessons in school, sports and extra-curricular activities. Policy innovations
[image:28.595.59.528.243.503.2]include: an expansion of the National Citizenship Service with an expectation that schools give the opportunity to all 16 and 17 year old pupils to take part; and to build evidence-based approaches that support the development of non-cognitive skills in school children.
Figure 6 How many extra-curricular activities does your school offer?
Source: Senior leaders; Teacher Voice Omnibus Survey November 2016 and Senior Leader booster November 2016
In order to measure what opportunities schools provide to develop character beyond the formal curriculum, school leaders were asked how many activities their schools offered in a range of areas. As Figure 6 shows four-fifths of schools (80 per cent) offered between one and five activities in arts, crafts and skills and 79 per cent provided homework, breakfast or after-school clubs. Nearly three quarters made provision for performing arts (72 per cent) and sport/outdoor activities (71 per cent) while around two thirds offered IT clubs (66 per cent), and academic subject related clubs (61 per cent). Far fewer offered awards and service activities (32 per cent) or volunteering (28 per cent).
29
academic subject-related clubs (68 per cent). More than half provided sport/outdoor activities (56 per cent), and volunteering (54 per cent).
A higher proportion of primary schools provided opportunities in arts, craft and skills (83 per cent), homework/breakfast clubs (80 per cent), and sport/outdoor activities (81 per cent). The percentage of primary schools who offered performing arts (70 per cent), ICT (59 per cent), and academic subject-related clubs (57 per cent) was lower than was the case for secondary schools. Only small numbers of primary schools offered opportunities for awards and services and volunteering.
The survey found that, taking primary and secondary schools together, almost a quarter (22 per cent) of schools reported that they did not offer ICT clubs and that performing arts were not offered as extra-curricular activities in 14 per cent of schools. This was most evident in primary schools, given that nearly a third (30 per cent) did not offer ICT, and a fifth (20 per cent) did not offer performing arts.
Few senior leaders said their schools offered any other types of extra-curricular activities. The most popular was gardening (noted by 5 respondents), together with modern
languages (5 respondents), and chess and other board games (6 respondents). Others said they offered family games or programmes, forest school clubs, faith activities,
30
9. Teacher supply
Nothing in schools matters more than good teachers. High-quality teachers are the single most important factor determining how well pupils do in school, and are great drivers of social mobility in our country. The Government believes that all pupils, regardless of birth or background, should have access to high quality teachers throughout England.
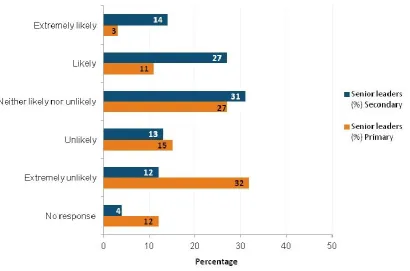
[image:30.595.71.460.384.640.2]Senior leaders were asked how likely they would be to attempt to recruit teachers from outside the UK if they had teacher supply issues in Science, Technology, Engineering and Mathematics (STEM) subjects, Modern Foreign Languages (MFL), and other subjects. As a whole respondents tended to say that they would be unlikely to do so, although just over a quarter recorded the answer ‘Neither likely nor unlikely’ in response to each of the questions, as can be seen in Figures 7 and 8 below. Slightly fewer than half (45 per cent) said they would be unlikely or extremely unlikely to recruit teachers from outside the UK to teach STEM subjects and nearly two-fifths (38 per cent) said so about MFL and for other subjects. However, a quarter (24 per cent) indicated they were likely or extremely likely to look outside the UK for MFL teachers.
Figure 7 If you had teacher supply issues in the following subjects, how likely would you be to attempt to recruit teachers from outside the UK? STEM
31
Figure 8 If you had teacher supply issues in the following subjects, how likely would you be to attempt to recruit teachers from outside the UK? Modern foreign languages
Source: Senior leaders; Teacher Voice Omnibus Survey November 2016 and Senior Leader booster November 2016
32
10. Tolerance and values of respect
There is a Prevent duty on schools to 'have regard to the need to prevent children and young people from being drawn into terrorism’. The Prevent duty advice (2015) states that this should be embedded as part of schools’ existing wider safeguarding duties, and advises on positively building the resilience of all children to radicalisation. Support, advice and resources for teachers, school leaders and parents is available on the website Educate Against Hate.
Classroom teachers were asked how confident they are in implementing the Prevent duty. Very few of the teachers who responded said they were not aware of this
[image:32.595.76.510.348.595.2]responsibility. As Figure 9 illustrates, nearly three-quarters (71 per cent) replied they were very confident or fairly confident meeting these requirements, while less than a tenth (9 per cent) said they were not very confident. The responses from teachers in primary and secondary schools were similar.
Figure 9 How confident are you in implementing the new duty on schools to 'have regard to the need to' prevent children and young people from being drawn into terrorism?
Source: Classroom teachers; Teacher Voice Omnibus Survey November 2016 and Senior Leader booster November 2016
33
34
11. Bullying
DfE has issued advice for head teachers, staff and governing bodies on tackling bullying in schools which can have a detrimental effect on pupils physically and emotionally. In September 2016, the Department for Education and the Government Equalities Office also announced £4.4m of funding to tackle bullying; this includes specific projects which target hate related bullying, including SEND and HBT bullying.
To inform future action and respond to commitments in the 2016 Hate Crime Action Plan and the Government’s response to the Women and Equalities Committee’s inquiry into sexual harassment and sexual violence in schools, the Department for Education and the Government Equalities Office are building their evidence base to better understand the scale of the problem in relation to the various types of bullying in schools.
[image:34.595.66.479.415.679.2]The survey asked senior leaders and classroom teachers whether they had witnessed or were aware of certain types of bullying during the previous year. As Figure 10 indicates, the responses suggest that most respondents had rarely or never seen any of these forms of bullying in the previous 12 months. However, there were a number of variations within this overarching message, which are discussed below Figure 10.
Figure 10 How often have you seen or received reports of any of the following types of bullying amongst pupils in the last 12 months?
35
Respondents indicated that overall there was some incidence of anti-Semitic bullying with 94 per cent responding that they rarely or never witnessed such behaviour and only 85 per cent saying they had never done so. There were few differences by type of school although the incidence of this type of behaviour was higher in secondary than primary schools. Likewise, most respondents (91 per cent) said that they had rarely or never witnessed anti-Muslim bullying although less than three quarters of respondents (72 per cent) said they had never witnessed it. A higher proportion of primary (95 per cent) than secondary school respondents (88 per cent) said that they had never or rarely seen anti-Muslim bullying. The data suggest that a higher proportion of classroom teachers than senior leaders had seen this form of bullying: whereas 94 per cent of senior leaders reported never or rarely seeing anti-Muslim bullying, the equivalent figure among classroom teachers was slightly lower (89 per cent).
These findings were echoed by respondents when asked whether they had seen other bullying based on religion. Most (92 per cent) indicated that they had rarely or never seen this form of bullying and nearly three-quarters (73 per cent) said they had never done so. However, the percentage of respondents in primary schools who said they had never witnessed this type of behaviour (83 per cent) was much higher than was the case
among secondary school respondents (61 per cent). There was also a slight difference in the responses of senior leaders and classroom teachers indicated by the fact that a higher percentage of senior leaders (75 per cent) than classroom teachers (70 per cent) said they had never seen such behaviour.
Most respondents (92 per cent) said they rarely or never saw instances of bullying based on disability in the previous twelve months and around two-thirds (64 per cent) said they had never seen it during that period. The percentage of primary school staff who said they never saw such behaviour during the previous year (71 per cent) was higher than that for secondary school respondents (57 per cent). A higher percentage of senior leaders (69 per cent) than classroom teachers (59 per cent) reported never seeing bullying based on disability in the last year.
Most respondents (91 per cent) said that they rarely or never encountered transphobic bullying and four-fifths (81 per cent) had never done so in the previous year. There were differences depending on whether the teachers worked in primary or secondary schools. The percentage of primary school respondents who said that they had never or rarely seen such behaviour (92 per cent) was higher than was the case for secondary school respondents (69 per cent). In addition the percentage of senior leaders who reported never seeing this behaviour (85 per cent) was higher than the percentage of classroom teachers (78 per cent).
There was slightly more evidence that respondents had witnessed some form of
36
never done so and 13 per cent indicated that they had seen it sometimes. The phase that respondents taught was a factor that influenced respondents’ perceptions given that nearly three times as many primary school staff (69 per cent) as compared to secondary school staff (23 per cent) reported that they had never seen this type of bullying in the previous year.
Although four-fifths (80 per cent) of respondents said that they had rarely or never seen instances of bullying based on race or nationality during the last year, less than a third (30 per cent) reported that they had never seen it during that period. The data also suggest that this form of bullying was more prevalent in secondary schools. Whereas more than four fifths (86 per cent) of primary school respondents said they rarely or never saw such behaviour, that was the view of less than three-quarters (73 per cent) of those in secondary schools.
Similarly, although nearly three-quarters (73 per cent) of all respondents said that they had rarely or never witnessed instances of sexist or sexual language used to degrade girls, a smaller proportion (42 per cent) responded that they had never done so during the last year and nearly a fifth (17 per cent) said they encountered it sometimes. The responses of primary and secondary school respondents differed in important respects. Whereas nearly two-thirds (61 per cent) of primary school respondents said they had never witnessed this form of bullying, the same was true of less than a fifth (19 per cent) of those in secondary schools. This difference is also reflected in the percentages who said they had ‘sometimes’ seen such behaviour. Less than one in ten of primary school respondents (8 per cent) said they had seen this ‘sometimes’ or ‘often’ but nearly two-fifths (38 per cent) of secondary school respondents had done so. A higher percentage of classroom teachers (29 per cent) than senior leaders (17 per cent) replied that they had seen the behaviour ‘sometimes’, ‘often’ or ‘very often’.
A similar pattern emerges when considering whether respondents had witnessed examples of boys touching girls inappropriately. Most (87 per cent) said they rarely or never saw this behaviour but far fewer (29 per cent) replied ‘never’ and 8 per cent
indicated it happened ‘sometimes’. Again instances of this type of bullying were higher in secondary than primary schools. The percentage of primary school respondents who said they rarely or never saw this kind of behaviour (92 per cent) was higher than that for secondary school respondents (81 per cent). This difference was wider in the
percentages saying they never saw such behaviour which were 67 per cent among primary school respondents and 48 per cent among those in secondary schools.
37
Figure 11 Percentage of respondents who replied they were very and fairly confident they would know what to do if they saw or heard of the following types of bullying occurring at their school
Source: Senior leaders and classroom teachers; Teacher Voice Omnibus Survey November 2016 and Senior Leader booster November 2016
Most respondents said they were very confident in dealing with bullying based on
disability (70 per cent) and a quarter (26 per cent) said they were fairly confident in doing so. Similar levels of confidence were expressed when respondents were asked about the two specific forms of bullying of girls: sexist or sexual language used to degrade girls and boys touching girls inappropriately.
While respondents were confident in dealing with homophobic or biphobic bullying, they were less confident in dealing with transphobic bullying:
most respondents said they were very confident in dealing with homophobic or biphobic bullying (62 per cent) and most others said they were fairly confident (30 per cent)
just over half of all respondents (55 per cent) said they would be very confident in dealing with transphobic bullying and most of the others said they were fairly confident (29 per cent).
In all cases a higher percentage of respondents in secondary schools than those in primary schools said they were very confident in dealing with the types of bullying noted in the survey. This was most apparent in relation to transphobic bullying given that nearly two-thirds of secondary school respondents (65 per cent) said they were very confident, less than half (47 per cent) of those in primary schools gave the same response and a tenth of primary respondents (10 per cent) said they were neither confident nor
unconfident. A much higher percentage of secondary school respondents than those in
38
primary schools said that they were very confident in dealing with homophobic bullying, anti-Muslim and anti-Semitic bullying, and other forms of bullying based on religion.
[image:38.595.84.509.220.472.2]As Figure 12 shows, there were also important differences in the perceptions of senior leaders and classroom teachers in relation to the different forms of bullying examined in the survey.
Figure 12 Percentage of classroom teachers and senior leaders who replied they were very confident they would know what to do if they saw or heard of the following types of bullying
occurring at their school
Source: Senior leaders and classroom teachers; Teacher Voice Omnibus Survey November 2016 and Senior Leader booster November 2016
39
12. Careers education, raising aspirations and
apprenticeships
One of the commitments of the recently published ‘Building our Industrial Strategy’ Green Paper was that the Government will publish a comprehensive careers strategy later this year. High quality careers provision on academic and technical routes, including
apprenticeships, is a key priority for this Government.
The careers strategy will aim to radically improve the quality and coverage of careers advice in schools and colleges, to make it easier for people to apply for technical education, and to give people the information they need to access training throughout their working lives.
This is part of a wider Government strategy to build a stronger, fairer Britain that works for everyone, not just the privileged few.
Careers education and guidance is delivered through a range of programmes and initiatives, with a key role given to The Careers & Enterprise Company, which has the remit to facilitate employers working with young people aged 12-18 to nurture their understanding of the qualifications and personal attributes they will need to succeed as adults and the opportunities available to them. This includes the provision of high quality, meaningful careers-related mentoring. In undertaking its work, The Careers & Enterprise Company bases its approach on the principles that what it does must be relevant to the young people’s needs, practical, with opportunities to learn by doing from an early age. In doing so, it encourages young people to raise their aspirations and think in the long term, not just about their next steps.
Respondents were asked how they classify the careers advice offer in their school. The majority of secondary senior leaders (94 per cent) and secondary classroom teachers (86 per cent) said that careers advice covered both academic and technical education
options including apprenticeships. A minority of secondary teachers (9 per cent) and senior leaders (4 per cent) reported that careers advice in their school covered academic options only.
Secondary senior leaders and classroom teachers were asked whether a series of statements applied to careers education in their school. Across all the statements secondary senior leaders were more positive than classroom teachers. A higher
percentage of senior leaders considered that the statements applied to their school than was the case for subject teachers. Figure 13 shows that a majority of secondary senior leaders (89 per cent) and classroom teachers (70 per cent) said that their school has an identified lead individual with responsibility for overseeing the institution’s careers
40
[image:40.595.61.502.149.444.2]A larger percentage of senior leaders (59 per cent) than classroom teachers (35 per cent) agreed with the statement that by age 14 pupils have accessed and used information about career paths and the labour market to inform their own decisions on study options.
Figure 13 Statements that apply to careers education in your school
Source: Senior leaders and classroom teachers; Teacher Voice Omnibus Survey November 2016 and Senior Leader booster November 2016
Just under one-third of secondary senior leaders and classroom teachers agreed with the statements that on leaving school all students who are considering applying for university have had at least two visits to universities to meet staff and students (secondary senior leaders 31 per cent and classroom teachers 29 per cent). Thirty per cent of secondary senior leaders and 22 per cent of classroom teachers agreed with the statement that on leaving school all pupils have had direct experience of the workplace on at least one occasion each year.
41
67 per cent of senior leaders and 24 per cent of teachers used destinations data 59 per cent of senior leaders and 35 per cent of teachers used the National
Careers Service
40 per cent of senior leaders and 16 per cent of teachers used the Careers and Enterprise Company
19 per cent of senior leaders and 7 per cent of teachers used the government published performance tables.
Secondary senior leaders said they offered careers-related mentoring to: pupils in certain year groups only (33 per cent); pupils most at risk of under-achieving or dropping out (20 per cent); pupils from the most disadvantaged backgrounds (19 per cent); all pupils (16 per cent). Smaller proportions of secondary senior leaders reported that they offered careers-related mentoring to pupils with SEN (7 per cent) and female pupils in STEM subjects (6 per cent). About two-fifths (41 per cent) said they did not offer careers-related mentoring.
The Secretary of State has made clear in a recent speech the importance of high
aspirations for all pupils as part of the government’s commitment to a country that works for everyone. More broadly, the Secretary of State has signalled her determination (here) to improve social mobility through education, which means levelling up opportunity for the most disadvantaged pupils, and those who are just about managing, to ensure that all young people can fulfil their potential across every life phase. This will require
generational change through tackling geographic disadvantage, investing in long-term system capacity and making sure the education system prepares young people and adults for career success.
42
Figure 14 In general, how would you describe the aspirations of pupils in your school?
Source: Senior leaders and classroom teachers; Teacher Voice Omnibus Survey November 2016 and Senior Leader booster November 2016
Overall, more respondents described the aspirations of the pupils in their school as ‘very high’ or ‘high’ rather than ‘low’ or ‘very low’. For example, 48 per cent of primary
respondents described pupils’ aspirations as ‘very high’ and ‘high’, while 16 per cent described them as ‘very low’ and ‘low’. The corresponding figures for secondary
respondents were 45 per cent and 19 per cent. Just over a third (36 per cent) of primary and secondary respondents described the aspirations of their pupils as ‘average’.
43
[image:43.595.81.521.107.414.2]Respondents were asked about the barriers their school faces in raising pupils’ aspirations. The survey results are presented in Figures 15 and 16.
Figure 15 Three most significant barriers your school faces in raising aspirations – Primary
Source: Senior leaders and classroom teachers; Teacher Voice Omnibus Survey November 2016 and Senior Leader booster November 2016
While a minority of primary respondents believed that they do not face any barriers to raising aspirations (6 per cent of senior leaders and 7 per cent of classroom teachers), Figure 15 shows that approximately two-thirds of primary respondents (66 per cent of senior leaders and 61 per cent of classroom teachers) felt that lack of support from parents was one of the most significant barriers their school faces in raising the
aspirations of its pupils. The second most frequently cited barrier was pupils’ lack of self confidence (42 per cent of senior leaders and 36 per cent of teachers). Approximately one quarter of senior leaders believed that pupils' wider skills (e.g. character) were a most significant barrier (23 per cent of senior leaders in contrast to 20 per cent of teachers); whereas classroom teachers said pupils' lack of motivation was a most significant barrier (28 per cent of teachers in contrast to 22 per cent of senior leaders). Other frequently cited significant barriers to raising aspirations included:
lack of time for staff to engage with individual pupils (18 per cent of senior leaders and 26 per cent of teachers)