Whole Lung Morphometry with 3D Multiple b-Value
Hyperpolarized Gas MRI and Compressed Sensing
Ho-Fung Chan,
1Neil J. Stewart,
1Juan Parra-Robles,
1Guilhem J. Collier,
1and
Jim M. Wild
1,2*
Purpose: To demonstrate three-dimensional (3D) multiple b-value diffusion-weighted (DW) MRI of hyperpolarized3He gas
for whole lung morphometry with compressed sensing (CS). Methods: A fully-sampled, two b-value, 3D hyperpolarized
3He DW-MRI dataset was acquired from the lungs of a healthy
volunteer and retrospectively undersampled in the ky and kz phase-encoding directions for CS simulations. Optimal k-space undersampling patterns were determined by minimizing the mean absolute error between reconstructed and fully-sampled3He apparent diffusion coefficient (ADC) maps.
Pro-spective three-fold, undersampled, 3D multiple b-value 3He
DW-MRI datasets were acquired from five healthy volunteers and one chronic obstructive pulmonary disease (COPD) patient, and the mean values of maps of ADC and mean alve-olar dimension (LmD) were validated against two-dimensional (2D) and 3D fully-sampled3He DW-MRI experiments.
Results: Reconstructed undersampled datasets showed no visual artifacts and good preservation of the main image fea-tures and quantitative information. A good agreement between fully-sampled and prospective undersampled datasets was found, with a mean difference ofþ3.4% andþ5.1% observed in mean global ADC andLmDvalues, respectively. These dif-ferences were within the standard deviation range and consist-ent with values reported from healthy and COPD lungs. Conclusions: Accelerated CS acquisition has facilitated 3D multiple b-value 3He DW-MRI scans in a single breath-hold,
enabling whole lung morphometry mapping. Magn Reson Med 000:000–000, 2016.VC 2016 The Authors Magnetic Res-onance in Medicine published by Wiley Periodicals, Inc. on behalf of International Society for Magnetic Resonance in Medicine. This is an open access article under the terms of the Creative Commons Attribution License, which per-mits use, distribution and reproduction in any medium, provided the original work is properly cited.
Key words: hyperpolarized 3He; compressed sensing; lung morphometry; stretched exponential model; ADC mapping
INTRODUCTION
Diffusion-weighted MRI (DW-MRI) with hyperpolarized (HP) noble gases is sensitive to changes in lung microstruc-ture through the measurement of the apparent diffusion coefficient (ADC) of the gas in the alveoli (1–3). However, the measured ADC value can be influenced by non-Gaussian phase behavior of the DW signal of the gas in the lungs, causing non-mono-exponential signal attenuation with increasingb-value. This behavior is determined by the specific diffusion regime, which is influenced by sev-eral factors including the DW measurement parameters, gas diffusivity, and the complex alveolar structure (4). Var-ious models of gas diffusion in the lungs have been pro-posed to address this non-Gaussian signal behavior, and provide estimates of lung alveolar length scales from the HP gas signal. These include cylindrical geometrical mod-els (5,6), q-space transforms (7), and more recently, stretched exponential models (8). All of these approaches have a common requirement for the acquisition of multiple
b-value DW-MRI data, to sample the non-mono-exponential diffusion signal. However, multiple b-value acquisition in a single breath-hold requires long scan times, and multi-slice two-dimensional (2D) sequences have been used to date, which do not provide whole lung volumetric coverage for lung morphometry.
Previously used 2D3He DW-MRI sequences permitted acquisition of approximately five slices with four to six
b-values in a single breath-hold (15 s) (8,9). Three-dimensional (3D) DW-MRI sequences designed with a similar slice thickness (10–15 mm) and the same num-ber of b-values would require an acquisition time of almost 1 min to obtain whole lung coverage images, which is beyond the limits of a tolerable breath-hold. Acquisition methods such as radial (10), spiral (11), and parallel radiofrequency (RF) encoding (12) have been previously applied to HP 3He lung MRI to decrease image acquisition time. However, these techniques require the use of non-Cartesian gradient trajectories or custom-built multichannel RF coils. Compressed sensing (CS) presents an alternative acceleration technique that can be used to reduce the total scan time to within the limits of a breath-hold by exploiting the sparsity (or com-pressibility) of lung MR images to acquire a randomly undersampled k-space (13).
The feasibility of acquisition and reconstruction of HP 3He lung MR images with CS was first investigated by
retrospectively undersampling and reconstructing fully-sampled 2D and 3D ventilation images (14). These initial results showed that reductions in scan time could be achieved in 2D and 3D3He ventilation imaging without compromising image quality and functional information. 1
POLARIS, Academic Unit of Radiology, University of Sheffield, United Kingdom.
2
Insigneo, Institute forin silicomedicine, Sheffield, United Kingdom.
*Correspondence to: Jim M. Wild, PhD, Academic Unit of Radiology, Uni-versity of Sheffield, C Floor, Royal Hallamshire Hospital, Glossop Road, Sheffield, S10 2JF, United Kingdom. Telephone: 144 114 2159141; E-mail: [email protected].
Funding: NIHR – RP-R3-12-027; MRC (MR/M008894/1); EU FP7 AirPROM; University of Sheffield PhD Scholarship.
Received 22 December 2015; revised 15 April 2016; accepted 26 April 2016
DOI 10.1002/mrm.26279
Published online 00 Month 2016 in Wiley Online Library (wileyonlinelibrary. com).
VC 2016 The Authors Magnetic Resonance in Medicine published by Wiley
Periodicals, Inc. on behalf of International Society for Magnetic Resonance in Medicine. This is an open access article under the terms of the Creative Commons Attribution License, which permits use, distribution and reproduction in any medium, provided the original work is properly cited.
Magnetic Resonance in Medicine 00:00–00 (2016)
In the same work, prospective undersampled 2D 3He DW-MRI data acquired with CS demonstrated preserva-tion of spatial resolupreserva-tion and mean ADC values com-pared with fully-sampled data. Further recent studies with HP gases have incorporated CS to acquire 3He-1H images in the same breath-hold (15,16), multi-interleaved 2D 3He MRI data for functional and structural mapping including ADC, T
2, and B1(17), and also to measure gas flow in the upper airways with phase contrast velocime-try (18).
In this work, CS was implemented to reduce scan time and facilitate 3D multiple b-value HP 3He DW-MRI within a single breath-hold. Simulations were first per-formed to investigate the feasibility of 3D 3He multiple
b-value DW-MRI with CS undersampling, and recon-structed images were evaluated to ensure that quantita-tive microstructural information was preserved. Prospective 3D3He multipleb-value DW-MRI data were subsequently acquired in five healthy volunteers and one chronic obstructive pulmonary disease (COPD) patient. The data were used to calculate maps of ADC values (generated from a 2 b-value exponential fit) and mean diffusion length scale (LmD) estimates (from a
mul-tipleb-value stretched exponential treatment), and these were compared with values obtained from fully-sampled 3D and 2D multipleb-value DW-MRI.
THEORY
Compressed Sensing
CS allows images to be reconstructed from data that do not fulfill the Nyquist sampling criteria. In this work, images were reconstructed by solving Eq. 1 using a non-linear conjugate gradient descent algorithm with back-tracking line search (13):
argmin m
fjjFumyjj2 2þl
1jjcmjj1þl2TVðmÞg [1]
wherem is the reconstructed image,c is the sparsifying transformation, Fu is the undersampled Fourier trans-form, y is the acquired undersampled k-space data, TV
represents the sum of the absolute variations in the image, andl1 and l2 are the penalty weighting
parame-ters that balance data fidelity and artifact reduction. In this work, no sparsifying transformations were used in the CS simulations, because 3D HP3He lung MR images are naturally sparse and reconstructed data from the sim-ulations were found to be equivalently accurate with and without sparsifying transformations.
Stretched Exponential Model
Within a 3He MR lung imaging voxel, the diffusion of gas atoms is restricted by the walls of airways with dif-ferent sizes and orientations with respect to the diffusion sensitizing gradient (4). These different diffusion regimes result in differences of apparent diffusion rates, which are not fully compensated by motional averaging for the typical diffusion times used for short-range3He diffusion measurements (19). This heterogeneity of the apparent diffusivity is further increased by localized diffusion effects induced by large gradients (20), as well as effects
related to the airway connectivity (eg, branching (19)) and background susceptibility gradients (9). Hence, the measured macroscopic voxel signal can be represented as the superposition of signals with different apparent diffusivitiesDusing Eq. 2:
Sb
S0¼
ZD0
0
pðDÞebDdD [2]
whereS0 is the signal whenb¼0,Sb is the signal corre-sponding to a nonzerob-value, andD0 is the free diffu-sion coefficient of 3He in air or N
2. The probability density function p(D) for each voxel can be estimated from the diffusion signal using different approaches (21). The approach employed in this work (see Eqs. 37 and 38 in (21)) uses the knowledge that the diffusion MR signal decay of 3He in lungs can be well described by a stretched exponential function (8) to obtain a numerical expression forp(D). The distribution of diffusion length scales LD5 (2DD)
1=2 (ie, root mean squared
displace-ments, in whichDis the diffusion time) associated with theDvalues can then be calculated for each voxel. The
p(LD) distributions are a measure of the distribution of
microscopic dimensions of the airways (ie, the diffusion-restricting boundaries) contained within a given voxel. These distributions can be used to calculate the mean diffusion length scale (LmD) for each pixel. LmD values
can therefore provide quantitative estimates of the mean acinar airway dimensions within a voxel.
METHODS
CS Simulations
All CS simulations and subsequent mean absolute error (MAE), ADC, and LmD calculations were implemented
in-house using MATLAB (The Mathworks, Natick, Mas-sachusetts) software. All in vivo MRI experiments were performed under the approval of the UK national research ethics committee.
Fully-sampled 3D DW HP 3He lung MR images were acquired from the lungs of a healthy male volunteer (30 years old) in a 22 s breath-hold on a GE HDx 1.5 Tesla (T) MR scanner (GE Healthcare, Milwaukee, WI) using a 3D spoiled gradient echo (SPGR) sequence based on that described in (22). A flexible quadrature transmit-receive RF coil (Clinical MR Solutions, Brookfield, Wisconsin), tuned to the Larmor frequency of3He (48.63 MHz), was used with a gas dosage of 300 mL of HP 3He (25% polarization), mixed with 700 mL of N2. The lung infla-tion level at imaging had a funcinfla-tional residual capacity plus 1 L (FRCþ1L). Images were acquired with sequential phase encoding and the following acquisition parame-ters: 2 DW interleaves (b¼0, 1.6 s/cm2), 96 78 24 matrix, field of view (FOV): 4032.5 28.8 cm3, effec-tive slice thickness: 12 mm, echo time (TE)/repetition time (TR): 4.2/5.7 ms, diffusion time¼1.6 ms (DW gradi-ent strength¼14.1 mT/m, ramp¼0.3 ms, plateau¼1.0 ms), flip angle¼1.5 (hard RF pulse of 0.24 ms
magnetization remained at the end of the acquisition as a result of RF pulse depolarization.
From the fully-sampled 3D image data, random k-space undersampling patterns were generated in the two orthog-onal phase-encoding directions for acceleration factors (AF) ranging from 2 to 5. A Monte Carlo–based algorithm was used with variable density to maximize the incoher-ence. For each AF, four different k-space sampling pat-terns were generated with different probability density functions. Each of these patterns was used to retrospec-tively undersample the full k-space dataset, and the corre-sponding images were reconstructed as follows.
Reconstructions based on Eq. 1 were optimized by minimizing the MAE between the fully-sampled ADC maps and the CS-reconstructed ADC maps (MAEADC). The quality of each reconstruction was evaluated using both the MAEADC and the MAE between the original fully-sampled magnitude image (b¼0) and the CS-reconstructed magnitude image (MAEMAG). For the ulti-mate goal of quantitative lung microstructural analysis, the MAEMAG, MAEADC, and ADC maps were evaluated on a pixel-by-pixel basis within a region of interest (ROI) representing the lungs. MAEMAG was calculated using Eq. 3 as follows:
MAEMAG¼ XN
i¼1
XM
j¼1jCSi;jFulli;jj
NM [3]
where CSi;j and Fulli;j denote the normalized pixel val-ues in the CS-reconstructed and original fully-sampled images, respectively; and NM is the total number of pixels in the lung ROI. ADC maps were computed using a pixel-by-pixel mono-exponential fit of signal intensities in the two interleaves of the 3D3He DW-MRI dataset, as in Eq. 4:
ADC¼ lnðS0=SbÞ
b [4]
An asymmetric cutoff of negative (ADC<0) or physically too high (ADC>D0¼0.88 cm2/s) values was applied dur-ing the creation of the ADC maps. MAEADC was calcu-lated using a similar approach to MAEMAG, as in Eq. 5
MAEADC¼ PN
i¼1
PM
j¼1jCS ADCi;jFull ADCi;jj
NM [5]
except that here CS ADCi;j and Full ADCi;j refer to the pixel values of the ADC maps in the CS-reconstructed and the original fully-sampled cases, respectively, as cal-culated from Eq. 4. Whole lung ADC histograms were generated for each AF, and skewness and full width at half maximum (FWHM) values were derived from each ADC histogram. Skewness of ADC values was calculated using Eq. 6,
Skew¼EðxmÞ
3
s3 [6]
where m is the mean of the ADC values (x), s is the standard deviation, andEis the expectation operator.
Prospective CS Acquisition of 3D3He DW-MRI
Prospective CS datasets with four DW interleaves were acquired in five healthy volunteers and one COPD patient (spirometric forced expiratory volume in 1 s, FEV1¼ 31.2% predicted) using the optimal undersampling pattern that was derived from CS simulations with AF¼3. Three-fold undersampling was chosen because it was the highest AF achievable without introducing significant image blur-ring, and allowed a scan time reduction from 45 to 15 s, which is a tolerable breath-hold for most clinical subjects. The 3D CS multipleb-value DW-MRI dataset was acquired with the following imaging parameters: gas dosage: 300 mL 3He mixed with 700 mL N
2, lung inflation state: FRCþ1L, 4 DW interleaves (b¼0, 1.6, 4.2, 7.2 s/cm2), 96 7824 matrix, FOV: 40 32.5 28.8 cm3, effective slice thick-ness: 12 mm, TE/TR: 4.2/6.0 ms, diffusion time¼1.6 ms (maximum DW gradient strength¼30 mT/m, ramp¼0.3 ms, plateau¼1.0 ms), flip angle¼1.9 (hard RF pulse as
previously), bandwidth¼631.25 kHz. ADC maps were cal-culated from the first two interleaves, whereas LmD maps
were derived from all four interleaves using the stretched exponential methodology.
Prospective CS Acquisition Validation
To validate the ADC and LmD microstructural
measure-ments derived from prospective 3D CS data, the same five healthy volunteers were imaged with fully-sampled 3D and 2D 3He DW-MRI using the scan parameters detailed in the “CS Simulations” section and this sec-tion, respectively. 3D fully-sampled data were also acquired from the COPD patient; however, 2D fully-sampled data were not acquired because of patient time constraints. The selection of b-values used in all scans was consistent and chosen to ensure that one of the diffusion interleaves corresponded to b¼1.6 s/cm2, the
b-value most commonly used for 3He ADC calculations in the literature (1,3,23,24).
2D multiple b-value DW-MRI data were acquired with similar FOV and slice thickness as the corresponding 3D datasets. Six slices were acquired with 12 mm thickness and 12 mm gap, using a gas dosage of 300 mL3He (mixed with 700 mL N2) at a lung inflation state of FRCþ1L. Addi-tional imaging parameters were as follows: four DW inter-leaves (b¼0, 1.6, 4.2, 7.2 s/cm2), 96 72 in-plane matrix, in-plane FOV: 40 30 cm2, TE/TR: 4.9/10 ms, diffusion time¼1.6 ms (maximum DW gradient strength¼30 mT/m, ramp¼0.3 ms, plateau¼1.0 ms), flip angle¼5 (sinc RF
pulse), bandwidth¼631.25 kHz.
Comparisons of ADC and LmD values were made
between each corresponding dataset acquired from each subject; ADC values (from a two b-value, 0 and 1.6 s/ cm2, mono-exponential fit) were compared between 3D fully-sampled and 3D CS acquisitions, whereasLmD
RESULTS
CS Simulations
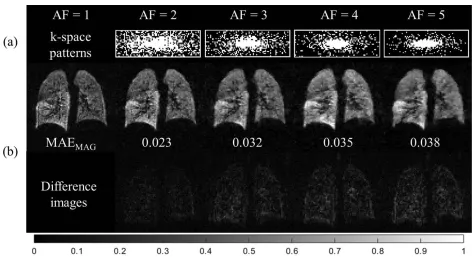
CS simulations performed on the fully-sampled two interleaved 3D 3He DW-MRI dataset led to optimal sam-pling patterns and penalty weight parameters for each AF. The optimal sampling patterns for each AF resulting from the CS simulations are summarized in Figure 1a. An increase in MAEMAG was observed with increasing AF; however, this error (with a maximum value of 3.8% at AF¼5) did not manifest in the appearance of image artifacts. Reconstructed (b¼0) images for AFs of 2 and 3 showed good preservation of image details when com-pared with the fully-sampled (AF¼1) image (examples shown in Fig. 1b). At AFs of 4 and 5, a loss in image detail was observed as a result of increased blurring resulting from heavier undersampling of high-frequency k-space components.
ADC maps were computed for each reconstructed 3D 3He CS dataset and compared with the 3D fully-sampled
ADC maps. CS simulation ADC results are summarized in Table 1 and Figure 2. MAEADCexhibited a similar trend to MAEMAG, ie, increasing undersampling resulted in larger error values. The skewness of the whole lung ADC histo-grams increased with AF; skewness¼1.08 at AF¼1 and 2.14 at AF¼5, respectively. The opposite trend was observed with the FWHM of the histogram, which decreased at higher AFs: FWHM¼0.141 cm2/s at AF¼1 and 0.118 cm2/s at AF¼5. In addition, a slight increase in global ADC values was observed with increasing AF, reflecting the increase in MAEADC. The maximum differ-ence in global ADC value between CS and fully-sampled acquisitions was 4% at AF¼5. Despite the slight increase in global ADC values, single-slice ADC maps and whole
lung ADC histograms for each AF (see Figs. 2a and 2b) appeared to be visually similar, indicating good preserva-tion of quantitative lung microstructural informapreserva-tion.
Prospective CS Acquisition of 3D3He DW-MRI
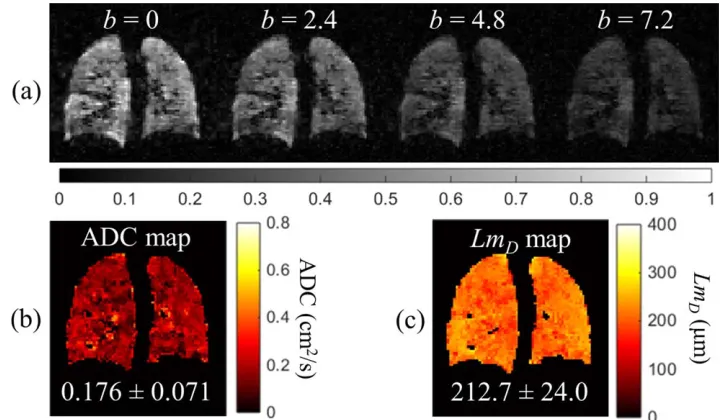
[image:4.612.69.545.70.327.2]The four-interleaved 3D 3He DW-MRI dataset acquired from the same healthy volunteer as previously was reconstructed from the three-fold undersampled k-space using the optimal reconstruction parameters of the corre-sponding undersampling pattern, as determined from CS simulations. Results are summarized in Figures 3 and 4, and Table 2, and described subsequently. A decrease in signal intensity with increasing b-value was observed, corresponding to the increased signal dephasing in the presence of larger diffusion gradients (Fig. 3a). The first two interleaves (b¼0 and 1.6 s/cm2) were used to calcu-late an ADC map (Fig. 3b), which resulted in a mean global (whole lung) ADC value of 0.19860.082 cm2/s. All four interleaves of this prospective dataset were then used to generate a LmD map from the stretched
FIG. 1. Results from 3D3He CS simulations. (a) Optimal variable-density k-space undersampling patterns (78
[image:4.612.314.553.666.732.2]24 pixels) for each AF determined from CS simulations. (b) Example reconstructed magnitude (b¼0) and difference images for each AF, with corresponding MAEMAGvalues.
Table 1
Summary of Global ADC Values and Whole Lung ADC Histogram Results From 3D3He CS Simulations
AF ADCGlobal(cm 2
/s) Skewness FWHM (cm2/s)
1a 0.19860.085 1.08 0.141
2 0.20360.094 1.79 0.127
3 0.20260.091 1.95 0.123
4 0.20460.093 2.12 0.120
5 0.20660.094 2.14 0.118
ADCGlobal, global ADC; FWHM, full width at half maximum a
exponential model (Fig. 3c), which resulted in a mean globalLmDvalue of 222.8625.3mm.
The resulting global and representative slice mean ADC and LmD values for this healthy volunteer
calcu-lated from 3D CS, 3D sampled, and 2D fully-sampled acquisitions are summarized in Table 2. Derived 3D fully-sampled and 3D CS global ADC values were identical, with a comparable standard deviation, whereas a difference of 6.8% was observed in the global LmD
value between the 3D CS and the 2D fully-sampled datasets. In the chosen example slices, a difference in mean ADC of 5.9% between 3D CS and 3D fully-sampled datasets was observed, as illustrated in Figure 4. For mean LmD, the difference was 2.8% between 3D CS and 2D fully-sampled datasets.
Prospective CS Acquisition Validation
A summary of global mean ADC andLmD values for all
subjects imaged (five healthy volunteers and one COPD patient) is presented in Table 3. For every subject, the global mean ADC value derived from the 3D CS acquisi-tion was equal to or higher than the value obtained from the corresponding 3D fully-sampled acquisition. The dif-ference in ADC values between the fully-sampled and CS datasets ranged from 0.0 to 5.9% with a mean differ-ence of 3.4%. Global LmD values exhibited a similar
increase in 3D CS acquisitions, and a slightly higher mean difference of 5.1% was observed.
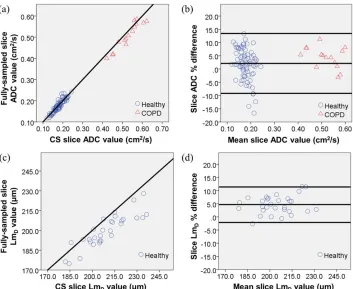
[image:5.612.72.547.74.310.2]A scatter plot of single-slice ADC values calculated from 3D fully-sampled and 3D CS datasets (Fig. 5a) shows a good correlation (P<0.001, r¼0.995). Two clusters of FIG. 2. ADC results from 3D3He CS simulations. (a) ADC maps for an example slice at each AF, with corresponding MAEADCvalues. (b)
Whole lung ADC histograms for each AF.
FIG. 3. Prospective 3D 3He
DW-MRI CS acquisition from a healthy volunteer with three-fold under-sampling and four diffusion inter-leaves at b-values of 0, 1.6, 4.2, and 7.2 s/cm2 (15 s breath-hold).
[image:5.612.193.554.543.753.2]data points were observed, corresponding to the healthy and COPD patient groups. The agreement between the two measurements was confirmed by Bland-Altman anal-ysis (Fig. 5b). The mean slice-by-slice ADC percentage difference between methods wasþ2.1% (absolute differ-ence of 0.005 cm2/s), and 95% of the difference was within9.2% toþ13.4% (0.024 to 0.034 cm2/s). Similar levels of agreement in the LmD value between methods
were observed, as illustrated in the equivalent scatter and Bland-Altman plots (Figs. 5c and 5d). The meanLmD
per-centage difference of þ4.7% (absolute difference of 9.29mm) was larger than the mean ADC percentage differ-ence, and 95% of the difference was within 2.1% to þ11.4% (4.65 to 23.23mm).
DISCUSSION
CS Simulations
CS has enabled the acquisition of 3D multiple b-value DW lung images with HP3He in a single breath-hold, for the purpose of diffusion modeling of lung microstructure using a stretched exponential approach. CS simulations performed on a fully-sampled twob-value 3D 3He DW-MRI dataset led to optimal sampling patterns and pen-alty weight parameters for different AFs (between 2 and 5). The slight increase in mean ADC value observed with retrospective undersampling was within the range of
healthy lung ADC values (0.20 cm2/s) at b¼1.6 s/cm2 found in previous studies (2,3,24).
Skewness of the ADC histogram was observed to increase with AF. The increase in skewness and mean ADC can both be explained by the increase in mean abso-lute error (MAEMAGand MAEADC) with increased under-sampling. With CS, some information loss is inevitable from the undersampling of k-space, which increases errors and creates a noise-like artifact in the magnitude images. The slight increase in MAEADCresults in a few physiologi-cally unrealistic low and high ADC values in some pixels. Examples can be observed in the single-slice ADC maps at AFs of 2–5 in Figure 2a. An asymmetric cutoff of negative (ADC<0), or physically too high (ADC>D0¼0.88) values is applied during the creation of the ADC maps; however, some of the uncut artificially high pixel values still influ-ence the mean and skewness of the histogram. If the whole histogram is considered (ie, no cutoff of lower and higher ADC limits is applied), the change in skewness of the ADC histogram between AFs is much lower and the maxi-mum difference in global ADC value becomes only 1.3%, compared with the 4% difference calculated when the asymmetric cutoff is applied.
ADC histograms also appear narrower at larger AFs because of the smaller FWHM values observed with increased undersampling. This trend can be explained by the properties of CS reconstruction, in that denoising and thresholding is used to remove undersampling noise artifacts introduced by undersampling (13). Narrower ADC histograms from increasingly undersampled 2D3He ADC data were also observed previously in (14). The standard deviation values of the global and slice ADC values from reconstructed CS datasets were larger than the corresponding fully-sampled values; a trend opposite to that reported by Ajraoui et al (14). This difference is likely the result of pixels with high ADC value being introduced from increased MAEADC, causing a larger standard deviation of ADC values. The decrease in FWHM value observed with increased undersampling more accurately reflects the denoising and smoothing of the CS reconstruction process.
In this work, CS simulations were optimized by mini-mizing MAEADC, whereas in previous work, only
MAE-MAGwas minimized for 2D ADC mapping with3He (14). Here, the ADC values obtained from simulations opti-mized with minimum MAEADC were found to be more comparable with fully-sampled datasets than those opti-mized using the minimum MAEMAG method. The opti-mal penalty weight parameters (l1 and l2) for
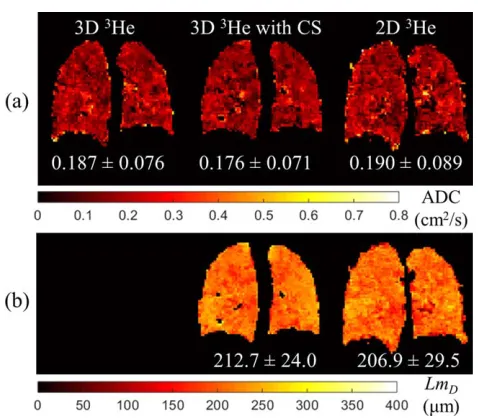
[image:6.612.61.300.69.278.2]simulations with minimum MAEADC were also found to be smaller than those resulting from MAEMAG FIG. 4. Comparison of 3D and 2D 3He ADC andLm
D maps. (a) Same representative slice ADC map for each of the three imaging methods (3D fully-sampled, 3D with CS, and 2D fully-sampled). (b) CorrespondingLmDmaps for 3D with CS and 2D acquisitions.
Table 2
Summary of Global and Representative Slice Mean ADC andLmDValues Acquired From a Single Healthy Volunteer
Imaging method
b-value¼[0, 1.6 s/cm2] b-value
¼[0, 1.6, 4.2, 7.2 s/cm2]
Slice ADC mean (cm2/s)
Global ADC mean (cm2/s)
SliceLmD mean (mm)
GlobalLmD mean (mm)
3D full k-space 0.18760.076 0.19860.085 —a —a
3D CS 0.17660.071 0.19860.082 212.7624.0 222.8625.3
2D full k-space 0.19060.089 0.19460.090 206.9629.5 208.6629.8
a
[image:6.612.59.553.673.743.2]simulations. Considering the nonlinear CS reconstruction algorithm in Eq. 1, this finding indicates that the recon-structed images with minimum MAEADC have less total variation and sparsity when compared with images reconstructed with minimum MAEMAG, implying that data consistency needs to be better maintained during the reconstruction process, leading to improved preser-vation of quantitative lung microstructural information.
As expected, MAEMAGincreased with AF in CS simu-lations, which was manifested as a blurring in image detail due to a reduction in sampling of high-frequency k-space components at higher AFs. These blurring effects are an intrinsic result of the variable density k-space sampling patterns used in the CS simulations. Because
most of the information in HP gas lung images arises from low-frequency k-space components, a probability density function is used to sample the center of k-space more heavily than the periphery. In this work, the increasingly lower sampling density of high-frequency components with increasing AF prevented the use of AFs of 4 and 5 for 3D 3He lung MRI acquisitions, because the associated loss of spatial resolution of the reconstructed images was considerable.
Prospective CS Acquisition of 3D DW-MRI
[image:7.612.62.555.105.251.2]A prospective three-fold undersampled 3D3He DW-MRI dataset was acquired in one healthy volunteer using an Table 3
Global ADC andLmDValues Calculated From Fully-Sampled and CS Acquisitions for the Five Healthy Volunteers and One COPD Patient
Subject
Imaging method
b-value¼[0, 1.6 s/cm2] ADC % difference
Multipleb-values LmD% difference global ADC (cm2/s) globalLmD(mm)
Healthy 1 Fully-sampled 0.19860.085 0.0% 208.6629.8 6.8%
3D CS 0.19860.082 222.8625.3
Healthy 2 Fully-sampled 0.16360.082 4.3% 192.6627.0 6.0%
3D CS 0.17060.077 204.1623.2
Healthy 3 Fully-sampled 0.15260.083 5.9% 184.5631.0 8.3%
3D CS 0.16160.069 199.8627.0
Healthy 4 Fully-sampled 0.16360.068 1.8% 197.5624.2 3.6%
3D CS 0.16660.067 204.6623.6
Healthy 5 Fully-sampled 0.16960.081 5.9% 207.5624.6 0.7%
3D CS 0.17960.078 209.0629.1
COPD 1 Fully-sampled 0.52560.169 2.7% —
a
—
3D CS 0.53960.186 313.6656.1
a2D fully-sampled DW-MRI was not acquired from the COPD patient as a result of time constraints.
[image:7.612.200.553.460.749.2]optimized undersampling pattern, and quantitative meas-ures of lung microstructure were compared with 2D fully-sampled and 3D DW-MRI datasets. An excellent ADC agreement was observed between 3D fully-sampled and 3D CS datasets, whereas a difference of 6.8% was observed in the globalLmDvalue between the 3D CS and
2D fully-sampled datasets. This global LmD difference
was within the standard deviation range of the global mean value, and LmD values were similar to reported
mean linear intercept values obtained from healthy human lung histology samples (200mm) (25). In the chosen example slices, the observed mismatch between the CS and fully-sampled ADC andLmDvalues could be
explained by slight differences in subject position or lung inflation level between the separate scans, which could cause the example slices to be representative of a slightly different region of the lungs (Fig. 4).
A small positive bias in global mean ADC and LmD
value was observed between 3D CS and fully-sampled 2D and 3D datasets acquired from the five healthy volun-teers and one COPD patient, which could be attributed to the increase in MAEADC as a result of undersampling. However, these values were within the standard devia-tion range, consistent with reported healthy and COPD lung ADC values (2,3,24) and similar to mean linear intercept values obtained from human lung histology samples (200mm in healthy, 400mm in COPD) (25). In a slice-by-slice comparison of fully-sampled and CS-derived ADC and LmD values, good agreement was
found, close to the line of equality. In the quantitative comparisons of both ADC and LmD, 95% of the
differ-ence between fully-sampled and CS datasets was well within the standard deviation range of mean values. From the CS simulations (where, unlike the fully-sampled acquisitions, there is intrinsically no variability because of scans being performed in a separate breath), a 2% ADC mismatch was observed between the fully-sampled and three-fold underfully-sampled CS reconstruction, which can be attributed to CS reconstruction error.
Despite the observation of a small positive bias in CS-derived ADC and LmD values, the biases are negligible
when compared with the large differences in lung micro-structure between healthy and COPD subjects; ADC and
mean linear intercept length values of emphysema sub-jects vary depending on disease severity, but are typically 2–2.5 times larger than those of healthy subjects (2,25). Thus, our results indicate that 3D multiple b-value 3He DW-MRI with CS has potential to be used clinically to track changes in lung microstructure associated with emphysematous disease. The 3D multiple b-value data affords the possibility of calculatingLmDacross the entire
lung volume from the stretched exponential model, allow-ing for volumetric lung microstructural estimates. The 3D multiple b-value acquisition strategy proposed here is fully compatible with the stretched exponential model, and also alternative diffusion analyses and morphometric models, such as the “cylinder model” (5,6) or q-space transform analysis (7).
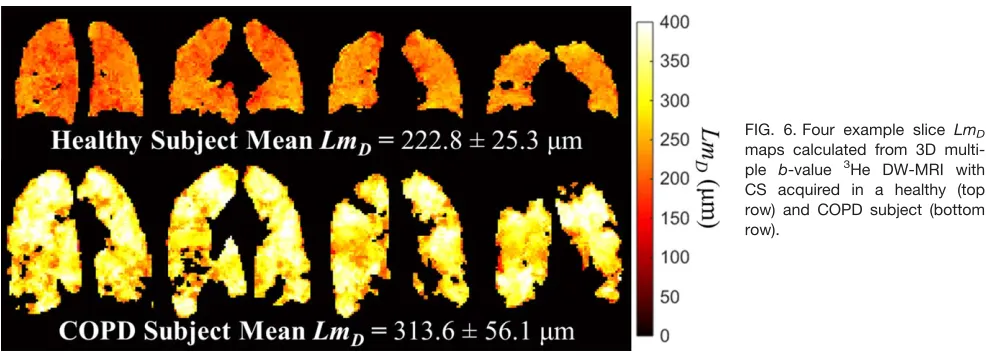
To demonstrate the clinical potential of this method, five healthy subjects and one COPD patient were imaged with the 3D CS multipleb-value DW-MRI sequence.LmD
maps were calculated across the entire lung for each sub-ject, and the derived global meanLmD values reflect the
alveolar size of each subject (example maps from a healthy subject and the COPD patient are shown in Fig. 6).
One limitation of the slice-by-slice comparison of lung microstructural measurements between fully-sampled and CS datasets was that the lung volume was assumed to be the same for each acquisition. Subjects were instructed to inhale the3He and N
[image:8.612.60.553.72.252.2]2gas dosage from FRC to produce a lung volume of FRCþ1 L. However, this inflation volume may not have been reproduced exactly for each acquisi-tion. A difference in lung inflation level of 6% compared with 15% of total lung capacity (TLC) has been shown to have a relatively minor effect on the global mean ADC val-ues (24), but this could also result in slices from the fully-sampled and CS datasets that correspond to slightly differ-ent regions of the lung. The difference in lung microstruc-tural parameters between possibly misregistered slices could be additionally affected by the gravitational dependence of lung ventilation. For example, in the supine position,3He ADC values have been shown to be larger in the anterior regions of the lung compared with the posterior regions, as a result of the gravitational com-pression of lung tissue in the latter (26).
From the CS simulations, a small increase in MAEADC and MAEMAGwas observed from AF¼3 to AF¼4 or 5. The use of these high AFs could allow for higher nomi-nal spatial resolutions to be achieved, or permit the acquisition of additional diffusion interleaves. However, one drawback of using higher AFs is the more severe image blurring effects introduced as a result of the heav-ier undersampling of high-frequency k-space compo-nents. These blurring effects could be reduced by incorporating prior knowledge into the CS reconstruction procedure to improve reconstruction accuracy (15), and thus improve the preservation of edge details of the 3D CS multipleb-value DW-MRI lung images.
In recent years, the potential of HP 129Xe as a cost-effective alternative to 3He for lung imaging and ADC mapping has been explored, with comparable results and functional information obtained from the two nuclei (1,27). Furthermore, naturally abundant xenon (26% 129Xe) (28) and efficient use of enriched xenon (29) have
been shown to enable high-quality ventilation imaging at a significantly lower cost than that of3He. However, the approximately three-fold lower gyromagnetic ratio of 129Xe compared with3He translates to a considerable
sig-nal disadvantage under equivalent experimental condi-tions, and the lower diffusivity of the xenon gas also requires that longer diffusion gradients be used to probe lung microstructure in DW-MRI. To date, 2D multipleb -value 129Xe DW-MRI has been demonstrated for lung morphometry assessment (30,31); however, these meth-ods do not provide whole lung coverage information. The CS techniques implemented here are readily trans-latable to129Xe and could be applied to enable acquisi-tion of 3D multiple b-value 129Xe DW-MRI, to allow whole lung morphometry calculations at a fraction of the cost of an equivalent3He acquisition.
CONCLUSIONS
Compressed sensing has been implemented successfully for the acquisition of 3D multipleb-value DW-MRI lung images with HP3He in a single breath-hold for quantita-tive whole lung microstructural assessment. Prospecquantita-tive CS datasets were acquired in five healthy volunteers and one COPD patient using an optimized three-fold under-sampled k-space pattern, and derived ADC and LmD
results were validated against fully-sampled 3D and 2D 3He DW-MRI. Good agreement between prospective CS
and fully-sampled datasets was found, with a mean dif-ference ofþ3.4 andþ5.1% in global mean ADC andLmD
values, respectively. These results confirm that CS acqui-sition of undersampled 3D3He MRI datasets with multi-pleb-values for lung morphometry is fit for clinical lung imaging studies.
ACKNOWLEDGMENTS
The authors would like to thank Dr. Helen Marshall for help with data acquisition in some of the subjects. This article presents independent research funded in part by the University of Sheffield, Medical Research Council (MRC), EU FP7 project AirPROM, and the National Insti-tute of Health Research (NIHR). The views expressed are
those of the authors and not necessarily those of the NHS, NIHR, or the Department of Health.
REFERENCES
1. Kirby M, Svenningsen S, Owrangi A, et al. Hyperpolarized 3He and 129Xe MR imaging in healthy volunteers and patients with chronic obstructive pulmonary disease. Radiology 2012;265(11):600–610. 2. Saam BT, Yablonskiy DA, Kodibagkar VD, et al. MR imaging of
diffu-sion of 3He gas in healthy and diseased lungs. Magn Reson Med 2000;44:174–179.
3. Salerno M, de Lange EE, Altes TA, Truwit JD, Brookeman JR, and Mugler JP III. Emphysema: hyperpolarized helium 3 diffusion MR imaging of the lungs compared with spirometric indexes—initial experience. Radiology 2002;222(1):252–260.
4. Ajraoui S, Parra-Robles J, Deppe M, et al. Experimental investigation of non-Gaussian diffusion in hyperpolarized 3He MRI of lungs. In: Proc Int Soc Magn Reson Med, 2009; p 2178.
5. Yablonskiy DA, Sukstanskii AL, Leawoods JC, et al. Quantitative in vivo assessment of lung microstructure at the alveolar level with hyperpolarized 3He diffusion MRI. Proc Natl Acad Sci U S A 2002; 99(5): 3111–3116.
6. Sukstanskii AL and Yablonskiy DA. In vivo lung morphometry with hyperpolarized 3He diffusion MRI: theoretical background. J Magn Reson 2008;190(2):200–210.
7. Shanbhag DD, Altes TA, Miller GW, Mata JF, and Knight-Scott J. q-Space analysis of lung morphometry in vivo with hyperpolarized 3He spectroscopy. J Magn Reson Imaging 2006;24(7):84–94.
8. Parra-Robles J, Marshall H, Hartley R, Brightling CE, and Wild J. Quantification of lung microstructure in asthma using a 3He frac-tional diffusion approach. Proc Intl Soc Mag Reson Med 2014;22. 9. Parra-Robles J, Ajraoui S, Marshall H, Deppe MH, Xu X, and Wild
JM. The influence of field strength on the apparent diffusion coeffi-cient of 3He gas in human lungs. Magn Reson Med 2012;67(2):322– 325.
10. Wild JM, Paley MN, Kasuboski L, et al. Dynamic radial projection MRI of inhaled hyperpolarized 3He gas. Magn Reson Med 2003;49(6): 991–997.
11. Salerno M, Altes TA, Brookeman JR, de Lange EE, Mugler JP III. Dynamic spiral MRI of pulmonary gas flow using hyperpolarized (3)He: preliminary studies in healthy and diseased lungs. Magn Reson Med 2001;46(10):667–677.
12. Lee RF, Johnson G, Grossman RI, Stoeckel B, Trampel R, and McGuinness G. Advantages of parallel imaging in conjunction with hyperpolarized helium—a new approach to MRI of the lung. Magn Reson Med 2006;55(5):1132–1141.
13. Lustig M, Donoho D, and Pauly JM. Sparse MRI: the application of compressed sensing for rapid MR imaging. Magn Reson Med 2007; 58(12):1182–1195.
14. Ajraoui S, Lee KJ, Deppe MH, Parnell SR, Parra-Robles J, Wild JM. Compressed sensing in hyperpolarized 3He lung MRI. Magn Reson Med 2010;63(4):1059–1069.
15. Ajraoui S, Parra-Robles J, Wild JM. Incorporation of prior knowledge in compressed sensing for faster acquisition of hyperpolarized gas images. Magn Reson Med 2013;69(2):360–369.
16. Qing K, Altes TA, Tustison NJ, et al. Rapid acquisition of helium-3 and proton three-dimensional image sets of the human lung in a sin-gle breath-hold using compressed sensing. Magn Reson Med 2015; 74(10):1110–1115.
17. Ajraoui S, Parra-Robles J, Marshall H, Deppe MH, Clemence M, Wild JM. Acquisition of (3)He ventilation images, ADC, T(2)* and B(1) maps in a single scan with compressed sensing. NMR Biomed 2012; 25(1):44–51.
18. Collier GJ, Wild JM. In vivo measurement of gas flow in human air-ways with hyperpolarized gas MRI and compressed sensing. Magn Reson Med 2015;73(6):2255–2261.
19. Parra-Robles J, Wild JM. The influence of lung airways branching structure and diffusion time on measurements and models of short-range 3He gas MR diffusion. J Magn Reson 2012;225(12):102–113. 20. Parra-Robles J, Ajraoui S, Deppe MH, Parnell SR, Wild, JM.
21. Berberan-Santos MN, Bodunov EN, Valeur B. Mathematical functions for the analysis of luminescence decays with underlying distribu-tions. I: Kohlrausch decay function (stretched exponential). Chem Phys 2005;315:171–182.
22. Wild JM, Woodhouse N, Paley MN, et al. Comparison between 2D and 3D gradient-echo sequences for MRI of human lung ventilation with hyperpolarized 3He. Magn Reson Med 2004;52(9):673–678. 23. Diaz S, Casselbrant I, Piitulainen E, et al. Validity of apparent
diffu-sion coefficient hyperpolarized 3He-MRI using MSCT and pulmonary function tests as references. Eur J Radiol 2009;71(8):257–263. 24. Diaz S, Casselbrant I, Piitulainen E, et al. Hyperpolarized 3He
appa-rent diffusion coefficient MRI of the lung: reproducibility and volume dependency in healthy volunteers and patients with emphysema. J Magn Reson Imaging 2008;27(4):763–770.
25. Woods JC, Choong CK, Yablonskiy DA, et al. Hyperpolarized 3He dif-fusion MRI and histology in pulmonary emphysema. Magn Reson Med 2006;56(12):1293–1300.
26. Fichele S, Woodhouse N, Swift AJ, et al. MRI of helium-3 gas in healthy lungs: posture related variations of alveolar size. J Magn Reson Imaging 2004;20(8):331–335.
27. Kirby M, Ouriadov A, Svenningsen S, et al. Hyperpolarized 3He and 129Xe magnetic resonance imaging apparent diffusion coefficients: physiological relevance in older never- and ex-smokers. Physiol Rep 2014;2(7).
28. Stewart NJ, Norquay G, Griffiths PD, Wild JM. Feasibility of human lung ventilation imaging using highly polarized naturally abundant xenon and optimized three-dimensional steady-state free precession. Magn Reson Med 2015;74(8);346–352.
29. He M, Robertson SH, Kaushik SS, et al. Dose and pulse sequence considerations for hyperpolarized (129)Xe ventilation MRI. Magn Reson Imaging 2015;33(9):877–885.
30. Ouriadov A, Farag A, Kirby M, McCormack DG, Parraga G, Santyr GE. Lung morphometry using hyperpolarized (129) Xe apparent diffu-sion coefficient anisotropy in chronic obstructive pulmonary disease. Magn Reson Med 2013;70(12):1699–1706.