STUDY ON MORPHOMETRY OF PROXIMAL FEMUR
M.D. DEGREE EXAMINATION BRANCH XXIII - ANATOMY
MAY 2019
INSTITUTE OF ANATOMY MADURAI MEDICAL COLLEGE
MADURAI – 20
THE TAMILNADU
CERTIFICATE FROM THE DEAN
This is to certify that the dissertation entitled “STUDY ON MORPHOMETRY OF PROXIMAL FEMUR’’ submitted by
Dr.K.GEETHANJALI, to the Faculty of Anatomy, The Tamilnadu Dr.M.G.R. Medical University, Chennai in partial fulfilment of the
requirement for the reward of M.D. Degree in Pathology is a bonafide work
carried out by him during the period 2016-2018.
Place: Madurai Prof.Dr.D. MARUTHUPANDIAN
Date: M.S., F.I.C.S., F.A.I.S., FAC
Dean,
CERTIFICATE FROM HEAD OF DEPARTMENT
This is to certify that the dissertation titled “STUDY ON MORPHOMETRY OF PROXIMAL FEMUR’’ is a bonafide record work done by Dr.K.GEETHANJALI, under my direct supervision and guidance, submitted to The Tamilnadu Dr. M. G. R. Medical University in
partial fulfillment of University regulation for M.D., Branch-XX111 (ANATOMY).
Dr. VINO VICTOR JESUDAS, M.D.,
DECLARATION
I, Dr.K.GEETHANJALI, solemnly declare that the dissertation
titled ‘‘STUDY ON MORPHOMETRY OF PROXIMAL FEMUR’’
has been prepared by me. I also declare that this work was not submitted
by me or any other, for any award, degree, diploma to any other University
board either in India or abroad. This is submitted to The TamilnaduDr.
M.G.R. Medical University, Chennai in partial fulfillment of the rules and
regulation for the award of M.D degree Branch-XXIII (ANATOMY) to be held in May-2019.
Place: Madurai Dr.K.GEETHANJALI
ACKNOWLEDGEMENTS
First I would like to thank Lord God Almighty whose blessings
made this study possible.
I would like to express my sincere thanks to our Dean,
Dr.D.Maruthupandian M.S., FICS., FAIS.
At the outset, I wish to express my sincere gratitude to our Director,
Dr.Vino Victor Jesudas M.S., for his expert supervision and valuable suggestions.
I wish to express my whole hearted thanks to our Associate
Professor Dr.M.Sobana M.S., D.G.O., for her constant encouragement and excellent guidance.
I thank my mother Dr.M.Punithambal Ph.D., and brothers
Mr.K.Gopi M.S., and Mr.R.B.Barath M.S., who have extended their
affectionate support.
And I extend my gratitude to all my Professors, my Seniors and
Juniors.
CONTENTS
S.NO TOPICS PAGE NO
1 INTRODUCTION 1
2 AIMS AND OBJECTIVES 16
3 REVIEW OF LITERATURE 17
4 MATERIALS AND METHODS 32
5 OBSERVATIONS 37
6 DISCUSSION 62
7 SUMMARY AND CONCLUSIONS 73
8 BIBLIOGRAPHY 77
9
ANNEXURE
MASTER SHEET PROFORMA
LIST OF ILLUSTRATIONS
S.NO DESCRIPTION
1 Figure showing acetabulum and upper end of Femur forming the hip joint
2 Figure showing upper end of Femur with head, neck and trochanters
3 Figure showing the Neck Shaft Angles of Femur at various angles
4 Figure showing the trabecular pattern in the head and neck of Femur
5 Figure showing vascular supply to head and neck of Femur
6 Figure showing the proximal end and shaft of the Femor at under study
7 Figure showing measurement of Femoral Head Vertical Diameter using Vernier Calipers
8 Figure showing measurement of Femoral Head Transverse Diameter using Vernier Calipers
9 Figure showing measurement of Femoral Neck Vertical Diameterusing Vernier Calipers
10 Figure showing measurement of Femoral Neck Transverse Diameter using Vernier Calipers
11 Figure showing measurement of Femoral Head Length superiorly using Vernier Calipers
12 Figure showing measurement of Femoral Head Length inferiorly
14 Figure showing measurement of Femoral Neck Length inferiorly
15 Figure showing measurement of Intertrochanteric Length of Femur
LIST OF TABLES
S.NO DESCRIPTION
1 Comparison of Head Vertical Diameter
2 Comparison of Head Transverse Diameter
3 Comparison of Neck Vertical Diameter
4 Comparison of Neck Vertical Diameter
5 Comparison of Head Length Superiorly
6 Comparison of Head Length Inferiorly
7 Comparison of Neck Length Superiorly
8 Comparison of Neck Length Inferiorly
9 Comparision of Intertrochanteric Length
10 Comparision of Neck Shaft Angle
11 Parameters of Femora
12 Comparision of Head Vertical Diameter in present study with studies published in literature
13 Comparision of Head Transverse Diameter in present study with studies published in literature
14 Comparision of Neck Vertical Diameter in present study with studies published in literature
15 Comparision of Neck Vertical Diameter among Indian Authors
16 Comparision of Neck Transverse Diameter among Indian Authors
18 Comparision of Femoral Head Length Superiorly
19 Comparision of Femoral Head Length Inferiorly
20 Comparision of Neck Shaft Angle in various studies
21 Comparision of Neck Shaft Angle with commonly used implants
LIST OF ABBREVATIONS
ASIS - Anterior Superior IliacSpine
AVN - Avascular Necrosis
BMD - Bone Mineral Density
BMI - Body Mass Index
DHS - Dynamic Hip Screw
HTD - Head Transverse Diameter
HVD - Head Vertical Diameter
INL - Neck Length Inferiorly
ITL - Intertrochanteric Length
NSA - Neck Shaft Angle
NTD - Neck Transverse Diameter
NVD - Neck Vertical Diameter
PSIS - Posterior Superior IliacSpine
SD - Standard Deviation
SHL - Head LengthSuperiorly
SNL - Neck LengthSuperiorly
1
INTRODUCTION
A unique characteristic of humans as compared with other
mammals is erect posture. Many advantages have been gained from this
erect posture, the chief among which has been the freeing of the upper
limb for a great variety of uses. But erect posture has created a number of
mechanical problems – in particular, weight bearing. These problems
have had to be met by adaptations of the skeletal system.
The skeletal system includes the osseous tissues of the body and
the connective tissues that stabilize and interconnect the individual bones.
The bone is a dynamic tissue throughout the lifespan, bone adjusts to the
physiologic and mechanical demands placed on it mainly by the
processes of growth and remodelling. Bone serves the organism
forlocomotion effectively and to maintain posture by bearing loads
without deformation. This is achieved by providing rigid attachment sites
for muscles. It also acts as a system of levers to amplify small
movements.
As an organ, bones protect the viscera and house thehemopoietic
tissue. As a tissue, bones serve as a reservoir to readily mobilize calcium.
Calcium is vital for many metabolic processes including cell-motility,
excitability, secretion, phagocytosis, intermediary metabolism,
2
Among all the bones in the human skeletal system, Femur is the
longest and heaviest bone that functions in transferring the body weight
between the trunk and the lower limb. Femur supports the weight of the
body during standing, walking and running. The structural function of the
femur requires that it endures these mechanical loads by changing its
shape, size and mass (Wescott 2001).
Femur length is roughly one-fourth to one-third of the human body
length. The femur bone can be divided into three main parts which
include the proximal portion (Head & Neck), the shaft and the distal
portion (lower condyles). With its proximal end, it articulates with the
hip bone forming the hip joint, which is a synovial ball – and – socket
joint. With its distal end, it articulates with the tibia and patella forming
the knee joint.
As the Femur is essential for the basic human activities, it can be
assumed that these could have some effect on its shape. Especially, the
actions that involve the proximal end of femur are those which act with
the hip, which include the medial rotation, lateral rotation, adduction,
adduction, flexion and extension and circumduction.
In the erect posture, it inclines downward, slightly backwards,
medially so that the distal ends of the Femur become close together
3
FIGURE – 1: SHOWING ACETABULUM AND UPPER END OF
4
FIGURE – 2: SHOWING PROXIMAL END OF FEMUR WITH
5
The ultimate purpose of the gradual downward and inward
inclination is to bring the knee joint near the line of gravity of the body,
thus producing increased balanced bipedal mobility.
There are metric differences in skeletal components among
different populations and these variations are related to genetic and
environmental factors also. Variations seen in human skeletal
measurements also determine the racial characteristics of the populations.
Anthropometric skeletal measurements are used to show regional
diversity between different populations or even within the same
populations. Moreover, skeletal measurements and the shape of bones
can offer a guide to clinicians for determiningthe risk factors for
fractures.
Fractures are an important health burden causing disability, death,
and medical costs. Mainly, hip fractures are a major problem for elderly
people. The shape of the proximal femur is considered to be an important
risk factor for fracture of the neck of the femur, regardless of bone mass
6
FIGURE – 3: SHOWING THE NECK SHAFT ANGLES OF
7
The risk of hip fracture can be predicted by factors like, Body Mass
Index (BMI), bone mineral density (BMD), the direction and severity of
the fall, strength of the muscle, body habitus, femoral morphometry,
family history or lifestyle factors.
Few authors even reported an association of femoral geometry with
hip fracture in post menopausal women especially in relation to the
Femoral Neck Width.
The Femoral heads support the weight of the body entirely,
suggesting that the morphometry of the proximal femur may contribute to
Femoral neck strength. The proximal femur acts as a brace. The
biomechanical properties of proximal Femur depend on the width and
length of the Femoral neck.
Femoral morphometric parameter including Femoral neck width,
Femoral head width, intertrochateric width, and Femoral neck shaft angle
has been related to the mechanical strength of the upper end of Femur.
These parameters are also associated with the resistance of bone to
impact, the highest values being found in races with a increased incidence
of hip fracture. Some of the most frequently described measurements
with an increased risk of fracture include a longer hip axis length and a
8
Fractures of proximal femur involving the neck are quite frequent
and internal fixation with implants is necessary for early mobilization and
rehabilitation of patients. A strong correlation regarding geometric fit
exists between the dimensions of implant and the fractured femur to be
operated.
The morphology of proximal Femur is an essential parameter in the
design and development of implant for Total Hip Replacement (THR).
Hip joint replacement (hip arthroplasty) is the surgical replacement of all
or part of the hip joint with an artificial material. The procedure can be
either Total Hip Arthroplasty or a hemiarthroplasty.
Total Hip arthroplasty – The articular surfaces of the femur and the
acetabulum are replaced.
Hemiarthroplasty-only the articular surface of the femoral head is
replaced.
Most of these implants are designed and manufactured from the
European and North American region which presumably are based on the
morphology of their respective population.Use of these implants,
adversely affects the functional end result of surgery leading to thigh pain
9
size could affect the final outcome of the surgery with reported
complications such as stress shielding, micromotion and loosening.
Further use of these implants from other regions may not be
appropriate as the design will not take into consideration the morphology
of the Indian population. The use of implants designed based on other
populations posed at least two potential major issues.
First and foremost is the difference of the anthropometry of the
upper end of femur between ethnics due to differences in lifestyle,
physique, applied force and their distribution.
Another problem is implant-morphology mismatch that might
cause difficulties during implant placement and could lead to accelerated
deterioration of the implant life and thus affecting short-term and
long-term outcome of the surgery.
Presently in developing countries like India, Injured femur
replacements are carried out using standard sized Austin Moore femur
implant selected from a range provided by the manufactures. Femur
implant is available in standard sizes of diameter of the Femoral head and
Femoral neck shaft angle.
When manufacturer supplied Femur implants are used for
10
who perform Femur replacement surgeries must depend upon the implant
manufacturer to provide appropriately sized implants. These implants are
manufactured for masses and not for individuals.
However, there is discrepancy in the measurement of the
parameters. The neck shaft angle varies from within 125⁰ to 132⁰.
Undersized or overhanging femoral implants could result in altered
soft-tissue tensioning and altered patella femoral stresses.
Non availability of proper shaped and sized Femur implant or
improper selection of Femur implant could result in serious problems for
the patients in long run. There is a paucity of literature pertaining to the
effects of improperly sized implants on outcome. These observations
have profound implications. They imply that a certain subset of Indian
Femora do not have any implant available to them as they are very small.
Further, a shorter neck length implies that the threads of cancellous
or Garden screws used to fix neck fractures may not cross the fracture site
thereby failing to provide compression and thus destroying the whole
purpose of the surgery. It was these observation these that prompted
Leung et al to modify the gamma nail to suit the Asian Population.
If large amount of bone is replaced by metal a tamponade effect
11
resulting in nonunion of neck fractures and/or AVN (Avascular
Necrosis). Since Indian Femoral heads are smaller, the threads of screws
often fail to cross the fracture of neck of femur especially if the fracture is
sub capital and the screw placement in the inferior quadrant of head. This
implies that we must have screws with shorter thread lengths.
In thin built and short individuals the neck may not have sufficient
space to occupy the three 6.5mm screws recommended for fixation of
neck fractures. A smaller neck shaft angle means that a Dynamic Hip
Screw (DHS) inserted through the classical entry portal using angled
guide will either go into the superior quadrant or pull the fracture in
valgus both of which are harmful. We probably require DHS with
smaller angles for restoration of normal neck shaft angle which usually
changes with age of an individual.
The incidence of intraoperative complications like splintering and
fractures ranges from 4 to 21%. These are due to over-sized implants
available that have been manufactured basically with western parameters.
The present study is being undertaken to analyse the dimensions of
proximal Femur involving the head, neck and trochanters. The standard
commercially available marked prosthesis sometimes may not be the best
12
complications due to mismatch like aseptic loosening, improper load
distribution an discomfort.
Hence, the fracture implant designs should be specific for Indian
bones. So that, more accommodating designs are needed that will enable
proximal and distal filling at the femoral canal producing stable fixation
may be achieved regardless of variations in bone geometry.
There is scarcity of the knowledge regarding dimensions of the
head, neck and trochanters of the femur among Indian population. With
the help of this study the data regarding the dimensions of the head, neck
and trochanters will be obtained in Indian population which can be useful
in the designing of appropriate implants to suit the Femora of Indian
population, and also in reducing the complication rates due to mismatch
caused by the implants and proximal Femoral dimensions.
Femur has always been the most reliable bone for Anthropometry.
Femur morphometry is different between populations or geographical
regions (lgbigbi and Mishra et al). Morphometry of the proximal femur
is determined by a large number of genetic and environmental factors
including age, race, sex and lifestyle. Many studies have demonstrated
the clinical significance between the dimension of the Femur and the
13
Presently, in developing countries like India, injured or broken
Femur replacements are carried out using standard sized Austin Moore
Femur implant selected from a range provided by manufacturers.
But, this is the bane of Indian orthopaedic surgeon to implant
devices and prosthesis designed for Western skeletons. Not only these
implants are large in size, their angles, and orientations and thread length
also mismatch Indian femora. Implants are manufactured for masses and
not for individuals.
Most Orthopaedic implants produced for femoral head prostheses
and trochanteric fractures are designed for Western population.
Moreover, they may be smaller or unsuitable in terms of size or shape for
Asian or Eastern societies, leading to complications like blasts in pin
placements. If these implants are designed in accordance with the
proximal Femoral morphometric data of a given population, such
problems can be eliminated.
Proximal Femoral morphometric data can be measured either by
using a manual technique on sample cadavers directly or by using a
radiographic method (Mahaisavariya et al 2002). In conclusion, we
would like to emphasize the importance of proximal Femoral
measurement which is particularly different from other populations,
giving information to engineers and clinicians alike in the development of
14
15
AIMS
AND
16
AIMS AND OBJECTIVES
• The osteometric study of upper end of femur with particular reference to head and neck is done by observing the Qualitative
and Quantitative measurements in the femora under study.
• Qualitative features of the proximal end of femur are, the Femoral Head including Fovea Capitis, Femoral Neck, Greater and lesser
trochanters, Intertrochanteric line and Intertrochanteric crest etc.
• Qualitative parameters are measured in all the femora ( both right and left )
• To obtain the statistical analysis of each parameter by side wise comparison.
• To compare the values of the parameters obtained with those reported in the literature.
REVIEW
OF
17
REVIEW OF LITERATURE
Farrally MR et al (1975) the association between hip axis length
and fracture risk was present even after adjustment for age, femoral neck
density, height and weight. A longer hip axis length was associated not
only with increased risk of feral neck fractures but also with trochanteric
fractures. They said that there is no significant association between the
neck width and the neck shaft angle with the risk of hip fracture.
Hoaglund FT, Low WD (1980) concluded that in adult, the axis
between the neck and the shaft is about 135°. There are significant differences in morphometry of proximal femur of average Caucasian and
Hong Kong Chinese population. Advanced measurement techniques have
proven the lack of roundness of femoral head by stating that the
meridians have longer radii than the radii of the equator. Thus, the
femoral head has a subtle egg or barrel shape. There are
signigicantdifferences noted in the measurements of head, neck, and
proximal femoral shaft of average normal caucassian and Hong Kong
Chineese population.
Atilla B et al (1995) studied in Turkish individuals and found that
several femoral features were found to be different. Turkish people had a
18
angle, a narrower upper femoral metaphysic and also a narrower
medullary canal with a longer isthmic segment. But their femoral head
size and offset were same as western values. This study established that
there is a diverse variation in proximal femur geometry in Turkish
population compared to Western population which should be taken into
account.
Issac B et al (1997) said the neck shaft angle can be measured
from a proximal femoral segment (n=171) and the range is between 120
degrees to 136 degrees with a mean of 126.7 degrees and has no
significant side difference. The required size of the length of the neck can
be measured to manufacture exact prosthesis for the restoration of normal
neck shaft angle. The angle strongly correlates with neck length,
intertrochanteric axis and minimum femur length but do not correlate
with the vertical diameter of head. They also stated that any estimated
defective angle can be useful for forensic identification of an individual
with pathological changes leading to an abnormality in gait.
Akhihikobo (1997) proposed that the fit and fill of femoral canals
are essential for the success of cementless femoral stems in Total Hip
Arthroplasty. They also stated that in patients with secondary
osteoarthritis it is difficult to provide a good fit and fill using
19
Chantarapanich N et al (1997) proposed a non-destructive
method that can effectively measure the internal as well as the external
3D geometric values of femur. The data obtained can be used to develop
a proper design of prosthesis that required inserting into intramedullary
canal. They also stated that the 2D sagittal femoral curvature derived
from standard radiographic image can be represented for 3D femoral
curvature.
Fessy et al (1997) proposed that within a population there is a
considerable variation in the endosteal canal anatomy of the upper end of
femur. This anatomical variation affects the outcome of the total hip
arthroplasy when the orthopedic surgeon uses cement less femoral shaft.
They also stated that if the secondary fixation of an implant stays under
the dependency of many parameters, initially one has to obtain very good
primary stability by the morphological appropriateness of the bone
implant. They also proposed to define the cement less indications in total
hip arthroplasty, defining two radio-anatomical parameters namely,
Cortico-Medullary Index and the Femoral Flare Index.
Akihiko Bo et al (1997) stated that the fit and fill of the femoral
canal are essential for the success of cement less femoral stems in total
hip arthroplasty. It is difficult for conventional stems to provide a better
20
Hussmann (1997) proposed that in the field of
uncementedarthroplasties, secondary biological fixation of femoral
implants is directly dependent on the quality of the primary stability.
Metaphyseal stability and an appropriate fit between the implant and the
proximal femur improve initial stabilization and optimize the
transmission forces to the femur. So precise knowledge of the three
dimensional femoral shape is needed to the design and selection of
implants.
Auley J P et al (1998) pointed that total hip arthroplasty performed
without cement can be successful in older patients and the study also
provided a reference for comparison with the outcome of total hip
arthroplasty performed using cement and those of hybrid total hip
arthroplasty, in which an acetabular component is fixed without cement
and a femoral component is fixed with cement in older patients.
Duthie et al (1998) did a osteometric study using cadaveric bones
and explained a significant increase in measures of length and width of
femoral neck in male and female, suggesting a evolutionary change in the
morphometric pattern of Scottish population compared to earlier
skeletons available
Nwoha P U et al (1999) found that the transverse and vertical
21
on the X-ray films of the hips of these subjects. There was no significant
difference between the diameters of the left and right femoral heads but
the diameters in the males were significantly greater than in the females.
The vertical diameter and transverse diameter reported by Singh et al in
Calabar men, and transverse diameter for women were significantly
larger than those reported by Nwoha P U et al suggesting the existence of
regional variation of the head of the femur in Nigerians. The vertical
diameter and transverse diameter reported for Nigerians were greater than
those reported for Caucassians, Indians and Chineese, supporting racial
and geographical variation in the head of the femur.
P J Rubin (1999) stated that as there is a great variation in
morphometry of femur in normal population and that is the reason for
difficulty in precise bone-implant and stated that there are only few
detailed studies on geometry of femur. A new approach to three
dimensional imaging arose from the use of CT Scans for the design of
custom-made prostheses and to compare the internal and external
geometry of proximal femur as obtained from X-Rays or CT Scans with
actual measurements of anatomical specimens used. The reconstructed
femur generated with these measurements was used as the reference.
They concluded that CT scan is an accurate technique in experimental
22
when care is taken to limit technical precisions. Radiological accuracy
could be improved in the future by a computerized correction of
radiological femoral dimensions through the availability of banks of
anatomical or CT scan generated three dimensional data.
Mall G et al (2000) concluded that the identification of sex from
bones or bone fragments considerably contributes to identifying unknown
bodies or skeletal remains. Due to temporal change and regional
differences anthropometric standards have to be constantly updated.
Measurements of femoral dimensions in German population that analyses
dimorphism by discriminate analysis have also been described.
Igbigbi (2000) proposed that the vertical and transverse diameters
of femoral heads of males were significantly more than the corresponding
diameters of femoral head of females. This study also provided standard
data for black Malawian population with the recommendation that same
standard values can also be established for other African countries.
Asala S.A et al (2001) proposed that the diameter of the headof
the femur and the identification and differentiating points that are derived
from them are sexually dimorphic in South Africa and Black populations.
Nobel P C et al (2001) proposed that the shape of femoral canal is
23
components would suggest. Considering this variability, line-to-line or
surface-to-surface contact is not required between cement less implants
and much of the endosteal surface. It is apparent that changes in implant
design are still needed if the normal biomechanics of the hip joint are to
be restored. The Neck Shaft Angle in their study was found to be 125.4
degrees. And also accommodating designs of femoral components are
required that will enable proximal and distal fitting at the femoral canal
so that stable fixation could be achieved regardless of variation in bone
geometry.
Taner Z (2002) studied the morphometry of the femur of
contemporary mid- Anatolian Population who died during the twentieth
century. He measured mean values of the lengths of right and left femur
and found them to be the same. Femoral anthropometry from the two
different time periods revealed a great amount of variations that are most
probably the results of variable factors such as nature of work, mode of
life, continuous modifications that may affect the characteristics of man
as well as the effects of civilization on the composition of human body in
both positive and negative ways. He stated that anthropometric
measurements could show differences between various populations from
24
Pawlikowski M et al (2003) proposed that the design of hip joint
prosthesis is a highly complex process which requires close co-operation
between engineers and orthopaedic surgeons. To design prosthesis of
higher durability one has to take into consideration natural processes
occurring in bone. In this study the visco-elastic properties of bone and
bone remodeling were taken into consideration, which is a novel
approach in prosthesis design.
Siwach RC and DahiyaS (2003) stated that the use of implants
designed for western population should be restricted and in future implant
design must be customized to suit the Indian population. With the use of
implants designed for western population the incidence of intra-operative
complications like fractures and splintering ranges from 4% to 21%.
They also stated that the over sized implants which are available have
been manufactured on the basis of western parameters. A strong
association has been established between the incidence of thigh pain and
inadequate fit and fixation of implant. The mean neck width obtained in
the study is 31.8mm.
Calis et al (2004) reported a strong association between femoral
geometry with the fractures of hip in postmenopausal females,
25
AkhtariAfroze (2005) worked o variations of femoral head
diameters in relation gender in people of Bangladesh and showed that the
diameters of femoral head as well as the identification points derived
from them are useful in sex determination. They also stated that their
study is of value not only to orthopaedicians but also to forensic experts.
MohdYusof Baharuddin et al (2006) studied the differences
between Asian and Western femoral morphology and ppointed out that
this difference could be used as a guide to improve the design of
commercially available femoral stems particularly for Asian populations.
By analyzing the peculiar characteristics of Asian femur, better designs
with optimal fit and fill can be manufactured, which will prolong the
lifetime of the implant and reduce other complications such as
micromotion, loosening, stress shielding and fractures. The mean femoral
head vertical diameter obtained in their study is 43.67 mm. the conclusion
of this methodology is optimized load transfer, minimum stem micro
motion, increase in initial stability and extended durability.
Saikia K C et al (2008) stated that the knowledge of the
anatomical parameters of the bony components of the hip joint is very
essential for understanding of the etiopathogenesis of diseases like
primary osteoarthritis of the hip joint. Their study compared various
26
values on the left side were higher than on the right side in parameters
like Neck shaft angle. The Neck shaft Angle was found to be 139 degree
on left side and 140.7 degree on right side.
Toogood P.A (2008) gave a complete description of morphology
of proximal femur. According to this framework, determined normal
population Means, Standard deviations and Ranges established
differences among subpopulations and showed correlations among
various measurements. Two parameters of Neck Shaft relationship were
analyzed, Neck version and Angle of Inclination. Gender differences and
differences between those younger and older than 50 years were
observed. And also correlations between the concavities of neck and neck
shaft relationship were obtained
CK Chie (2009) stated that both the femoral neck and femoral
neck shaft angles were not factors influencing the placement of femoral
neck lag screws and anti-rotation pin in the nailing of proximal femur.
But case to case evaluation is required to exclude cases with extremely
narrow femoral neck width. In these cases implant with a single femoral
screw nail can be used.
Mishra A K et al (2009) stated that implants that are designed
considering the anthropometric and biochemical data will help in
27
AasisUnnanuntana (2010) proposed that knowledge on the
morphology of proximal femur will assist the surgeon in restoring the
geometry of the proximal femur during total hip arthroplasty. He found
statistically significant difference between males and females in Neck
Shaft Angle, Neck Inclination, and absolute horizontal and vertical offset.
No correlation was found between the two offsets.
Bokariya P et al (2010) said that anthropometric findings can be
helpful in intramedullary nailing of all long bones particularly in weight
bearing femur.
Eduardo Branco de Sousa et al (2010) explained that racial
differences are present in the femoral neck “off-set” and stressed on the
significance of this measure in the production of hip joint prosthesis to
maintain the lever arm of the hip abductor.
MuraliManju B Vet al (2011) proposed that ill fitting implant
offemur can produce pain in the anterior aspect of thigh and other
clinicalproblems. They measured the morphometry of the head and neck
of femur for Indian population. As the implantation surgery is based on
the anatomical measurements, the study was done with reference to
clinical application, so that the data obtained are useful not only for the
Orthopaedicians, but also to the Anthropologists. TheMeanNeck
28
Horacio Osorio et al (2012) explained that calculating femoral
length with te dimensions of upper end of femur is of great value for
application in physical anthropology, forensic identification of an
individual and medical jurisprudence. They obtained average values of
the morphometry of proximal femur in the Chilean people. They found no
significant difference between right and left femurs. Their data may
contribute in analyzing the causal factors for hip fractures in Chile and
may also determine predictive values in the study of at-risk group.
This study (n=81) found the mean neck length of the femur as
35.9mm and neck shaft angle as 124.17degrees.
Clark JM et al (2012) was of the opinion that the normal shape of
proximal femur varies and it appears to reflect adaptation to physiological
variations along the line of action of muscle forces in the absence of
intrinsic bone disease.
Rawal et al (2012) said that the standard commercially available
prostheses sometimes may not be the best fit to Indian patients because of
the large anatomical variations. Orthopedic surgeons always stress the
need for a proper implant- patient match in hip joint replacements
especially for cement less femoral stem. The complications of mismatch
are aseptic loosening, improper load distribution and discomfort. A
29
and Swiss populations, which can significantly affect soft tissue tension
and range of motions. This study concluded a need for redesign of
femoral stems. The obtained anthropometric femoral dimensions can be
used to design and develop hip joint prosthesis in India and can also be
used in forensic anthropometric studies.
David S. Casper et al (2012) proposed that the ability of
uncementedfemoral stems to osseointegrate properly depends largely on
their fit in the proximal femur after evaluating the morphometry of the
proximal femur based on age and sex. He also noted that significant
difference exists between the male and female proximal femoral
geometry. This mostly attributed to the loss of cortical bone,
demonstrating the need of considering age and sex while selecting a
proper prosthesis.
Jeremy Gebhart et al (2012) stated that the contralateral femur is
frequently used for preoperative templating for Total Hip Arthroplasty or
Hemiarthroplasty when the proximal femur is deformed by degenerative
changes or fracture. All femoral measurements had an absolute difference
less than 2 mm and difference in asymmetry was less than 2 % for the
femoral head, less than 4 % for the femoral neck and less than 3.5 % for
the femoral shaft. This data support assumptions of substantial symmetry
30
demographics or the size of proximal femur. Asymmetry does not occur
in isolated segments of the femur.
Amir A Jamali et al (2013) said that the morphology in
femoroacetabular impingement has been used in the development of
osteoarthritis. The alpha angle and femoral head/neck offset are used to
determine femoral head asphericity. The study aimed at finding normal
values for the alpha angle in adolescents. And also defines the location
along the neck with the highest alpha angle and determine normal
femoral head and neck radii and femoral head/neck offset. This will be
helpful for distinction between normal and abnormal morphologic
features of the femoral head.
QingshanGuo et al (2013) aimed at comparing the clinical
effectiveness of the percutaneous compression plate and proximal
femoral nail anti-rotation in the treatment on intertrochanteric fractures in
older patients. Also evaluation variables like operation time, intra and
perioperative blood losses were used to compare these two implants.
They found that both of them appear to have similar clinical effects in
treating elderly patients with intertrochanteric fractures.
EbCaetano (2016) stressed on importance of femoral
morphometry of Brazillian people and also emphasized on importance of
geometry of proximal segment of the femur in clinical practice
31
FIGURE – 6: SHOWING THE PROXIMAL END AND SHAFT OF
MATERIAL
AND
32
MATERIALS AND METHODS
The materials for the present study comprised of 100 (50 right and
50 left) adult dry femora from Institute of Anatomy, Madurai Medical
College for osteometric study.
INCLUSION CRITERIA
Adult human dry femur bones of both sexes in the Institute of
Anatomy, Madurai Medical College.
EXCLUSION CRITERIA
Bones with visible osseous pathologies like tumors, deformities,
fractures, Trauma.
INSTRUMENTS USED
Verniercalipers and Goniometers are used for taking measurements.
PARAMETERS
The following parameters are measured with respect to proximal
end of femur, using Vernier Callipers and Goniometer.
• Head Vertical Diameter
• Head Transverse Diameter
• Neck Vertical Diameter
33
• Head Length Superiorly
• Head Length Inferiorly
• Neck Length Superiorly
• Neck Length Inferiorly
• Intertrochanteric Length
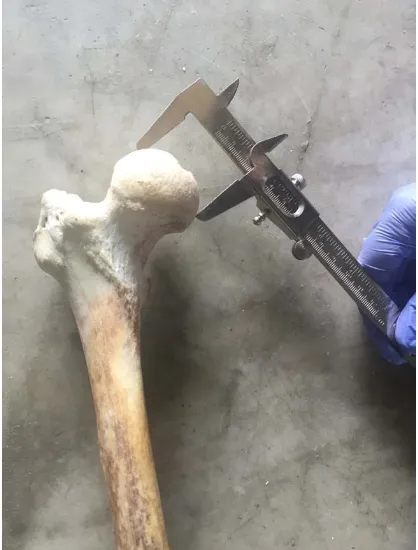
• Neck Shaft Angle Head Vertical Diameter
It is measured between the highest and deepest points of equator of
femoral head. It is measured by holding in a way that fovea centralis is
seen and avoiding the margins of articular surface of head, calipers were
rotated side to side until maximum diameter was obtained. It is measured
as the maximum diameter of femoral head in equatorial plane by using
VernierCalipers in millimetres.
Head Transverse Diameter
It is measured between the most laterally projected points on
equatorial plane taken at right angles to the Vertical Head Diameter,
avoiding the margins of articular surface of head. Measurement was taken
34
Head Length Superiorly
It is measured as the distance between the base of the head to the
margin of fovea capitis in the center of the femoral head. Measurements
were taken with the help of Verniercalipers on the superior aspect.
Head Length Superiorly
It is measured as the distance between the base of the head to the
margin of fovea capitis in the center of the femoral head. Measurements
were taken with the help of Verniercalipers on the superior aspect.
Head Length Inferiorly
It is measured as the distance between the base of the head to the
margin of fovea capitis in the center of the femoral head. Measurements
were taken with the help of Verniercalipers on the inferior aspect.
Neck Vertical Diameter
It is measured as the minimum diameter of the neck of femur at the
supero-inferior direction. It is also called as the Femoral Neck Width.
Neck Vertical Diameter was measured at the narrowest part of neck
between superior and inferior surfaces of the neck as the shortest distance
within the neck perpendicular to the femoral neck axis. Measurement was
35
Neck Transverse Diameter
It is the minimum diameter of the neck at the antero-posterior
direction. Neck transverse diameter was measured at the narrowest part of
the neck of the femur between the anterior and posterior surfaces of the
neck. It was measured with the help of Verniercalipers in millimetres.
Neck Length Superiorly
It is measured along the long axis of the neck of femur as the
distance between the base of the head and mid-point of intertrochanteric
crest over the posterior aspect of the femoral neck. Measurement was
taken with the help of Verniercalipers in millimetres.
Neck Length Inferiorly
It is measured along the long axis of neck of the femur as the
distance between the base of head and mid-point on intertrochanteric line
on the anterior aspect of the femur. Measurement was taken with the help
of Verniercalipers in millimetres.
Neck Shaft Angle
It was measured on the anterior surface of the femur as the Obtuse
angle between the long axis of neck and the long axis of the proximal part
36
the femur by joining two points equidistant from the superior and inferior
surface of the femoral neck and parallel to it. The femoral shaft axis is
defined by the line drawn through the centre of the medullary canal along
axis of the femur. It is measured with the help of Goniometer in degrees.
Intertrochanteric Length
It is measured at a point immediately above the lesser trochanter to
the most lateral aspect of greater trochanter. It is measured with the help
of Verniercalipers in millimetres.
For all the 100 femora both the quantitative as well as the
qualitative assessment was done. The quantitative data is subjected for
37
OBSERVATIONS
The present study was undertaken on 100 dry adult femurs. The
study was done both qualitatively and quantitatively. Osteometric
analysis was done on the proximal end of femur.
QUALITATIVE FEATURES
The femora were studied qualitatively under the following features.
FEMORAL HEAD
In the present study, femoral head appears normal in shape (more
than half a sphere).
FOVEA CENRALIS
Fovea centralis is found to be normal in position in all the
specimens (just above the center of head) and shape is rounded in all
specimens except in 7 specimens, where it is found to be oval in shape.
FEMORAL NECK
In the present study, the femoral neck with numerous vascular
foramina on its anterior surface is observed.
GREATER TROCHANTER
It is observed as the quadrilateral bony prominence over the lateral
aspect of the head at the junction of the neck and the shaft in all the 100
38
LESSER TROCHANTER
It is observed as the conical projection over the posteromedial
aspect of the femoral head at its junction with the neck in all the 100
bones, except in 2 in which the shape to of the lesser trochanter appears
to be rounded.
INTERTROCHANTERIC LINE
In the present study, it is seen as the prominent ridge over the
anterior aspect at the femoral neck with the shaft in all the 100 bones.
INTERTROCHANTERIC CREST
In the present study, it is observed as smooth ridge over the
posterior surface at the junction of the femoral neck with the shaft.
GLUTEAL TUBEROSITY
It is observed over the posterior aspect of the femur in all the 100
bones except in 3 specimens, in which it is depressed and flat.
QUANTITATIVE MEASUREMENTS
Various measurements of the proximal end of the femur are noted
with the help of Verniercalipers and Goniometer, in 100 dry femora
obtained from Institute Of Anatomy, Madurai Medical College belonging
39
STATISTICAL ANALYSIS
The present study is a cross – sectional observational study.
All the parameters of femora belonging to both right and left sides
were tabulated; mean and standard deviation were calculated.
The Student t – test was applied and the side wise comparison is
done by a two-tailed student t-test.
A level of significance of 5 percent (P<0.05) was used for all
analysis.
The parameters under study are:
• Head Vertical Diameter
• Head Transverse Diameter
• Neck Vertical Diameter
• Neck Transverse Diameter
• Head Length Superiorly
• Head Length Inferiorly
• Neck Length Superiorly
• Neck Length Inferiorly
• Intertrochanteric Length
40
41
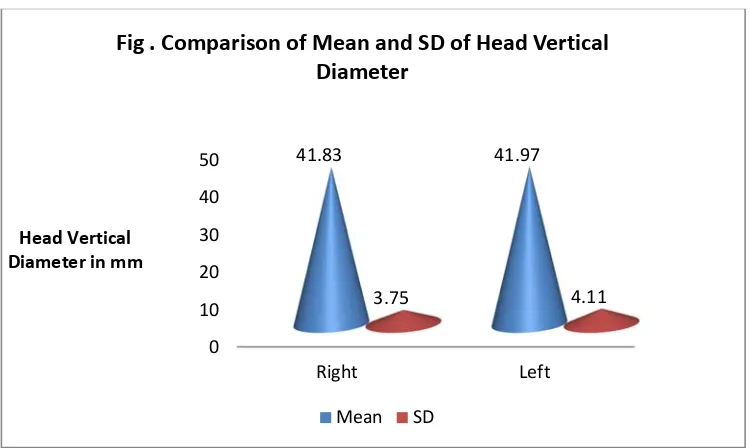
Head vertical diameter is measured between the highest and
deepest points of equator of femoral head. It is measured as the maximum
diameter of femoral head in equatorial plane by using VernierCalipers.
The two tailed student t-test is applied and the mean, standard deviation,
Range, p-value, t-value are obtained. By applying the p and t value
[image:57.595.129.504.526.750.2]statistical significance was analysed.
Table – 1
Comparison of Mean and SD of Head Vertical Diameter (HVD)
HVD in mm Sample
Size Mean SD p-value Inference
Right 50 41.83 3.75
>0.05 Not Significant Left 50 41.97 4.11
No significant side difference is noted in head vertical diameter on
comparing both sides.
0 10 20 30 40 50 Right Left 41.83 41.97 3.75 4.11 Head Vertical Diameter in mm
Fig . Comparison of Mean and SD of Head Vertical Diameter
42
43
Head transverse diameter is measured along most latterly projected
points on equatorial plane. It is measured with VernierCalipers at right
angle to vertical diameter of femoral head. The two tailed student t-test is
applied and the mean, standard deviation, Range, p-value, t-value are
obtained. By applying the p and t value statistical significance was
[image:59.595.134.501.522.756.2]analysed.
Table – 2
Comparison of Mean and SD of Head Transverse Diameter (HTD)
HTD in mm Sample Size Mean SD p-value Inference
Right 50 43.15 3.55
>0.05 Not Significant Left 50 43.41 3.77
No significant side difference is noted in head transverse diameter
on comparing both sides.
0 10 20 30 40 50 Right Left 43.15 43.41 3.55 3.77 Head transverse Diameter in mm
Fig . Comparison of Mean and SD of Head tranverse Diameter
44
45
Neck Vertical diameter is measured as the minimum diameter in
the supero-inferior direction of the neck of femur. The two tailed student
t-test is applied and the mean, standard deviation, Range, p-value, t-value
are obtained. By applying the p and t value statistical significance was
analysed.
Table – 3
Comparison of Mean and SD of Neck Vertical Diameter (NVD)
NVD in mm Sample Size Mean SD p-value Inference
Right 50 31.68 3.43
>0.05 Not Significant Left 50 32.66 4
No significant side difference is noted in Neck Vertical diameter on
comparing both sides
0 10 20 30 40
Right Left
31.68 32.66
3.43 4
Neck Vertical Diameter in mm
Fig . Comparison of Mean and SD of Neck Vertical Diameter
46
47
Neck Transverse diameter is measured as the minimum diameter of
the neck of the femur in antero-posterior direction. The two tailed student
t-test is applied and the mean, standard deviation, Range, p-value, t-value
are obtained. By applying the p and t value statistical significance was
analysed.
Table – 4
Comparison of Mean and SD of Neck Transverse Diameter (NTD)
NTD in mm Sample Size Mean SD p-value Inference
Right 50 24.24 2.46
<0.05 Highly Significant Left 50 25.83 2.95
Significant statistical difference in mean and standard deviation is
observed in relation to neck transverse diameter on comparison.
0 5 10 15 20 25 30 Right Left 24.24 25.83 2.46 2.95 Neck Transverse Diameter in
mm
Fig . Comparison of Mean and SD of Neck Transverse Diameter
48
49
Head Length Superiorly: It is obtained by measuring the distance
between the base of the head and the margins of foveacapitis located at
the center of the head region. The two tailed student t-test is applied and
the mean, standard deviation, Range, p-value, t-value are obtained. By
[image:65.595.124.510.487.745.2]applying the p and t value statistical significance was analysed.
Table – 5
Comparison of Mean and SD of Head Length Superiorly (HLS)
H LS in mm Sample Size Mean SD p-value Inference
Right 50 31.38 3.47
>0.05 Not Significant Left 50 32.18 3.49
No significant side difference is noted in Head Length Superiorly
on comparing both sides.
0 5 10 15 20 25 30 35 Right Left 31.38 32.18 3.47 3.49 Head Length Superiorly in
mm
Fig . Comparison of Mean and SD of Head Length Superiorly
50
51
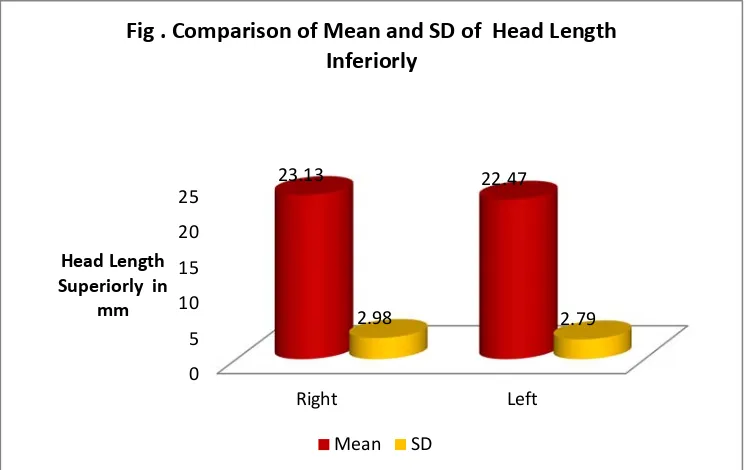
Head Length Inferiorly is obtained as a distance measured between
the bases of femur head to the margins of the foveacapitis located in the
center of femoral head. The two tailed student t-test is applied and the
mean, standard deviation, Range, p-value, t-value are obtained. By
applying the p and t value statistical significance was analysed.
Table – 6
Comparison of Mean and SD of Head Length Inferiorly (HLI)
HLI in mm Sample Size Mean SD p-value Inference
Right 50 23.13 2.98
>0.05 Not Significant Left 50 22.47 2.79
No significant side difference is noted in Head Length Inferiorly on
comparing both sides.
0 5 10 15 20 25 Right Left 23.13 22.47 2.98 2.79 Head Length Superiorly in
[image:67.595.130.503.496.731.2]mm
Fig . Comparison of Mean and SD of Head Length Inferiorly
52
53
Neck Length Superiorly is measured between bases of the head and
mid-points of intertrochanteric line using verniercalipers. The two tailed
student t-test is applied and the mean, standard deviation, Range, p-value,
t-value are obtained. By applying the p and t value statistical significance
[image:69.595.122.510.506.748.2]was analysed.
Table – 7
Comparison of Mean and SD of Neck Length Superiorly (NLS)
NLS in mm Sample Size Mean SD p-value Inference
Right 50 22.91 2.59
>0.05 Not Significant Left 50 23.66 3.62
No significant side difference is noted in Neck Length Superiorly
on comparing both sides.
0 5 10 15 20 25 Right Left 22.91 23.66 2.59 3.62 Neck Length Inferiorly in mm
Fig . Comparison of Mean and SD of Neck Length Inferiorly
54
55
Neck Length Inferiorly is measured as the distance between bases
of the head and midpoint of intertrochanteric crest. The two tailed student
t-test is applied and the mean, standard deviation, Range, p-value, t-value
are obtained. By applying the p and t value statistical significance was
[image:71.595.128.506.503.761.2]analysed.
Table – 8
Comparison of Mean and SD of Neck Length Inferiorly (NLI)
NLI in mm Sample Size Mean SD
p-value Inference
Right 50 29.11 2.68
>0.05 Not Significant Left 50 30.21 3.40
No significant side difference is noted in Neck Length Inferiorly on
comparing both sides.
0 5 10 15 20 25 30 35 Right Left 29.11 30.21 2.68 3.4 Neck Length Inferiorly in mm
Fig . Comparison of Mean and SD of Neck Length Inferiorly
56
57
Intertrochanteric length is measured as a distance between the areas
above the lesser trochanter to the lateral most part of greater trochanter.
The two tailed student t-test is applied and the mean, standard deviation,
Range, p-value, t-value are obtained. By applying the p and t value
[image:73.595.114.520.496.770.2]statistical significance was analysed.
Table – 9
Comparison of Mean and SD of Intertrochanteric Length (IL)
IL in mm Sample Size Mean SD p-value Inference
Right 50 56.97 5.99
>0.05 Not Significant Left 50 58.1 6.04
No significant side difference is noted in Intertrochanteric length
on comparing both sides.
0 10 20 30 40 50 60 Right Left 56.97 58.1 Intertrochanteric length in mm
Fig . Comparison of Mean and SD of Intertrochanteric length
58
59
Neck Shaft Angle is measured as an obtuse angle between the long
axis of the femoral neck to the long axis of the shaft of femur on the
anterior surface of the femur. The two tailed student t-test is applied and
the mean, standard deviation, Range, p-value, t-value are obtained. By
[image:75.595.124.505.502.769.2]applying the p and t value statistical significance was analysed.
Table – 10
Comparison of Mean and SD of Neck Shaft Angle (NSA)
NSA in mm Sample Size Mean SD p-value Inference
Right 50 129.04 4.47
>0.05 Not Significant Left 50 127.98 4.01
No significant side difference is noted in Neck Shaft Angle on
comparing both sides.
0 20 40 60 80 100 120 140 Right Left 129.04 127.98 4.47 4.01 Neck Shaft Angle in mm
Fig . Comparison of Mean and SD of Neck Shaft Angle
60
Quantitatively, there is no significant difference in all the Proximal
Femoral Osteometric Parameters on right and left sides, except with
respect to Neck Transverse Diameter which shows statistically significant
[image:76.595.82.551.279.696.2]difference on comparing both sides.
Table –11
Showing Parameters of Femora
Variable
HVD HTD NVD NTD HL
Right Left Right Left Right Left Right Left Right Left
Sample 50 50 50 50 50 50 50 50 50 50
Mean 41.83 41.97 43.15 43.41 31.38 32.16 31.68 25.83 31.38 32.16
SD 3.75 4.11 3.55 3.77 3.47 3.49 3.43 2.95 3.47 3.49
Range
27.4-48.3 28.1-48.1 32.3-50.7 31.4-50.2 21.2-38.5 23.7- 39.3 24.7- 38.7 20- 31.9 20- 31.9 23.7- 39.3
p-value 0.85 0.72 0.18 <0.01 0.25
Inference Not
61
Variable
HL(INF) NL(SUP) NL(INF) ITL NSA
Right Left Right Left Right Left Right Left Right Left
Sample 50 50 50 50 50 50 50 50 50 50
Mean 23.13 22.47 22.9 23.66 29.11 30.21 56.97 58.1 129.04 127.98
SD 2.98 2.79 2.59 3.62 2.68 3.4 5.99 6.04 4.47 4.01
Range
17.3-30.7 13.3-28.2 19.4-30.3 19.4-30.4 22.1-28.3 20.1-38.8 44.6-68 39.5-67.6 120-138 122-137
p-value 0.25 0.23 0.07 0.34 0.21
Inference Not
62
DISCUSSION
The present work “Study on Morphometry of Proximal Femur” is
done on100 dry femora of which 50 belonged to right side and 50
belonged to left side. Osteometric measurements were obtained for all the
bones.
Several studies said that racial differences have been shown to exist
in the femoral head dimensions. The gross shape of the long bones is due
to intrinsic factors while the specific features are determined by the
adaptation of the bone to the functional environment. Therefore heredity
is a major factor in the formation of shape of long bones due to its
different functions in different races. Incongruous implant size or design
may cause micro movements, laxation and intra-operative complications
like intra-operative fractures and may negatively affect the outcome of
the operation.
Most of the parameters of Indian femora are markedly different
from other ethnic groups. For example, the average femoral head is lesser
than the average Western value by as much as 5mm. likewise other
anthropometric measurements can be seen to vary markedly from the
Western values. So, implants designed for Western skeletons occupy
63
Table – 12 Showing Comparison of Mean Head Vertical Diameter in Present Study with studies published in Literature
Author Ethnic Group Mean Value in mm
Singh South East Nigerea 52.02
Nwoha South West Nigerea 50.35
Igbigbi Malawions 48.3
Akhtari Bangladesh 45.65
Rubin PJ France 43.4
Baharuddin Malaysia 43.4
Taner Z Turkey 43.67
Present Study 41.9
The Value of mean head vertical diameter in the present study is
closely comparable with study done by TanerZ
Fig. Showing Comparison of Mean Head Vertical Diameter in Present Study with studies published in Literature
0 10 20 30 40 50 60 Sou th Ea st N ig erea Sou th West N ig erea Ma la wion s B ang ladesh Fran ce Mal aysia Turkey India
Singh Nwoha Igbighi Akhtari PJ RubinBahharuddinTamer ZPresent Study 52.02 50.35
48.3 45.65
43.4 43.67 43.4 41.9
64
Table – 13 Showing Comparison of Mean Head Transverse Diameter in Present Study with studies published in Literature
Author Ethnic Group Mean Value in mm
Singh South East Nigerea 54.16
Nwoha South West Nigerea 50.75
Igbighi Malawions 50.51
Akhtari Bangladesh 42.2
Present Study India 43.28
The Value of mean head transverse diameter in the present study is
closely comparable with study done by Akhtari
Fig. Showing Comparison of Mean Head Transverse Diameter in Present Study with studies published in Literature
0 10 20 30 40 50 60 South East Nigerea South West Nigerea
Malawions Bangladesh India
Singh Nwoha Igbighi Akhtari Present Study
54.16
50.75 50.51
42.2 43.28
65
Table – 14 Showing Comparison of Mean Neck Width in Present Study with studies published in Literature
Author Ethnic Group Mean Value in mm
Tamer Z Turkey 28.51
Chiu CK. Malaysia 34
Caetano EB. Brazil 28.60
Present Study India 32.19
The Value of mean Neck Width in the present study is closely
comparable with study done by Ckchiu
Fig. Showing Comparison of Mean Neck Width in Present Study with studies published in Literature
25 26 27 28 29 30 31 32 33 34
Turkey Malaysia Brazil India
Tamer Z Ckchiu Ebcaetano Present Study
28.51
34
28.6
32.19
66
Table – 15 Showing the Comparison of Mean Neck Width among Indian Authors
Author Mean Value in mm
Siwach RC. Et al. 31.8
Misheard AK. et al. 30.52
D.Ravichandran 30.99
Present Study 32.19
The Value of Mean Neck Width in the present study is closely
comparable with study done by Siwach R
29.5 30 30.5 31 31.5 32 32.5
Swach R Misra D.Ravichandran Present Study
31.8
30.52
30.99
32.19
67
Table – 16 Showing the Comparison of Mean Neck Transverse Diameter among Indian Authors
Author Mean Value in mm
Murilimanju BV 23.9
Present Study 25.03
The mean Neck Transverse Diameter in the present study is closely
correcting with values obtained by the study of B.V.Murilimanju
Fig. Showing the Comparison of Mean Neck Transverse Diameter among India Authors
1
B.V.Murali Manju
Present Study 23.9
25.03