ISSN 0252-8266
D
o
Eurostatistik
Daten zur Konjunkturanalyse
M o n a t l i c h
Eurostatistics
Data for short-term economic analysis
M o n t h l y
Eurostatistiques
Données pour l'analyse de ia conjoncture
eurostat
STATISTISCHES AMT DER EUROPAISCHEN GEMEINSCHAFTEN
STATISTICAL OFFICE OF THE EUROPEAN COMMUNITIES
OFFICE STATISTIQUE DES COMMUNAUTÉS EUROPÉENNES
CTì
en
σι
Eurostatistik
Daten zur Konjunkturanalyse
M o n a t l i c h
Eurostatistics
Data for shortterm economic analysis
M o n t h l y
Eurostatistiques
Données pour l'analyse de ia conjoncture
Zahlreiche weitere Informationen zur Europäischen Union sind verfügbar über Internet,
server Europa (http://europa.eu.int).
A great deal of additional information on the European Union is available on the Internet.
It can be accessed through the Europa server (http://europa.eu.int).
De nombreuses autres informations sur l'Union européenne sont disponibles sur Internet
via le serveur Europa (http://europa.eu.int).
Luxembourg: Office des publications officielles des Communautés européennes, 1999
SEITE-PAGE-PAGE
VORWORT
FOREWORD
AVANT-PROPOS
ZEICHEN UND ABKÜRZUNGEN
SYMBOLS AND ABBREVIATIONS
SIGNES ET ABRÉVIATIONS
SCHAUBILDER : siehe ausführliche Aufsteilung Seite 1
GRAPHICS : see detailed list on page 1
GRAPHIQUES : voir liste détaillée page I
TABELLEN : siehe ausführliche Aufstellung Seite ill
TABLES : see detailed list on page III
TABLEAUX : voir liste détaillée page III
Volkswirtschaftliche Gesamtrechnungen
ESVG 95
National accounts ESA 95
Comptes nationaux SEC 95
Beschäftigung
Employment
Emploi
Arbeitslosigkeit
Unemployment
Chômage
industrie
Industry
Industrie
Energie
Energy
Energie
Dienstleistungen
Services
Services
Landwirtschaftliche Erzeugnisse
Agricultural products
Produits agricoles
Außenhandel
External trade
Commerce extérieur
Verbraucherpreise
Consumer prices
Prix à la consommation
Agrarpreisindizes
Indices of agricultural prices
Indices des prix agricoles
Finanzstatistiken
Financial statistics
5
6
7
27
29
43
55
61
85
91
99
105
133
143
FOREWORD
AVANT-PROPOS
Mit der monatlich erscheinenden
Veröffentlichung
Eurostatistik
-Daten zur Konjunkturanalyse
werden innerhalb kürzester Frist
die neuesten statistischen Daten
über die Europäische Union als
Ganzes, über jedes
Mitgliedsland sowie über die
Vereinigten Staaten und Japan
bekanntgegeben.
Eurostatistik - Daten zur
Konjukturanalyse
enthält die
wichtigsten, bei Eurostat
verfügbaren Statistiken zur
konjunkturellen Entwicklung.
Die Publikation wurde im
Umfang bewußt klein gehalten
und enthält keine Anmerkungen
zur Methodik, die im übrigen in
den spezialisierten
Veröffentlichungen von Eurostat
zu finden sind.
Eurostatistk - Daten zur
Konjunkturanalyse
enthält keine
Kommentare. Dafür werden die
wichtigsten Indikatoren in der
monatlichen
Veröffentlichung
Schlüsselzahlen - Bulletin zur
europäischen Konjunktur und
Synthesen
kommentiert.
Die in allen Publikationen
veröffentlichten Daten stammen
aus der Datenbank New
Cronos. New Cronos setzt sich
zusammen aus dem alten
Cronos sowie REGIO und ist
nicht mehr in Form von
Zeitreihen, sondern in Form von
multidimensionalen Tabellen
dargestellt. New Cronos ist
somit eines der Produkte zur
Verbreitung statistischer Daten,
das direkt aus der Eurostat
-Referenzdatenbank gespeist
wird.
Eurostatistics - data for
short-term economic analysis
is a monthly publication aimed
at providing, as rapidly as
possible, the latest statistical
data on the European Union
as a whole, each Member
State, the United States and
Japan.
Eurostatistics - data for short
term economic analysis
presents the most relevant
statistics on the economic
situation held by Eurostat.
The publication is deliberately
streamlined and does not
contain any methodological
notes, which are given in
Eurostat's specialized
publications.
Eurostatistics - Data for
short-term economic analysis
does not include comments.
For this,
Key Figures - bulletin
of economic trends and
summaries
will comment on
the most important indicators.
The data presented in all
publications are taken from
Eurostat's on-line database,
New Cronos. New Cronos
includes old Cronos and
Regio, both represented not
by chronological series but
through multi-dimensional
tables. New Cronos is a
dissemination product directly
from Eurostat's Reference
Environment.
Eurostatistiques - Données
pour l'analyse de la
conjoncture
est une publication
mensuelle qui a pour but de
fournir dans les meilleurs
délais les données statistiques
les plus récentes pour l'Union
européenne en tant
qu'ensemble, pour les pays
membres ainsi que pour leurs
principaux partenaires
extra-communautaires
(États-Unis d'Amérique et
Japon).
Eurostatistiques - Données
pour l'analyse de la
conjoncture
reprend les
statistiques les plus
importantes sur la situation
économique disponibles
auprès d'Eurostat.
Cette publication ne comporte
pas de notes méthodologiques.
Elles sont disponibles dans les
publications spécialisées
d'Eurostat.
Eurostatistiques - Données
pour l'analyse de la
conjoncture
ne comprend pas
de commentaires. Par contre,
les indicateurs les plus
importants sont commentés
dans le mensuel
Chiffres Clés
- Bulletin de la conjoncture
européenne et synthèses.
Les données présentées dans
les publications proviennent de
la base de données New
Cronos. New Cronos se
compose de l'ancien Cronos et
de Regio, représentés non plus
sous forme de séries
Z E I C H E N U N D
S Y M B O L S A N D S I G N E S E T
A B K Ü R Z U N G E N A B B R E V I A T I O N S A B R É V I A T I O N S
0
Weniger als die Hälfte der
verwendeten Einheit
%
Prozent
T/Ti %
Prozentualer Zuwachs
eines Vierteljahres
gegenüber dem
vorhergehenden
Vergleichszeitraum
(Monat, Vierteljahr, Jahr)
Data less than the unit
used
Per cent
Percentage increase of
one period (month,
quarter, year) on the
corresponding previous
period
Donnée inférieure à la
moitié de l'unité utilisée
Pourcentage
Accroissement en
pourcentage d'une période
(mois, trimestre ou année)
sur la periode précédente
T/T12 %
1990=100
1000
MIO
MRDBNMRD
t
TJ (GCV)
GWH
USD
ECU
SZR SDRDTS
SITCSITCCTCI
EU15
Prozentualer Zuwachs
eines Monats gegenüber
dem entsprechenden
Monat des Vorjahres
Basisjahr
in 1000
Million
Milliarde
Metrische Tonne
Terajoule = 10
9kJ
Gigawattstunde = 10
6kWh
USDollar
Europäische
Währungseinheit
Sonderziehungsrechte
Standard International
Trade Classification
Mitgliedstaaten insgesamt
Percentage increase on
the corresponding month
of the previous year
Reference year
Thousand
Million
Thousand million
Ton
Terajoule=10
9kJ
Gigawatt hour (= 10
6kWh)
US dollar
European currency unit
specail drawing rights
Standard international
trade classification
Total of Member States
of the EU
Accroissement en
pourcentage d'un mois sur
le mois correspondant de
l'année précédente
Année de base
Millier
Million
Milliard
Tonne métrique
Terajoule = 10
9kJ
Gigawattheure = 10
6kWh
Dollar US
Unité monétaire
européenne
Droits de tirages spéciaux
Classification type pour le
commerce international
Ensemble des États
membres de l'UE
EURll
Wirtschafts und
Währungsunion (B, D, E,
F, IRL, I, L, NL, A, Ρ, FIN)
BelgischLuxemburgische
Wirtschaftsunion
Länder Afrikas,
der Karibik und des
Pazifiks Abkommen
von Lomé
BIPGDPPIB
Bruttoinlandsprodukt
OPEC-OPEC-OPEP
B/L
AKP-ACP-ACP
Economic Monetary Union
(B, D, E, F, IRL, I, L, NL, A,
P, FIN)
BelgoLuxembourg
economic union
African, Caribbean and
Pacific countries of the
Lomé Convention
Union Monétaire
Economique (Β, D, E, F,
IRL, I, L, NL, A, Ρ, FIN)
Union économique
belgoluxembourgeoise
États d'Afrique, des
Caraïbes et du Pacifique
Convention de Lomé
Gross domestic product
Produit intérieur brut
EGKS-ECSC-CECA
Organisation der
erdölexportierenden
Länder
Europäische Gemeinschaft
Organization of petroleum
exporting countries
European coal and steal
Organisation des pays
exportateurs de pétrole
Schaubilder
Graphics
SCHAUBILDER
GRAPHICS
GRAPHIQUES
Veränderung des
Changes in gross domestic
Evolution du produit
Bruttoinlandsprodukts
product
intérieur brut
ESVG95
ESA95
SEC95
(Volumenindex 1995=100)
(Volume index 1995=100)
(Indice de volume 1995=100Ì
EU15
A
EUR11
■JPN
■USA
120
115
. /
y
^
110
105
100
95
90
SCHAUBILDER
GRAPHICS
GRAPHIQUES
ΈΔ
02
eurostat
Veränderung des
Bruttoinlandsprodukts
ESVG95
(Volumenindex 1995=100)
Changes in gross
domestic product
ESA95
(Volume index 1995=100)
Evolution du produit
intérieur brut
SEC95
(Indice de volumel 995=100)
DANMARK
0201
DEUTSCHLAND
0201
1996
1997
1998
1999
r = i EU-15
Danmark
1996
1997
1998 1999
EU-15
Deutschland
ESPANA
FRANCE
1996
1997
1998 1999
EU-15
Espana
1996
1997
1998 1999
EU-15
France
120
118
116
114
112
110
108
106
104
102
100
0201
120
118
1 1 6
114
112
-
110-
108-
106-
104-
102-
100-NEDERLAND
^ ^ ^ f l
SCHAUBILDER
GRAPHICS
GRAPHIQUES
m
02
eurostat
Veränderung des
Bruttoinlandsprodukts
ESVG95
(Volumenindex 1995=100)
Changes in gross
domestic product
ESA95
(Volume index 1995=100)
Evolution du produit
intérieur brut
S E C 9 5
(Indice de volume 1995=100)
ÖSTERREICH
1996
1997
1998
1999
1996
1997
1998
1999
EU-15
Österreich
Γ = 1 EU15
Portugal
1996
1997
1998
1999
1996
1997
1998
1999
EU15
Suomi/Finland
EU15
Sverige
0201
SCHAUBILDER
GRAPHICS
GRAPHIQUES
W.
06
ι i r n c t a t
eurostat
Arbeitslosenquoten
insgesamt saisonbereinigt
Unemployment rates total
seasonally adjusted
Taux de chômage total
désaisonnalisé
BELGIQUE/BELGIË
25
20
15
10
5
0
0601
DANMARK
25 η
20
15 H
1996
1997
1998
1999
EU15
EUR11
Belgique/België
1996
ι
ι
F I11^
1997
I
1 bUH11
1998
1999
^ ■ B
Danmark
EU15
D EUR11
Deutschland
F = n EU15
Γ = 1 EUR11
Espana
SCHAUBILDER
GRAPHICS
GRAPHIQUES
M
06
eurostat
Arbeitslosenquoten
Unemployment rates total
Taux de chômage total
insgesamt saisonbereinigt
seasonally adjusted
désaisonnalisé
ELAND
25
20
15
0601
ITALIA
25
1996
1997
1998
1999
= = 3 EU15
EUR11
Ireland
2 0
15
10
L
1996
1997
1998
1999
Γ = Ί EU-15 Γ = 1 EUR-11
Italia.UXEMBOURG
0601
2 5 - ,
20
15
-10
5
EDERLAN
0601
25
20
15
1 0
-5
1996 1997 1998 1999
1996 1997 1998 1999
= 1 EU-15
EUR-11
Luxembourg
Ξ Ξ 3 EU-15 Γ = ^ 1 EUR-11
Nederland
ÖSTERREICl·
0601
25 η
2 0
1 5
25
20
15-1
SCHAUBILDER
GRAPHICS
GRAPHIQUES
=M
e u r o s t a t
06
Arbeitslosenquoten
insgesamt saisonbereinigt
Unemployment rates total
seasonally adjusted
Taux de chômage total
désaisonnalisé
SUOMI/FINLAND
1996
I
1 EU15
1997
I I bUH11
1998
^m
1999
1996
ι
1 FH1
1^
1997
I I bUH11
1998
mm
1999
Sverige
25
20
15
10
5
0
25
20
15
1996
I
I EU-15
1997
I — I hUH-11
1998
1999
mHU
United Kingdom
1996
I
1 EU15
1997
I I bUH11
1998
L = ]
USA
1999
25 -,
20
15
10
SCHAUBILDER
GRAPHICS
GRAPHIQUES
Wh
eurostat
Industrielle Produktion
Industrie insgesamt
(ohne Baugewerbe)
Trend 1995=100
Industrial production
Total industry
(excluding construction)
Trend 1995=100
Production industrielle
Ensemble de I'indudstrie
(sans bâtiment)
Tendance 1995=100
NACE Rev.1 CE
EU15
A
EUR11
■USA
■JPN
125
120
115
110
105
^~^~*
A A A A A A A
^ΓΖΤΤΤΤΓ^~Α-Α-Α-Α-^ί
90
SCHAUBILDER
GRAPHICS
GRAPHIQUES
ΈΔ
07
■ m e t a t
eurostat
Industrielle Produktion
Industrie insgesamt
(ohne Baugewerbe)
Trend 1995=100
Industrial production
Total industry
(excluding construction)
Trend 1995=100
Production industrielle
Ensemble de I'indudstrie
(sans bâtiment)
Tendance 1995=100
BELGIQUE/BELGIE
0701
120
115
110
105
100
95
90
-120 -,
115-110
105
100
J98 J98 A98 S98 098 N98 D98 J99 F99 M99 A99 M99 J99 J98 J98 A98 S98 098 N98 D98 J99 F99 M99 A99 M99 J99
EU15
Belgique/België
EU15
Danmark
J98 J98 A98 S98 098 N98 D98 J99 F99 M99 A99 M99 J99 J98 J98 A98 S98 098 N98 D98 J99 F99 M99 A99 M99 J99
EU15
Deutschland
EU15
Ellada
120
115
110
105
SCHAUBILDER
GRAPHICS
GRAPHIQUES
^ | 0 7
eurostat
lELAN
Industrielle Produktion
Industrie insgesamt
(ohne Baugewerbe)
Trend 1995=100
Industrial production
Total industry
(excluding construction)
Trend 1995=100
Production industrielle
Ensemble de I'indudstrie
(sans bâtiment)
Tendance 1995=100
J98 A98 S98 098 N98 098 J99 F99 M99 A99 M99 J99 J98 J98 A98 S98 098 N98 D98 J99 F99 M99 A99 M99 J99
EU-15
Ireland
EU-15
Italia
.UXEMBOURG
0701
J98 J98 A98 S98 098 N98 D98 J99 F99 M99 A99 M99 J99
E==D EU-15
Luxembourg
120-,
115
110
105
-
1009 5
9 0
8 5
80
-NEDERLAND
0701
v^mW
I I I I 1 1
J98 J98 A98 S98 098 N98 D98 J99 F99 M99 A99 M99 J99
:
J
FU-15
Nederland
120
115
110
105
100
95
90
85
SCHAUBILDER
GRAPHICS
GRAPHIQUES
Wh
07
eurostat
Industrielle Produktion
Industrie insgesamt
(ohne Baugewerbe)
Trend 1995=100
Industrial production
Total industry
(excluding construction)
Trend 1995=100
Production industrielle
Ensemble de I'indudstrie
(sans bâtiment)
Tendance 1995=100
J98 J98 A98 S98 098 N98 D98 J99 F99 M99 A99 M99 J99
EU-15
Suomi/Finland
J98 J98 A98 S98 098 N98 D98 J99 F99 M99 A99 M99 J99
EU-15
Sverige
J98 J98 A98 S98 098 N98 D98 J99 F99 M99 A99 M99 J99
EU-15
United Kingdom
J98 J98 A98 S98 098 N98 D98 J99 F99 M99 A99 M99 J99
SCHAUBILDER
GRAPHICS
GRAPHIQUES
Wh
eurostat
Verbaucherpreisindizes Consumer prices indices
Indice des prix à la consommation
Gesamtindex
General index
Indice général
TT-12%
ΤΛΓ-12%
T/T-12%
- - - EU-15
-
USA
-JPN
4.0
3.5
r\
GRAPHICS
GRAPHIQUES
ι / I I
Harmonisierte
Harmonized indices of
Indices harmonisés des prix
- — r / 1
I Verbraucherpreisindizes
consumer prices General
à la consommation
eurostat
Gesamtindex T/T-12%
index T/T-12%
Indice d'ensemble T/T-12%
BELGIQUE/BEL
0.5
0.0
J98 A98 S98 09B Ν9β D98 J99 F99 M99 A99 M99 J99 J99 J96 A98 S9B 098 N98 D98 J99 F99 M99 A99 M99 J99 J99
: = = ] EU-15
ΠΞΞΏ
EUR-11
Belgique/België
EU15
ΕΞΞΞ3
EUR11
Danmark
J98 A98 S98 098 N98 D98 J99 F99 M99 A99 M99 J99 J99
EU15
U
EUR11
Deutschland
ESPANA
2101
2.5
2.0
J98 Α9Θ S98 098 N98 D98 J99 F99 M99 A99 M99 J99 J99
= ]
EU15
ΠΞΞΏ
EUR-11
Espana
J98 A98 S98 098 N98 D98 J99 F99 M99 A99 M99 J99 J99
EU-15
EUR-11
Ellada
2.0
FRANCE
J98 A98 S98 098 N98 D98 J99 F99 M99 A99 M99 J99 J99
SCHAUBILDER
GRAPHICS
GRAPHIQUES
m
21
eurostat
Harmonisierte
Harmonized indices of
Verbraucherpreisindizes
consumer prices
Gesamtindex T/T-12%
General index T/T-12%
Indices harmonisés des prix
à la consommation
Indice d'ensemble T/T-12%
J98 A98 S98 098 N98 D98 J99 F99 M99 A99 M99 J99 J99 J98 A98 S98 098 N98 D98 J99 F99 M99 A99 M99 J99 J99
EU-15
3
EUR-11
Ireland
Γ = 1 EU-15
ΠΞΞΞ2
EUR-11
Italia
J9B Α9β S98 098 N98 D98 J99 F99 M99 A99 M99 J99 J99 J98 A98 S98 098 N98 D98 J99 F99 M99 A99 M99 J99 J99
Γ = 1 EU-15
Ώ
EUR-11
Luxembourg
EU-15
D EUR-11
Nederland
SCHAUBILDER
GRAPHICS
GRAPHIQUES
m
21
eurostat
Harmonisierte Harmonized indices of Indices harmonisés des prix à la
Verbraucherpreisindizes consumer prices General consommation
Gesamtindex T/T-12% index
T/T-12%
Indice d'ensemble
T/T-12%
A98 S98 098 N98 D98 J99 F99 M99 A99 M99 J99 J9S J98 A98 S98 098 N98 D98 J99 F99 M99 A99 M99 J99 J99
EU-15 C
EUR-11
Suomi/Finland
EU-15
Ώ
EUR-11
Sverige
J98 A98 S98 098 N98 D98 J99 F99 M99 A99 M99 J99 J99
SCHAUBILDER
GRAPHICS
GRAPHIQUES
Wh
24
eurostat
Wechselkurs
(Durchschnitt)
Exchange rate
(Mean)
Taux de change
(Moyenne)
■1 EUR(*) = ... USD
1 EUR(*) = ... YEN
1.5
1.4
1.3
1.2
1.1
1.0
170
160
150
140
130
120
110
100
1996
1997
1998
1999
SCHAUBILDER
GRAPHICS
GRAPHIQUES
Wh
24
eurostat
Wechselkurs (1)
(Durchschnitt)
Exchange rate (1)
(Mean)
Taux de change(1)
(Moyenne)
A98 S98 098 N98 D98 J99 F99 M99 A99 M99 J99 J99 A99
1 EUR = .
1 USD =
A98 S98 098 N98 D98 J99 F99 M99 A99 M99 J99 J99 A99
1 EUR
1 USD:
10.0-1
9.5
-9.0
8.5 H
8.0
7.5
\
7.0
6.5
6.0
2401
UNITED KINGDOM
2401
A98 S98 098 N98 D98 J99 F99 M99 A99 M99 J99 J99 A99 A98 S98 098 N98 D98 J99 F99 M99 A99 M99 J99 J99 A99
Ξ Ξ Ι 1 EUR = ...
1 USD:
1 EUR:
1 USD:
SCHAUBILDER
GRAPHICS
GRAPHIQUES
Wh
eurostat
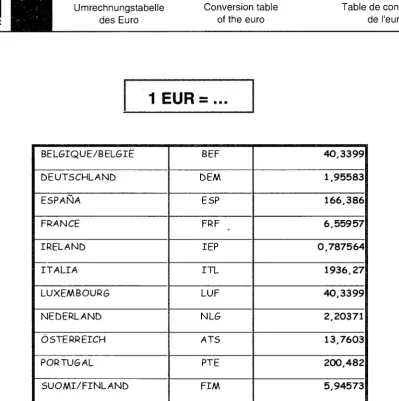
Umrechnungstabelle
des Euro
[image:27.595.84.484.105.507.2]Conversion table
of the euro
Table de conversion
de l'euro
1
EUR
=
...
BELGIQUE/BELGIË
DEUTSCHLAND
ESPAÑA
FRANCE
IRELAND
I T A L I A
LUXEMBOURG
NEDERLAND
ÖSTERREICH
PORTUGAL
S U O M I / F I N L A N D
BEF
DEM
ESP
FRF
IEP
I T L
LUF
NLG
ATS
PTE
F I M
4 0 , 3 3 9 9
1,95583
1 6 6 , 3 8 6
6 , 5 5 9 5 7
0 , 7 8 7 5 6 4
1 9 3 6 , 2 7
4 0 , 3 3 9 9
2 , 2 0 3 7 1
13,7603
2 0 0 , 4 8 2
Volkswirtschaftliche Gesamtrechnungen
ESG 95
VOLKSWIRTSCHAFTLICHE GESAMTRECHNUNGEN ESVG 95
NATIONAL ACCOUNTS ESA 95
COMPTES NATIONAUX SEC 95
1996 1997 1998 1999 1995 IV 1996 I
III IV 1997 I
III IV 1998 I
III IV 1999 I II 1996 1997 1998 1999 1995 IV 1996 I II III IV 1997 I II III IV 1998 I
II III IV 1999 I II
0101
EU-15 6572.88 6730.85 6910.44 7050.65 1625.27 1629.54 1639.36 1648.97 1655.01 1658.34 1678.24 1690.57 1703.71 1716.04 1723.95 1733.91 1736.54 1743.43 1749.650102
EU-15 1.5 2.4 2.7 2.0 0.3 0.3 0.6 0.6 0.4 02 1.2 0.7 0.8 0.7 0.5 0.6 0.2 0.4 0.4Bruttoinlansprodukt
Mrd Euro(")
1995
EUR-11 5317.10 5434.86 5583.30 5704.41 1316.13 1318.29 1326.42 1334.28 1338.11 1338.41 1355.29 1364.89 1376.27 1386.61 1393.21 1400.70 1402.78 1409.09 1413.54 Β 21278 219.61 225.99 230.32 52.84 52.77 52.97 53.40 53.68 53.64 54.79 55.40 55.82 55.85 56.74 56.80 56.64 56.78 DK 141.71 146.16 150.08 152.62 34.86 35.02 35.43 35.68 35.62 35.98 36.65 36.64 36.92 37.32 37.03 37.91 37.87 37.71 D 1894.38 1921.87 196323 1996.10 471.59 467.48 473.78 475.86 477.84 475.65 481.15 482.86 484.67 489.80 489.80 491.77 490.44 492.63 492.84Veränderung des
Bruttoinlandsprodukts
Volumen (T/T1 %)
EUR-11 1.3 22 2.7 2.2 0.2 0.2 0.6 0.6 0.3 0.0 1.3 0.7 0.8 0.8 0.5 0.5 0.2 0.5 0.3 Β 0.9 3.2 2.9 1.9 0.4 0.1 0.4 0.8 0.5 0.1 2.1 1.1 0.8 0.1 1.6 0.1 0.3 0.3 DK 2.9 3.1 2.7 1.7 1.0 0.5 1.2 0.7 0.2 1.0 1.9 0.0 0.8 1.1 0.8 2.4 0.1 0.4 D 0.8 1.5 2.2 1.7 0.2 0.9 1.4 0.4 0.4 0.5 1.2 0.4 0.4 1.1 0.0 0.4 0.3 0.5 0.0 EL 47.25 48.74 50.54 52.25 EL 2.4 3.2 3.7 3.4 E 457.29 474.35 493.14 509.46 112.27 113.12 113.74 114.96 115.63 116.50 118.29 118.97 120.76 121.76 122.67 124.07 124.82 125.92 E 2.3 3.7 4.0 3.3 0.5 0.8 0.5 1.1 0.6 0.8 1.5 0.6 1.5 0.8 0.7 1.1 0.6 0.9 F 1201.20 1224.85 1263.59 1293.09 297.00 299.20 299.68 301.14 301.58 302.78 304.73 307.31 310.60 313.51 316.16 317.66 319.54 320.81 322.70
Gross domestic^product
Bn euro(')
1995
IRL 49.18 54.41 59.04 64.51Chanc
proc
F 1.1 2.0 3.2 2.3 0.2 0.7 0.2 0.5 0.2 0.4 0.6 0.9 1.1 0.9 0.9 0.5 0.6 0.4 0.6 IRL 8.: 10.7 8.£ 9.: I 846.30 858.85 870.33 884.14 210.47 211.92 211.00 212.03 211.26 210.87 214.43 215.99 217.47 216.47 217.21 218.55 218.02 218.37 L 11.56 12.03 12.72 13.13es in gross d
uct volume
(T/T1 %)
I 0.9 1.5 1.3 1.6 0.4 0.7 0.4 0.5 0.4 0.2 1.7 0.7 0.7 0.5 0.3 0.6 0.2 0.2 L 2.Í 4.1 5.7 3.2 NL 326.96 339.35 351.78 359.75 77.00 77.86 78.25 78.96 79.25 80.02 80.95 81.96 82.85 83.65 84.18 84.60 85.58 86.21 86.85omestic
erms
NL 3.0 3.8 3.7 2.3 0.2 1.1 0.5 0.9 0.4 1.0 1.2 1.2 1.1 1.0 0.6 0.5 1.2 0.7 0.8 A 180.16 184.70 190.70 195.01 44.46 44.65 45.08 45.00 45.37 45.54 45.75 46.30 47.00 47.45 47.71 47.71 47.79 47.96 A 2.0 2.5 3.3 2.3 0.6 0.4 1.0 0.2 0.8 0.4 0.5 1.2 1.5 1.0 0.5 0.0 0.2 0.3 Ρ 56.21 58.15 60.18 62.11 13.89 13.96 14.09 13.87 14.28 14.33 14.57 14.40 14.84 14.92 15.10 14.90 15.26 Ρ 3.2 3.5 3.5 3.2 3.3 0.5 0.9 1.6 3.0 0.4 1.7 1.2 3.0 0.6 1.2 1.3 2.4 FIN 102.34 108.06 114.10 118.35 24.57 25.18 25.26 25.78 26.16 26.18 26.94 27.32 27.66 28.13 28.38 28.70 28.94 28.91=
Jr
eurostal
Produit intérieur brut
Mrd euro(')
1995
s
151.08 153.74 158.16 161.61 44.29 44.46 44.62 44.97 45.05 45.26 45.33 45.85 46.43 46.02 46.87 47.18 47.84 UK 881.73 912.69 933.14 943.80 216.62 218.36 219.49 220.88 222.87 225.31 227.23 229.48 230.55 231.80 232.88 234.12 234.23 234.53 235.71 US 5749.29 5975.32 6207.21 6336.75 1402.31 1413.85 1434.79 1442.20 1457.22 1472.34 1486.68 1502.03 1513.00 1533.56 1540.53 1554.48 1577.32 1594.15 1601.28 JP 4130.03 4187.45 4066.03 4088.97 1000.21 1029.65 1032.05 1034.99 1051.17 1068.38 1041.81 1052.56 1042.78 1030.09 1022.62 1019.66 1011.21 1031.19 1033.48Evolution du produit intérieur
brut volume
(T/T1 %)
FIN 4.1 5.6 5.6 3.7 0.2 2.5 0.3 2.1 1.5 0.1 2.9 1.4 1.2 1.7 0.9 1.1 0.9 0.1 S 1.3 1.8 2.9 2.2 0.6 0.4 0.4 0.8 0.2 0.5 0.2 1.1 1.3 0.9 1.9 0.7 1.4 UK 2.6 3.5 2.2 1.1 0.6 0.8 0.5 0.6 0.9 1.1 0.9 1.0 0.5 0.5 0.5 0.5 0.1 0.1 0.5 US 3.5 3.9 3.9 2.1 0.7 0.8 1.5 0.5 1.0 1.0 1.0 1.0 0.7 1.4 0.5 0.9 1.5 1.1 0.5 JP 5.2 1.4 2.9 0.6 0.8 2.9 0.2 0.3 1.6 1.6 2.5 1.0 0.9 1.2 0.7 0.3 0.8 2.0 0.2OVor 1/1/1999 un ECU
Die Daten für EU15 und EUR11 wurden in einer zusammenhängenden Weise errechnet, die alle verfügbaren Daten der Mitgliedstaaten. die vierteljährliche Ergebnisse bereitstellen, verwendet.
Vierteljährliche Daten : NL. A, P. US und JP Inlandskonzept Jährliche Daten : A, EL, L und Ρ Inlandskonzept
OECU before 1/1/1999
Data for EU15 and EUR11 are calculated statistically using data available from those Member States which compile quaterly accounts.
Quaterly data : NL, A, P, US and JP under national concept Annually data : A, EL, L and Ρ under national concept
OECU avant 1/1/1999
Les données d'EU15 et EUR11 sont calculées selon un cadre statistique utilisant comme indicateurs les données de tous les Etats membres qui élaborent une comptabilité trimestrielle. Données trimestrielles : NL, A, P, US et JP en concept national
VOLKSWIRTSCHAFTLICHE GESAMTRECHNUNGEN ESVG 95
NATIONAL ACCOUNT ESA 95
COMPTES NATIONAUX SEC 95
m
eurostat
1995 IV
1 9 9 6 I
I
IV 1997 I
1998 I IV
III IV
Privater Endverbrauch
0103
MrdEuroO
1995
Private final consumption
Bn euro(")
1995
Consommation finale privée
Mrd euro(')
1995
EU-15 EUR-11 Β DK EL IRL NL ΗΝ UK US JP 1996 1997 1998 1999 3773.55 3841.10 3949.93 4054.17 3005.14 3045.56 3129.01 3214.73 115.14 117.74 121.72 124.62 71.58 74.25 76.86 78.41 1076.59 1084.57 1109.41 1138.58 35.46 36.37 37.02 37.76 272.67 280.72 292.26 303.02 668.00 669.26 691.93 711.13 25.16 26.75 28.95 31.12 497.35 509.93 519.33 528.58 5.99 6.14 6.25 6.41 161.88 164.20 166.13 172.13 101.45 102.19 103.89 106.16 37.12 38.24 40.37 41.94 52.90 54.44 57.43 59.63 74.40 75.89 77.85 79.95 567.84 589.94 609.77 623.37 3908.13 4040.63 4237.79 4388.75 2431.42 2456.10 2428.45 2411.03
1999 I
930.62 938.91 940.19 945.98 948.47 951.94 958.97 960.60 969.59 978.18 9B4.67 990.80 996.28 1004.34 1007.74 742.90 748.66 748.81 753.49 754.18 756.30 760.44 761.10 767.72 774.83 779.87 785.41 788.91 794.68 795.81 28.64 28,70 28.78 28.76 28.92 29.20 29.33 29.51 29.73 30.43 30.32 30.53 30.46 31.18 17.55 17.72 17.77 17.94 18.13 18.23 18.72 18.39 18.88 18.97 19.17 19.28 19.44 19.52 267.75 267.85 268.60 269.83 270.31 270.84 272.18 270.52 272.23 275.97 275.75 278.15 279.17 281.20 279.92 67.32 67.77 67.49 68.60 68.91 69.16 69.79 70.42 71.45 71.93 73.09 73.50 73.84 74.90 164.58 167.64 166.45 168.13 166.00 166.05 166.32 167.40 169.75 170.95 173.17 174.15 175.24 175.64 176.69 123.17 123.63 123.77 124.41 125.46 126,20 127.65 127.90 128.10 128.71 129.63 130.23 130.53 131.21 46.03 46.34 46.43 47.00 47.24 47.54 48.04 48.12 48.97 49.38 50.06 50.73 51.13 51.82 25.20 25.84 26.33 25.84 26.31 26.58 26.64 26.88 27.11 27.17 27.49 27.64 27.67 27.87 9.05 9.28 9.26 9.25 9.34 9.47 9.49 9.59 9.69 9,90 10.09 10.15 10.22 12.89 13.21 13.14 13.16 13.41 13.48 13.55 13.58 13.85 14.05 14.23 14.42 14.75 14.64 23.24 23.39 23.22 23.58 23.60 23.61 24.02 23.99 24.07 24.19 24.40 24.69 24.88 138.26 140.40 141.44 142.23 143.69 144.75 146.99 148.24 149.88 151.06 152.10 152.45 154.07 156.08 158.17 955.73 964.38 975.58 980.04 987.09 997.54 1001.50 1016.77 1023.76 1038.99 1054.43 1065.03 1078.23 1095.88 1108.19 601.04 609.81 607.93 608.81 615.59 637.56 605.43 614.91 609.04 611.08 610.23 609.38 608.46 616.05 621.19 1995 1996
IV
IV
1997 IIV
1998 IIV
Veränderung des privaten
0104
EndverbrauchVolumen
(T/T1 %)
Changes in private final
consumptionvolume terms
EU-15 EUR-11 DK EL IRL
(TT1%)
I L NL
Evolution de la consommation
finale privée volume
(T/T-1 %)
FIN UK
1999 I
0.1 0.9 0.1 0.6 0.3 0.4 0.7 0.2 0.9 0.9 0.7 0.6 0.6 0.8 0.3 0.0 0.8 0.0 0.6 0.1 0.3 0.6 0.1 0.9 0.9 0.7 0.7 0.5 0.7 0.1 0.5 0.2 0.3 -0.1 0.5 1.0 0.4 0.6 0.7 2.4 -0.4 0.7 -0.3 2.4 0.2 1.0 0.3 0.9 1.1 0.6 2.7 1.8 2.7 0.5 1.1 0.6 0.8 0.4 0.3 0.0 0.3 0.5 0.2 0.2 0.5 0.6 0.6 1.4 0.1 0.9 0.4 0.7 0.5 0.9 0.7 0.4 1.6 0.4 0.4 0.9 0.9 1.5 0.7 1.6 0.6 0.5 1.4 0.2 1.9 0.7 1.0 -1.3 0.0 0.2 0.7 1.4 0.7 1.3 0.6 0.6 0.2 0.6
0 3 0.4 0.1 05 0.9 0.6 1.1 02 0.2 0.5 08 0.5 02 05 0.2 0.7 0.2 1.2 0.5 0.6 1.1 0.2 1.8 0.8 1.4 1.3 0.8 1.4 0.6 2.6 1.9 1.9 1.8 1.0 0.2 0.9 0.9 0.2 1.2 0.6 0.1 0.8 0.6 2.6 0.2 0.1 1.0 1.4 0.3 1.0 1.0 2.2 2.0 0.6 0.7 1.4 2.4 0.5 0.2 2.0 0.5 0.5 0.3 2.0 1.5 1.3 1.3 2.3 0.8 0.5 0.6 0.7 1.6 0.1 0.0 1.7 0.1 0.3 0.5 0.9 1.2 0.8 1.0 1.6 0.7 0.6 1.0 0.7 1.6 0.9 1.1 0.8 0.7 0.2 1.1 1.3 1.3
us
0.6 0.9 1.2 05 0.7 1.1 0.4 1.5 0.7 1.5 1.5 1.0 1.2 1.6 1.1 JP 1996 1997 1998 1999 1.7 1.8 2.8 2.6 1.4 1.3 2.7 2.7 1.2 2.3 3.4 2.4 3.0 3.7 3.5 2.0 0.8 0.7 2.3 2.6 1.9 2.6 1.8 2.0 2.1 3.0 4.1 3.7 1.3 0.2 3.4 2.8 6.1 6.3 8.3 7.5 0.9 2.5 1J3 18 2.1 2.5 1.8 2.5 4.0 1.4 1.2 3.6 2.0 0.7 1.7 2.2 2.5 3.0 5.6 3.9 3.5 2.9 5.5 3.8 1.3 2.0 2.6 2.7 3.6 3.9 3.4 2.2 3.2 3.4 4.9 3.6 3.0 1.0 1.1 0.7 0.4 1.5 0.3 0.2 1.1 3.6 -5.0 1.6 -1.0 0.3 0.1 0.1 0.2 1.3 0.8(*)Vor 1/1/1999 un ECU
Die Daten für EU15 und EUR11 wurden in einer zusammenhängenden Weise errechnet, die alle verfügbaren Daten der Mitgliedstaaten, die vierteljährliche Ergebnisse bereitstellen, verwendet.
Vierteljahrliche Daten : NL, A, P, US und JP Inlandskonzept Jahrliche Daten : A, EL, L und Ρ Inlandskonzept
(*)ECU before 1/1/1999
Data for EU15 and EUR11 are calculated statistically using data availablefrom those Member States which compile quaterly accounts.
Quaterly data : NL, A, P, US and JP under national concept Annually data : A, EL, L and Ρ under national concept
(*)ECU avant 1/1/1999
VOLKWIRTSCHAFTLICHE GESAMTRECHNUNGEN ESVG 95
NATIONAL ACCOUNTS ESA 95
COMPTES NATIONAUX SEC 95
1996 1997 1998 1999 1995 1996 1997 1998 1999 V II V II V II V I
0105
EU15 1360.85 1362.06 1378.64 1399.41 338.60 337.57 339.60 341.26 342.42 339.84 340.27 341.31 340.64 344.15 344.64 345.02 344.83 349.22 350.38Endverbrauch des Staates
Mrd Euro(")
1995
EUR11 1096.21 1099.94 1113.25 1127.87 273.15 271.83 273.25 275.01 276.11 274.34 274.85 275.61 275.14 278.28 278.44 278.60 277.93 281.62 28252 B 46.24 46.02 47.14 47.73 11.42 11.50 11.58 11.62 11.55 11.50 11.50 11.48 11.54 11.70 11.70 11.84 11.92 11.95 DK 36.66 37.05 38.14 38.75 9.04 9.10 9.14 9.23 9.20 9.23 9.26 9.28 9.29 9.45 9.51 9.57 9.63 9.58 D 380.41 376.10 377.84 382.11 96.13 94.00 94.69 95.92 95.87 94.42 94.16 94.26 93.36 95.49 94.85 94.48 93.14 95.60 95.22 EL 6.85 6.82 6.85 6.78 E 81.78 83.37 84.55 86.21 20.28 20.42 20.36 20.30 20.73 20.67 20.86 20.91 20.97 21.06 21.19 21.22 21.13 21.24Final consumption of general
government
Bn euro(*)1995
F 290.08 294.89 298.23 300.56 71.31 72.03 72.38 72.56 73.03 73.29 73.53 73.90 74.02 74.27 74.48 74.49 74.63 74.90 75.19 IRL 5.77 6.05 6.23 6.48 I 151.86 151.07 152.91 154.94 37.62 37.77 37.90 38.11 38.07 37.82 37.76 37.73 37.75 37.85 38.08 38.28 38.68 39.12 L 1.42 1.42 1.43 1.48 NL 75.94 78.47 81.06 83.49 10.94 10.92 11.14 11.08 11.14 11.10 11.18 11.30 11.35 11.42 11.45 11.56 11.62 11.72 A 35.83 34.43 34.87 35.39 8.93 8.94 8.94 8.96 8.98 8.60 8.58 8.62 8.63 8.68 8.76 8.68 8.74 8.70-Jf
eurostal
Commation finale des administrations
publiques
Mrd euro(")1995
P 9.36 9.56 9.87 10.07 2.32 2.33 2.34 2.35 2.36 2.37 2 . 3 2.40 2.42 2.44 2.46 2.48 2.49 FIN 23.01 23.68 24.01 24.31 5.69 5.70 5.74 5.76 5.81 5.84 5.92 5.96 5.98 5.93 6.01 6.04 6.05 5.98 S 40.31 39.48 40.22 40.60 11.30 11.22 11.27 11.58 11.47 11.02 11.09 11.34 11.17 11.27 11.32 11.41 11.48 UK 172.32 169.92 171.59 176.74 42.54 42.70 43.28 43.12 43.22 42.41 42.39 42.67 42.44 42.59 42.78 42.94 43.28 43.99 44.28 US 875.77 887.28 896.80 911.12 215.40 216.35 219.98 219.74 219.53 220.09 222.17 222.22 222.63 221.22 224.45 224.20 226.76 226.66 226.78 JP 393.01 398.98 401.48 404.75 97.70 98.21 98.04 97.85 100.76 98.28 100.80 101.98 99.78 100.48 100.64 101.41 100.84 101.62 101.17Veränderung des Endverbrauch des
0106 Staates Volumen
(T/T1 %)
EU15 EUR11 DK EL
Changes in the final consumption of
general government volume terms
(T/T-1 %)
Evolution de la consommation finale
des administrations publiques volume
(T/T-1 %)
IRL NL FIN UK US JP 1996
1997 1998 1999 1995 IV 1996 I
IV 1997 I
1998 I
IV 1999 I 1.8 0.1 1.2 1.5 1.1 0.3 0.6 0.5 0.3 0.8 0.1 0.3 0.2 1.0 0.1 0.1 0.1 1.3 0.3 1.8 0.3 1.2 1.3 1.3 0.5 0.5 0.6 0.4 0.6 0.2 0.3 0.2 1.1 0.1 0.1 0.2 1.3 0.3 2.4 0 5 2.4 1.3 1.0 0.7 0.7 0.3 0.6 0.4 0.0 0.2 0.5 1.4 0.0 1.2 0.7 0.3 3.2 1.1 3.0 1.6 1.4 0.7 0.4 1.0 0.3 0.3 0.3 0.3 0.1 1.7 0.6 0.6 0.6 0.5 2.2 1.1 0.5 1.1 3.1 2.2 0.7 1.3 0.1 1.5 0.3 0.1 1.0 2.3 0.7 0.4 1.4 2.6 0.4 1.C 0.4 0.4 1.C 1.3 1.9 1.4 2.0 0.3 0.7 0.3 0.3 2.1 0.3 0.9 0.3 0.3 0.4 0.6 0.2 0.4 0.6 2.3 1.7 1.1 0.8 0.1 1.0 0.5 0.2 0.7 0.4 0.3 0.5 0.2 0.3 0.3 0.0 0.2 0.4 0.4 1.5 4.8 3.0 4.C
1.4 E 0.5 C 1.2 C 1.3 : 0.8 0.4 0.4 0.5 0.1 0 7 0.1 0.1 0.1 0.3 0.6 0.5 1.0 1.1
.1 0.4 .3 3.3 .5 3.3 .5 3.0 0.3 0.2 2.0 0.6 0.6 0.3 0.7 1.1 : 0.5 0.6 0.3 0.9 0.5 0.9 0.6 3.9 1.3 1.5 0.2 0.1 0.0 0.2 0.2 1.3 0.2 0.4 0.2 0.7 0.9 0.9 0.6 0.4 1.8 2.1 3.3 2.1 0.5 0.4 0.4 0.4 0.4 0.5 0.6 0.7 0.9 1.0 0.9 0.7 0.6 2.5 2.9 1.4 1.2 0.7 0.3 07 0.3 0.9 0.4 1.4 0.7 0.4 0.9 1.3 0.6 0.2 1.3 0.2 2.1 1.9 0.9 0.8 0.7 0.4 2.7 0.9 3.9 0.7 2.2 1.5 0.9 0.4 0.8 0.6 1.7 1.4 1.0 3.0 0.5 0.4 1.4 0.4 0.2 1.9 0.1 0.7 0.5 0.4 0.4 0.4 0.8 1.7 0.7 0.7 1.3 1.1 1.6 1.4 0.4 1.7 0.1 0.1 0.3 1.0 0.0 0.2 0.6 1.5 0.1 1.1 0.1 0.1 1.8 1.5 0.6 0.8 0.5 0.5 0.2 0.2 3.0 2.5 2.6 1.2 2.2 0.7 0.2 0.8 0.6 0.8 0.4
(')Vor 1/1/1999 un ECU
Die Daten für EU15 und EUR11 wurden in einer zusammenhängenden Weise errechnet, die alle verfügbaren Daten der Mitgliedstaaten. die vierteljährliche Ergebnisse bereitstellen, verwendet.
Vierteljahrliche Daten : NL, A. P, US und JP Inlandskonzept Jahrliche Daten : A, EL, L und Ρ Inlandskonzept
C)ECU before 1/1/1999
Data for EU15 and EUR11 are calculated statistically using data availablefrom those Member States which compile quaterly accounts.
Quaterly data : NL, A, P, US and JP under national concept Annually data : A. EL, L and Ρ under national concept
(')ECU avant 1/1/1999
Les données d'EU15 et EUR11 sont calculées selon un cadre statistique utilisant comme indicateurs les données de tous les Etats membres quiélaborent une comptabilité trimestrielle. Données trimestrielles : NL, A, P, US et JP en concept national
VOLKSWIRTSCHAFTLICH GESAMTRECHNUNGEN ESVG 95
NATIONAL ACCOUNTS ESA 95
COMPTES NATIONAUX SEC 95
m
eurostat
1996 1997 1998 1999 1995 IV 1996 III III IV 1997 I
II III IV 1998 I
II III IV 1999 I
II
0107
EU-15 1308.21 1345.90 1414.10 1462.57 322.47 319.50 328.24 330.39 330.07 327.52 335.77 338.60 344.02 350.82 347.90 356.93 358.45 366.90 367.69Bruttoanlageinvestitionen
Mrd Euro( )
1995
EUR-11 1093.57 1116.96 1163.60 1203.82 270.69 266.85 274.78 276.21 275.72 272.90 278.62 280.70 284.73 289.36 286.81 293.50 293.93 301.40 301.84 Β 43.23 45.97 47.64 49.25 10.78 10.72 10.74 10.79 11.00 10.95 11.99 11.22 11.81 11.55 11.80 12.20 12.10 12.10 DK 26.90 29.67 31.78 32.59 6.71 6.46 6.60 6.84 7.04 7.07 7.47 7.59 7.62 8.03 7.83 7.99 8.02 8.40 D 417.32 419.29 425.18 432.67 103.98 99.55 106.28 106.49 105.80 103.61 104.94 105.85 105.90 107.50 104.14 106.92 105.69 109.00 108.36 EL 10.7E 11.BC 12.98 14.36 E 100.21 105.28 114.98 124.60 24.58 24.44 24.99 25.81 24.98 25.40 26.13 26.72 27.05 27.86 27.96 29.12 30.05 30.50 F 223.24 224.36 237.11 246.74 55.89 55.75 55.92 55.91 55.84 55.01 55.87 56.35 57.28 58.05 59.15 60.11 60.80 62.14 62.76Gross fixed capital
Bn euro(")
1995
IRL 7.8E 8.71 9.8E 10.97 I 157.38 158.77 164.25 168.94 39.40 39.76 39.45 39.09 39.07 39.04 39.43 39.63 40.62 41.20 40.90 41.15 40.98 41.53 L 2.51 2.84 2.90 2.99formation
NL 68.48 72.52 76.32 77.27 14.53 14.94 14.98 15.43 15.89 15.99 16.39 16.38 16.63 16.82 16.77 17.09 17.36 18.19 A 43.08 44.28 46.47 48.52 10.57 10.65 10.74 10.65 10.97 10.87 10.83 11.06 11.42 11.91 11.52 11.55 11.48 12.04 Ρ 16.23 18.14 19.89 21.23 3.92 3.80 3.95 4.05 4.43 4.34 4.51 4.50 4.78 4.86 4.93 4.81 5.29Forrr
FIN 17.19 19.20 20.93 22.33 3.89 4.19 4.21 4.36 4.43 4.36 4.82 4.98 5.05 4.93 5.15 5.38 5.48 5.42ation
s
25.05 23.86 26.15 27.34 6.68 6.75 6.65 6.75 6.58 6.19 6.57 6.27 6.42 6.61 6.96 7.11 7.20brute de capital fixe
Mrd euro(')
1995
UK 147.25 158.36 173.97 178.59 35.30 36.41 36.64 37.06 37.11 37.61 39.50 40.05 41.16 42.51 42.39 44.08 44.94 45.04 45.24 US 1014.81 1087.25 1192.00 1243.42 238.68 245.47 252.76 256.75 259.61 263.50 269.02 276.39 278.11 289.41 296.44 299.12 306.79 316.42 321.68 JP 1245.34 1219.47 1110.00 1054.03 291.20 307.13 315.25 312.45 315.00 313.25 305.74 304.95 299.93 288.57 278.78 274.79 271.86 285.82 281.56 1995 IV 1996 I 1997 IIV
1998 I 1999 IVeränderung der
0108 Bruttoanlageinvestitionen Volumen
(T/T1 %)
Changes in gross fixed capital formation
volume terms
(T/T1 %)
EU-15 EUR-11 DK EL IRL NL
Evolution de la formation
brute de capital fixe volume
(T/T-1 %)
FIN S UK US JP 1996 1997 1998 1999 1.6 2.9 5.1 3.4 0.9 2.1 4.2 3.5 0.9 6.3 3.6 3.4 5.0 10.3 7.1 2.5
1 . 1 0.5 1.4 1.8 8.8 9.6 9.7 10.6 2.0 5.1 9.2 8.4
0 . 0 0.5 5.7 4.1 13.7 10.9 13.0 11.5 2.3 0.9 3.5 2.9
2 . 5 13.2 2.2 3.0 6.3 5.9 5.2 1.3 2.5 2.8 4.9 4.4 5.7 11.8 9.7 6.7 8.4 11.7 9.0 6.7 3.7 4 . 8 9.6 4.6 4.9 7.5 9.9 2.7 7.8 7.1 9.6 4.3 11.6 2 . 1 9 . 0 5 . 0 0.0
-0.9 2.7 0.7 0 . 1 0 . 8 2.5 0.8 1.6 2.0 0 . 8 2.6 0.4 2.4 0.2
-0.1 1 . 4 3.0 0.5 0 . 2 1 . 0 2.1 0.8 1.4 1.6 0 . 9 2.3 0.2 2.5 0.2
0 . 6 0 . 6 0.2 0.5 1.9 -0.4 9.5 -6.4 5.3 -2.2 2.1 3.5 0 . 9 0.1
3.4 3 . 7 2.1 3.6 2.9 0.5 5.7 1.6 0.4 5.4 2 . 5 2.0 0.4 4.7 -1.6 -4.3 6.8 0.2 -0.7 2 . 1 1.3 0.9 0.1 1.5 3 . 1 2.7 1 . 2 3.1 0 . 6
4.0 0 . 6 2.3 3.3 3 . 2 1.7 2.9 2.3 1.2 3.0 0.4 4.2 3.2 1.5 0.4 0 . 3 0.3 0 . 0 0 . 1 -1.5 1.6 0.9 1.7 1.4 1.9 1.6 1.1 2.2 1.0 1.1 09 0 8 0 9 0 0 0 1
0 9 0.7 2.4 1.4 -0.7 0.6 -0.4 1.3 0.1 2.8 0.3 3.0 3.0 0.6 2.5 0 . 1 1.6 1.1 -0.3 1.9 1.6 4.8 0.5 0.8 0.8 0 . 8 3.0 0 . 9 -0.4 2.1 3.2 4.3 -3.3 0.3 0 . 6 4.9
5.7 2 . 9 3.8 2.7 9.2 1 . 8 3.9 -0.3 6.2 1.7 1.4 -2.4 9.9 -3.1 7.7 0.6 3.5 1.5 1 . 6 10.7 3.2 1.4 2 . 4 4.4 4.5 2.0 1 . 1
1.3 1.0 1 . 5 1.5 2 . 6 5 . 9 6.2 1 . 7 2.4 3.1 5.3 2.1 1.3
0 . 5 3.2 0.6 1.1 0.2 1.3 5.0 1.4 2.8 3.3 0 . 3 4.0 1.9 0.2 0.4 1.7 2.8 3.0 1.6 1.1 1.5 2.1 2.7 0.6 4.1 2.4 0.9 2.6 3.1 1.7 3.4 5.5 2.7 0 . 9 0.8 0 . 6 2 . 4 0 . 3 1 . 6 3 . 8 3 . 4 -1.4 1 . 1 5.1 1 . 5
O V o r 1/1/1999 un E C U
Die Daten für E U 1 5 und E U R 1 1 w u r d e n in einer z u s a m m e n h ä n g e n d e n W e i s e errechnet, die alle verfügbaren Daten der Mitgliedstaaten, die vierteljährliche Ergebnisse bereitstellen, verwendet.
Vierteljahrliche Daten : NL, A, P, U S und JP Inlandskonzept Jahrliche Daten : A, EL, L und Ρ Inlandskonzept
C ) E C U before 1/1/1999
Data for E U 1 5 a n d E U R 1 1 are calculated statistically using data availablefrom t h o s e M e m b e r States w h i c h compile quaterly accounts.
Quaterly data : NL, A, P, U S a n d J P under national concept Annually data : A, EL, L a n d Ρ under national concept
C ) E C U avant 1/1/1999
1995 IV 1996 I
I
IV
1997 I1998
IV
IV
VOLKSWIRTSCHAFTLICHE GESAMTRECHNUNGEN ESVG 95
NATIONAL ACCOUNTS ESA 95
COMPTES NATIONAUX SEC 95
m
eurostat
Vorratsveränderungen und
0109 Nettozugang an Wertsachen
MioEuro('H995
Changes in inventories and
acquisitions less disposals of
valuables Mio euro(") 1995
Variations de stocks et acquisitions
moins cessions d'objets de valeur
Mio euroO 1995
EU-15 EUR-11 DK EL IRL NL FIN UK US
1999 I
7031 5667 901 -1922 -785 3673 6616 5602 11212 12438 16274 14121 20102 9082 8841
4682
4113 752 -2488 -843 1671 5347 4715 9708 10725 13671
11568 17975 9161 10771
-11 -815 -209 275 -24 -891 -758 17 435 387 463 472 -535 -720
577 230 288 177 -261 252 82 310 -38 205 319 295 331 -691
-851 1808 -1064 -2606 -1329 1223 957 744 2712 1436 5584
3616 8030 2606 4892
431 207 1022 -83 172
1310 449 -592 172 142 155 929 992 706
913 -845 304 -1621 294 754 -21 693 448 2382 1698 521 2260 1537 1177
2787 2154 -565 920 -687 -542 2883 2559 3666 3270 3184 3051 3857 3359
-217 -323 223 15 -72 -311 168 -51 -21 710 -12 -102 -176
82 173 168 298 217 239 168 279 201 340 361 465 413
197 509 -119 287 245 101 133
-305 65 103 227
148 -233 207
320 39 -128 -286 -73
789 -110 28 748 733 1048 -145 217
1303 1014 -39 556 429 1653 960 540 1348 1237 2074 2197 1354 288 -1658
4217 3364 5603 9988 6513 11655 16267 10942 14044 19117 9526 13141 10657 10752 6715
JP
1996 :
1997 :
1998 1999
-770 -1191 783 690
437 605 1141
1125 -2695
4664 18498 16040
-163 -291 -313 -308
1297 1318 2186
-1693 544 3805
508 681 -2 273
1813 8520 13294
11368 153 141 365 33
647 418 615
190 3202 3861 3822
858 888 1580
1945 -192
488 1307 3597
-510 587 1160 752
1984 4556 6946 1865
25239 50515 52629 51905
14186 12531 8662
337 4762 3188 4080 4766 2524 7221 7933 8190 6235 6429 5499 4285 4107 5612
Vorratsveränderungen und
0110 Nettozugang an Wertsachen(
1)
Volumen% des BIP
EU-15 EUR-11 Β DK
Changes in inventories and
acquisitions less disposals of
valuables(
1)
volume terms% of GDP
EL IRL NL
Variations de stocks et acquisitions
moins cessions d'objets de valeur(
1)
volume %du PIB
FIN UK US JP
1996 1997 1998 1999
1995 IV 1996 I
1997 I
III IV 1998
IV 1999 I
Daten vorläufig nicht verfügbar C)Vor 1/1/1999 un ECU
Die Daten für EU15 und EUR11 wurden in einer zusammenhängenden Weise errechnet, die alle verfügbaren Daten der Mitgliedstaaten, die vierteljährliche Ergebnisse bereitstellen, verwendet.
Vierteljährliche Daten : NL, A. P, US und JP Inlandskonzept
Data currently unavailable C)ECU before 1/1/1999
Data for EU15 and EUR11 are calculated statistically using data availablefrom those Member States which compile quaterly accounts.
Quaterly data : NL. A, P, US and JP under national concept
Données actuellement indisponibles C)ECU avant 1/1/1999
VOLKSWIRTSCHAFTLICHE GESAMTRECHNUNGEN ESVG 95
NATIONAL ACCOUNTS ESA 95
COMPTES NATIONAUX SEC 95
Ξ £
eurostat
996 997 998 999 995 996 997 998 999 V II V II V II V I0111
EU15 2028.54 2224.68 2350.20 2433.10 487.62 498.80 498.98 508.64 522.12 529.88 547.36 568.91 578.53 583.96 590.86 592.28 583.10 582.91 591.95Ausfuhr von Waren und
Dienstleistungen
Mrd Euro(") 1995
EUR-11 1629.43 1790.64 1902.79 1972.46 392.04 401.18 400.21 408.60 419.44 425.24 439.85 458.62 466.93 472.81 479.19 478.99 471.80 472.32 480.15 B 149.72 160.31 165.80 170.90 36.93 37.40 37.37 37.05 37.92 38.59 39.56 41.00 41.19 41.31 42.30 41.26 40.96 39.95 DK 51.20 53.45 54.18 55.70 12.14 12.60 12.94 12.76 12.90 12.93 13.19 13.51 1379 13.66 12.90 14.00 13.61 13.74 D 483.74 536.53 574.02 591.12 116.47 118.55 118.82 121.06 126.19 128.22 131.95 138.20 139.69 142.57 144.82 144.82 140.49 141.72 144.76 EL 8.92 9.39 10.2E 10.84 E 112.46 128.72 138.99 147.30 26.04 27.08 27.31 28.57 29.53 29.87 31.87 33.03 33.99 34.27 34.72 34.89 35.15 36.11 F 276.67 306.32 325.41 336.71 66.90 68.45 68.15 69.27 70.67 72.35 75.21 77.90 80.29 81.01 81.66 82.68 81.53 80.53 82.01
Exports of goods and services
Bn euro(")
1995
IRL 39.61 46.32 55.36 63.5C I 228.98 240.90 243.56 245.99 55.70 57.59 56.13 57.04 58.13 57.59 59.35 61.53 62.34 61.71 61.24 61.14 59.38 59.S2 L 12.34 13.47 14.62 15.4C NL 190.62 207.76 221.05 229.37 41.24 42.13 41.58 43.34 43.21 43.71 44.57 46.28 47.14 47.24 48.34 48.39 48.75 49.32 A 73.05 80.42 86.98 91.14 17.41 17.60 18.03 18.59 18.73 19.39 19.65 20.29 20.97 21.32 22.18 21.36 21.83 21.02 Ρ 23.15 25.03 26.98 28.53 5.57 5.80 5.82 5.78 5.76 6.03 6.26 6.30 6.44 6.69 6.83 6.94 6.52 RN 38.92 44.44 48.73 50.70 9.15 9.18 9.76 9.79 10.21 10.23 10.97 11.76 11.50 12.38 11.96 12.27 12.13 12.16Exportations de biens et
services
Mrd euro(') 1995
s
64.04 72.24 77.51 80.86 18.36 18.60 19.09 19.27 19.88 20.15 21.90 22.24 22.40 22.47 22.71 23.94 23.94 UK 262.55 285.09 290.93 298.09 62.76 63.93 64.89 65.94 67.71 69.17 70.89 72.21 72.74 72.14 73.01 73.45 72.24 71.33 71.76 US 679.80 766.71 778.37 800.41 163.18 164.67 167.02 167.89 179.97 183.59 190.35 195.18 197.30 195.94 192.02 190.68 199.43 196.84 198.94 JP 391.36 436.96 427.19 446.65 92.68 94.77 94.70 99.19 103.81 106.22 110.32 109.98 111.68 108.60 106.46 108.39 104.96 104.99 105.93Veränderung der Ausfuhr von Waren
0112 und Dienstleistungen Volumen
(T/T1 %)
Changes in exports of goods and services
volume terms
(T/T-1 %)
Evolution des exportations de
biens et services volume
(T/T1 %)
EU-15 EUR-11 DK EL IRL I NL FIN UK US JP 1996
1997 1998 1999 1995 IV 1996 I
I 4.8 9.7 5.6 3.5 6.3 3.7 1.2 7.1 3.4 3.1 5.0 4.4 1.4 2.8
5.1 3.1 10.9 5.2 7.0 9.2 3.0 5.7
10.3 14.5 8.0 6.0 3.5 10.7 6.2 3.5
11.8 1.0 17.0 5.2 19.5 1.1 14.7 1.0
6.2 9.2 8.5 5.6 4.6 9.0 6.4 3.8 6.9 10.1 8.2 4.8 7.6 8.1 7.8 5.7 6.1 14.2 9.6 4.0 6.1 12.8 7.3 7.5 8.6 2.1 2.5 8.5 12.8 1.5 2.8 62 11.7 -2.2 4.6 IV 1997 I
I
IV 1998 I
IV 1999 I
1.2 2.3 0.0 1.9 2.7 1.5 3.3 '3.9 1.7 0.9 1.2 0.2 1.6 0.0 1.6 1.1 2.3 0.2 2.1 2.7 1.4 3.4 4.3 1.8 1.3 1.4 0.0 1.5 0.1 1.7 0.9 1.3 0.1 -0.9 2.4 1.8 2.5 3.6 0.5 0.3 2.4 2.5 0.7 2.5 0.3 3.8 2.7 1.4 1.1 0.2 2.0 2.4 2.1 0.9 5.6 8.5 -2.8 1.0 1.6 1.8 0.2 1.9 4.2 1.6 2.9 4.7 1.1 2.1 1.6 0.0 3.0 0.9 2.2 2.4 4.0 0.9 4.6 3.4 1.2 6.7 3.7 2.9 0.8 1.3 0.5 0.8 2.7 0.4 2.3 0.4 1.7 2.0 2.4 4.0 3.6 3.1 0.9 0.8 1.3 1.4 1.2 1,8 -0.6 3.4 -2.6 1.6 1.9 0.9 3.1 3.7 1.3 -1.0 0.8 0.2 2.9 C.9 1.6 2.2 1.3 4.2 0.3 1.2 2.0 3.9 1.9 0.2 2.3 0.1 0.8 1.2 2.2 1.1 2.5 3.1 0.8 3.5 1.3 3.3 3.3 1.7 4.1 3.7 2.2 3.7 3.9 4.2 0.2 -0.7 -0.3 4.7 3.8 0.7 2.3 3.9 2.0 1.7 -6.1 2.7 0.3 6.3 0.3 4.3 0.2 7.3 7.1 -2.1 7.7 -3.4 2.6 1.1 0.2 0.8 1.3 2.7 1.0 3.2 1.4 8.7 1.6 0.7 0.3 1.1 5.4 0.0 1.6 1.9 1.5 1.6 2.7 2.2 2.5 1.9 0.7 0.8 1.2 0.6 1.7 1.3 0.6 2.5 0.9 1.4 0.5 7.2 2.0 3.7 2.5 1.1 0.7 2.0 0.7 4.6 1.3 1.1 0.3 2.3 0.1 4.7 4.7 2.3 3.9 -0.3 1.6 2.8 2.0 1.8 3.2 0.0 0.9
C)Vor 1/1/1999 un ECU
Die Daten für EU15 und EUR11 wurden in einer zusammenhängenden Weise errechnet, die alle verfügbaren Daten der Mitgliedstaaten, die vierteljährliche Ergebnisse bereitstellen, verwendet.
Vierteljahrliche Daten : NL, A, P, US und JP Inlandskonzept Jahrliche Daten : A, EL, L und Ρ Inlandskonzept
C)ECU before 1/1/1999
Data for EU15 and EUR11 are calculated statistically using data availablefrom those Member States which compile quaterly accounts.
Quaterly data : NL, A, P, US and J Ρ under national concept Annually data : A, EL, L and Ρ under national concept
C)ECU avant 1/1/1999
VOLKSWIRTSCHAFTLICHE GESAMTRECHNUNGEN ESVG 95
NATIONAL ACCOUNTS ESA 95
COMPTES NATIONAUX SEC 95
1996 1997 1998 1999 1995 IV 1996 I
II III IV 1997 I
II III IV 1998 I
II III IV 1999 I
II
0113
EU-15
26.55 27.89 30.42 33.27 34.8C 35.37 36.61 44.46 38.25 30.45 30.46 27.05 16.86 13.89 15.0C
Außenhandelssaldo
Mrd Euro(")
1995
EUR-11 120.39 150.69 122.98 113.23 24.71 26.83 28.82 32.06 32.94 33.19 36.03 42.76 38.97 33.43 34.42 31.62 24.04 22.23 22.59
Β 8.94 11.07 8.71 8.01 2.01 2.66 2.09 1.95 2.24 2.88 2.72 3.16 2.31 1.78 2.47 1.76 2.70 2.26
DK 6.30 4.13 0.93 0.76 0.68 1.57 1.77 1.51 1.46 1.12 1.09 0.92 1.01 0.32 0 . 1 0 0.59 0.11 0.63
D 22.76 37.24 32.30 29.70 4.65 3.95 5.29 6.25 7.10 6.83 8.92 11.43 10.47 9.45 9.50 8.55 4.38 4.70 4.38
EL 5.69 5.9S 6.0C 6.34
E 1.32 3.67 0 . 8 4 0.01 0 . 3 4 0.29 0 . 1 2 0.33 0.83 O.02 1.07 1.51 1.12 0.77 0.27 0 . 7 0 1 . 1 8 1 . 4 2
F 21.57 35.41 30.92 25.58 4.31 4.62 4.62 6.15 6.41 7.68 9.02 8.97 9.10 7.85 7.66 8.37 6.61 6.59 6.88
External trade balance
Bn euro(')
1995
IRL 9.88 12.23 14.01 15.94
I 37.90 30.56 20.55 20.08 7.50 8.61 10.43 9.50 9.33 8.34 6.74 8.12 7.34 5.44 5.37 5.80 3.93 3.16
L 1.24 1.23 1.25 1.4C
NL 20.04 21.87 20.86 20.35 5.47 5.62 5.08 5.68 4.99 5.44 5.00 6.04 5.83 5.08 5.89 5.28 5.35 5.10
A 0 . 3 9 0.59 1.61 1.12 0 . 0 9 0 . 2 4 0 . 3 5 0.14 0.04 0.01 0.19 0.16 0.18 0.47 0.83 0.10 0.22 0.11
Ρ 7 . 3 7 8 . 6 6 11.54 1 3 . 0 9 1 . 4 7 1 . 6 2 1 . 6 2 2 . 0 8 2 . 0 6 2 . 0 8 1 . 9 8 2 . 3 6 2.24 2 . 6 2 2 . 7 4 3 . 0 1 3 . 1 6
[Ξ
VA
eurostat
Solde du commerce extérieur
Mrd euro(")
1995
FIN 8.26 10.29 11.37 11.22 1.86 1.52 2.27 2.24 2.24 2.26 2.41 3.01 2.60 3.04 2.73 2.73 2.88 2.82
S 11.82 13.91 12.78 12.96 2.75 3.07 3.61 3.35 3.47 3.65 4.06 4.23 4.02 3.21 3.14 4.12 4.06
UK 7 . 6 8 1 0 . 0 8 2 9 . 1 2 28.25 0 . 7 8 2 . 1 3 1 . 7 9 2 . 0 5 1 5 6 1 . 1 2 2 . 5 7 1 . 9 9 ^1.22 5 . 5 1 6 . 3 7 7 . 4 4 9 . 2 6 1 0 . 6 8 10.11
us
7 3 . 9 9 9 0 . 5 3 158.40 152.39 11.72 15.71 19.15 2 4 . 3 2 1 5 . 5 3 2 0 . 4 4 2 2 . 2 8 2 4 . 3 0 2 5 . 5 4 3 5 . 1 7 ^14.31 ^17.01 ^15.11 5 5 . 5 6 6 2 . 0 9
JP 30.55 100.69 130.43 135.42 9.94 9.74 7.63 11.79 15.06 16.77 22.61 22.79 25.85 23.72 26.55 28.58 25.76 23.60 23.94
Außenhandelssaldo(
1)
0114
Volumen
% des BIP
EU-15 EUR-11 DK EL
External trade balanced)
volume terms
% of GDP
IRL NL
Solde du commerce extérieur(
1)
volume
% du PIB
FIN UK US JP
1996 1997 1998 1999 1995 IV 1996 I
1997 I
IV
1998 IIV
1999 I( ' ) D a t e n vorläufig nicht verfügbar C)Vor 1/1/1999 un ECU
Die Daten fur E U 1 5 und E U R 1 1 w u r d e n in einer z u s a m m e n h ä n g e n d e n W e i s e errechnet, die alle verfügbaren Daten der Mitgliedstaaten, die vierteljährliche Ergebnisse bereitstellen, verwendet.
( ' ) D a t a currently unavailable C ) E C U before 1/1/1999
Data for E U 1 5 and E U R 1 1 are calculated statistically using data availablefrom those M e m b e r States w h i c h compile quaterly accounts.
(1) D o n n é e s actuellement indisponibles C ) E C U avant 1/1/1999