Copyright © 1998, American Society for Microbiology. All Rights Reserved.
Evolution of Hypervariable Region 1 of Hepatitis C Virus
in Primary Infection
ALDO MANZIN,1* LAURA SOLFOROSI,1ENZO PETRELLI,2GIAMPIERO MACARRI,3
GRAZIA TOSONE,4MARCELLO PIAZZA,4ANDMASSIMO CLEMENTI5
Istituto di Microbiologia1and Clinica di Gastroenterologia,3Universita` di Ancona, Ancona, Divisione di Malattie Infettive, Ospedale S. Salvatore, Pesaro,2Clinica di Malattie Infettive, Universita` di Napoli Federico II,
Naples,4and Dipartimento di Scienze Biomediche, Universita` di Trieste, Trieste,5Italy
Received 12 December 1997/Accepted 25 March 1998
The hypervariable region 1 (HVR-1) of the putative envelope encoding E2 region of hepatitis C virus (HCV) RNA was analyzed in sequential samples from three patients with acute type C hepatitis infected from different sources to address (i) the dynamics of intrahost HCV variability during the primary infection and (ii) the role of host selective pressure in driving viral genetic evolution. HVR-1 sequences from 20 clones per each point in time were analyzed after amplification, cloning, and purification of plasmid DNA from single colonies of transformed cells. The intrasample evolutionary analysis (nonsynonymous mutations per nonsynonymous site
[Ka], synonymous mutations per synonymous site [Ks], Ka/Ksratio, and genetic distances [gd]) documented low
gd in early samples (ranging from 2.11 to 7.79%) and a further decrease after seroconversion (from 0 to 4.80%), suggesting that primary HCV infection is an oligoclonal event, and found different levels and dynamics of host
pressure in the three cases. The intersample analysis (pairwise comparisons of intrapatient sequences; rKa,
rKs, rKa/rKsratio, and gd) confirmed the individual features of HCV genetic evolution in the three subjects and
pointed to the relative contribution of either neutral evolution or selective forces in driving viral variability, documenting that adaptation of HCV for persistence in vivo follows different routes, probably representing the molecular counterpart of the viral fitness for individual environments.
Hepatitis C virus (HCV), a positive-strand RNA virus of about 9.4 kb (3, 4, 9) included in the family Flaviviridae (21), is the major causative agent of non-A, non-B acute and chronic hepatitis. After primary HCV infection, progression to viral persistence is observed in most patients (1, 28). The HCV genome in persistently infected hosts is described as a dynamic population of heterogeneous, closely related variants desig-nated quasispecies (11, 15, 20). Recent biological and molec-ular data strongly suggest that HCV variability plays a crucial role in escaping the host immune surveillance and establishing the chronic carrier state (8, 11, 12, 29–31). A high degree of variability has been revealed in two discrete sequences of the putative envelope-encoding E2 region of HCV RNA, which have been designated hypervariable regions 1 and 2 (HVR-1 and HVR-2). Notably, the 27-amino-acid HVR-1, located in the N-terminal portion of the HCV envelope protein, bears major neutralizing epitopes (25, 34). More recently, the role of the humoral immune response to HCV in driving viral genetic variability has been studied in vivo by analyzing chronically infected, immunocompromised patients (14, 16, 23); the re-sults support the general hypothesis that the immune response acts as a major selective force during HCV persistence, even though the involvement of different, nonimmunological mech-anisms, as observed in other RNA viruses (5), cannot be ex-cluded.
The error-prone nature of viral RNA polymerases provides the biochemical basis for the variability observed in most RNA viruses. However, conflicting hypotheses have been advanced to explain the mechanisms of viral evolution in infected hosts; these include mutation-driven evolution (27), neutral
evolu-tion (7), and viral fitness for a selective environment. One method for the evaluation of the selective pressure envisages the analysis of Kaand Ksvalues and the Ka/Ksratio, where Ka
is the frequency of nonsynonymous (antonymous) substitutions per nonsynonymous site and Ksis the frequency of synonymous
substitutions per synonymous site (17, 18); the higher the Ka/Ks
ratio, the stronger the selective pressure for amino acid changes. In this study, we addressed the intrahost variability of HCV HVR-1 in three patients infected with acute type C hepatitis from different sources, aiming at evaluating the relevant fea-tures and dynamics of virus variability before and after a spe-cific immune response is elicited. The three Italian patients (indicated here as A, B, and C) included in this study at the onset of acute type C hepatitis were observed over a period of 12 months (patient A), 9 months (patient B), and 12 months (patient C). Patient A (female, 14 years old) was infected by a blood transfusion (2 units); patient B (female, 40 years old), a medical doctor, was infected via a transmucosal (conjunctival) blood splash from an infected subject; and patient C (male, 32 years old) was infected after a surgical intervention (gastrec-tomy).
Antibodies to HCV were detected by a third-generation enzyme-linked immunosorbent assay (HCV 3.0 ELISA; Ortho Diagnostic Systems, Raritan, N.J.) and a recombinant immu-noblot assay (Chiron RIBA 3; Ortho Diagnostic Systems). For molecular analysis, total RNA was purified from EDTA-treat-ed plasma by the guanidinium thiocyanate method (2); HCV genotyping was performed on all plasma samples by nested PCR of the core region as described by Okamoto et al. (24), with minor modifications for better detection of Italian HCV types (26); while quantitation of HCV RNA molecules in plas-ma samples was performed by quantitative competitive reverse transcription-PCR (cRT-PCR), as previously described (19).
Acute type C hepatitis was diagnosed on the basis of (i) the presence of clinical and biochemical signs of overt liver injury,
* Corresponding author. Mailing address: Institute of Microbiology, University of Ancona, via Pietro Ranieri, I-60100 Ancona, Italy. Phone: 39 71 596 4849. Fax: 39 71 596 4852. E-mail: manzin@popcsi .unian.it.
6271
on November 9, 2019 by guest
http://jvi.asm.org/
(ii) detection of HCV RNA in the first available plasma sam-ple, and (iii) absence of specific anti-HCV antibodies (by ELISA) in the first sample and compatible dynamics of anti-HCV an-tibodies in subsequent sequential samples. Other markers of viral hepatitis (types A, B, D, and E) and antibodies to human immunodeficiency virus type 1 tested negative in commercially available ELISAs; absence of anti-nuclear antibodies, mito-chondrial antibodies, smooth muscle antibodies, and liver kid-ney microsomal antibodies was documented by indirect im-munofluorescence assays. Other causes of liver disease (i.e., Wilson’s disease, hemochromatosis,a1-antitrypsin deficiency) were excluded by specific laboratory tests. Hepatotoxic drug intake and intravenous drug use were excluded by personal and familial anamnestic data. Liver tests, including alanine amino-transferase (ALT) levels in serum, were performed at the first clinical examination and repeated monthly during follow-up.
For sequence analysis, amplified sequences of the N termi-nus of the E2/NS1 region (HVR-1) were obtained by cRT-PCR with primer sets specific for this region. Two primers encom-passing a 612-bp sequence of the E1/E2 HCV region were used (from nucleotides 1278 to 1889; sense primer 59-ATA ACG GGT CAC CGA TGG CAT GGG ATA T; antisense primer
59-CAC CAC CAC GGG GCT GGG AGT GAA GCA AT).
The amplified product was directly ligated to pCR-Script SK(1) plasmid vector (Stratagene, La Jolla, Calif.). After transforma-tion, transformant colonies were streaked onto a fresh dish; plasmid DNA from single colonies was extracted and purified from overnight-cultured minipreps by the Wizard DNA puri-fication system (Promega, Madison, Wis.). The sequences of the inserted DNAs were determined in 20 independent clones derived from each region by fluorescence-labeled dideoxynu-cleotides with an automated sequencer (model 373A; Perkin-Elmer, Norwalk, Conn.), using the sequencing conditions spec-ified in the protocol for the DyeDeoxy Terminator Cycle Sequencing Kit (Perkin-Elmer), and with Ampli-Taq DNA poly-merase FS (Perkin Elmer), and the above-mentioned HCV-spe-cific oligonucleotides (both sense and antisense) as bidirectional sequencing primers. Nucleotide and amino acid sequences were aligned with the MEGALIGN program (DNASTAR, Madison, Wis.), and analysis of the selective pressure was performed for all sequences by the method described by Nei
and Gojobori (22). In the absence of any reliable ancestor, a general consensus sequence was computed for all sequences from each patient, and each clone sequence was compared with this consensus. The Kaand Ksvalues and the Ka/Ksratio
were calculated with the MEGA program for all sequences (13); the mean Ka/Ksratio for all the clones from each sample
was taken as representative of the sample. The distance matrix was generated by Kimura’s two-parameter model (6). Phylo-genetic trees were constructed by the neighbor-joining method, and their reliability was assessed by bootstrap resampling (1,000 data sets). These methods were implemented with software from the MEGA and PHYLIP 3.5c packages.
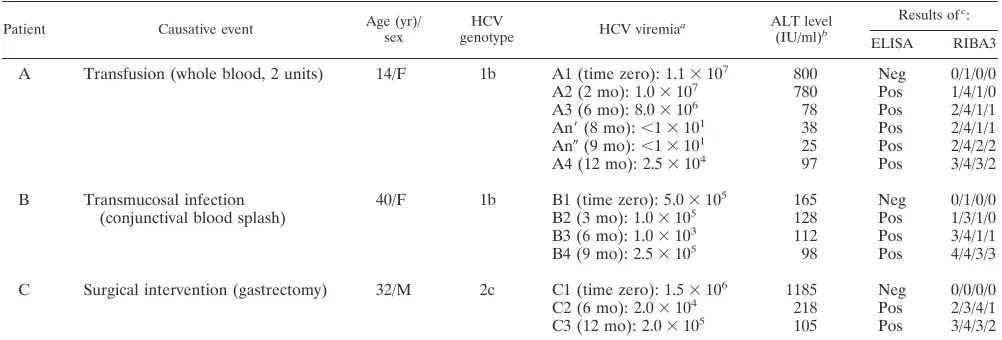
[image:2.612.49.550.81.251.2]Infection with type 1b HCV was documented in patients A and B, while patient C had been infected with a type 2c virus (Table 1). Table 1 shows that the dynamics of viral load during acute infection were quite different in the three cases. In pa-tient A, HCV viremia was high only during the first 6 months of observation (83106to 113106HCV RNA molecules per ml of plasma [samples A1 to A3]) and then dropped to unde-tectable levels (below 10 copy numbers per ml by cRT-PCR [samples An9 and An0 [collected 8 and 9 months from time zero]), paralleling the normalization of the ALT level. After 12 months of observation, the ALT level in serum rose and the amount of circulating cell-free virus increased again to detect-able levels (2.53104molecules per ml of plasma [sample A4]). In patient B, cell-free HCV viremia was detectable throughout the period of observation (albeit at low levels, ranging from 13103to 53105HCV RNA molecules per ml of plasma), accompanied by high ALT levels (three- to fourfold higher than the normal level). After 9 months of follow-up, patient B underwent a liver biopsy; the grading necroinflammatory injury and the architectural damage (i.e., fibrosis) were scored sepa-rately by the criteria Ishak et al. (10), to avoid the disadvantage of combined grading and staging; scores of 6 and 1 were as-signed, respectively. Subsequently, treatment with recombi-nant alpha interferon (3 MU three times a week) was initiated; HCV RNA copy numbers and ALT levels became negative and normal, respectively, within a few weeks of the beginning of therapy. Finally, in patient C, the number of HCV RNA molecules in plasma ranged from 23104to 1.53106per ml;
TABLE 1. Molecular, biochemical, and serological characterization of the three HCV primary infections
Patient Causative event Age (yr)/sex genotypeHCV HCV viremiaa ALT level
(IU/ml)b
Results ofc:
ELISA RIBA3
A Transfusion (whole blood, 2 units) 14/F 1b A1 (time zero): 1.13107 800 Neg 0/1/0/0
A2 (2 mo): 1.03107 780 Pos 1/4/1/0
A3 (6 mo): 8.03106 78 Pos 2/4/1/1
An9(8 mo):,13101 38 Pos 2/4/1/1
An0(9 mo):,13101 25 Pos 2/4/2/2
A4 (12 mo): 2.53104 97 Pos 3/4/3/2
B Transmucosal infection
(conjunctival blood splash) 40/F 1b B1 (time zero): 5.0310
5 165 Neg 0/1/0/0
B2 (3 mo): 1.03105 128 Pos 1/3/1/0
B3 (6 mo): 1.03103 112 Pos 3/4/1/1
B4 (9 mo): 2.53105 98 Pos 4/4/3/3
C Surgical intervention (gastrectomy) 32/M 2c C1 (time zero): 1.53106 1185 Neg 0/0/0/0
C2 (6 mo): 2.03104 218 Pos 2/3/4/1
C3 (12 mo): 2.03105 105 Pos 3/4/3/2
aNumber of HCV RNA molecules per ml plasma. Time zero is the time where the first sample was available; other times are times after time zero. An9and An0
identify two consecutive samples that tested negative for HCV RNA.
bNormal value,,40 IU/ml.
cRIBA3 scores range negative (0) to strongly reactive (4) for c100/c33c/c22/NS5. For ELISA: neg, negative; pos, positive.
on November 9, 2019 by guest
http://jvi.asm.org/
FIG.
1.
Amino
acid
sequences
of
HVR-1
and
the
flanking
E1
region
in
samples
obtained
from
patients
A,
B,
and
C
are
aligned
with
the
majority
sequence
deriv
ed
from
each
clone
at
dif
ferent
time
points.
Dots
represent
amino
acid
identity
to
the
majority,
and
letters
indicate
amino
acid
substitutions.
For
each
patient,
numbers
indicate
dif
ferent
samplings
(see
Materials
and
Methods),
and
lowercase
letters
indicate
the
dif
ferent
clones
obtained.
on November 9, 2019 by guest
http://jvi.asm.org/
ALT levels were high in the first samples and fluctuated in subsequent ones.
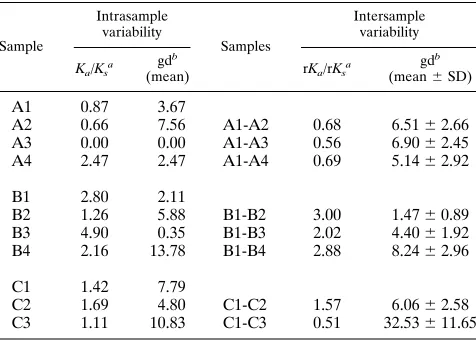
Figure 1 shows the amino acid alignments of the sequences derived from the cloned HVR-1 and the flanking E1 subfrag-ment obtained from the three patients and highlights the non-synonymous changes. A phylogenetic study of these sequences (Fig. 2) revealed that early (time zero) sequences substantially clustered around the origin of the trees in all three cases whereas divergent profiles were observed in later samples. For patient A, the sequences from samples A1 to A4 maintained a low mean intrasample genetic distance (gd): 3.67% (A1), 7.56% (A2), 0% (A3), and 2.47% (A4), respectively (Table 2). In this patient, the clones derived from sample A3 (collected at 6 months) accounted for 100% of the sequences detected at that time (A3/a-n [Fig. 1 and 2]); this sequence was identical to the major prevalent clone (prevalence, 90%) detected at 2 months (A2/p-u [Fig. 1 and 2]). These results were confirmed by analyzing sample A3 again. The sequences found in the samples collected from patients B and C displayed a greater intrasample distance (Fig. 2; Table 2), with late samples (B4 [collected 9 months after B1] and C3 [collected 12 months after C1]) documenting a sharp increase. For the samples from patient B, the mean intrasample gd (Table 2) was 2.11% (se-quences from B1), 5.88% (B2), 0.35% (B3), and 13.78% (B4); for those from patient C, it was 7.79% (C1), 4.8% (C2), and 10.83% (C3). An additional intrasample parameter evaluated in this study was the Ka/Ksratio (Table 2); Ka/Ksratios higher
than 1.0 were observed in samples collected at all time points in patients B and C but not in the first three samples from patient A. This indicates that a positive selection of HCV mutants had been active in two patients; by contrast, in patient A the Ka/Ksratio shifted from less than 1.0 to 2.47 in the last
sample (A4) (Table 2). Overall, intrasample analysis princi-pally documents that (i) early sequences have a low genetic divergence (oligoclonal profile), (ii) a homogeneous viral pop-ulation may be detected in parallel with (or soon after) sero-conversion (samples A3, B3, and C2), and (iii) the dynamics and extent of the host selective pressure may differ among HCV-infected patients, thus indicating that the process of HCV adaptation for persistence follows different routes in different persons.
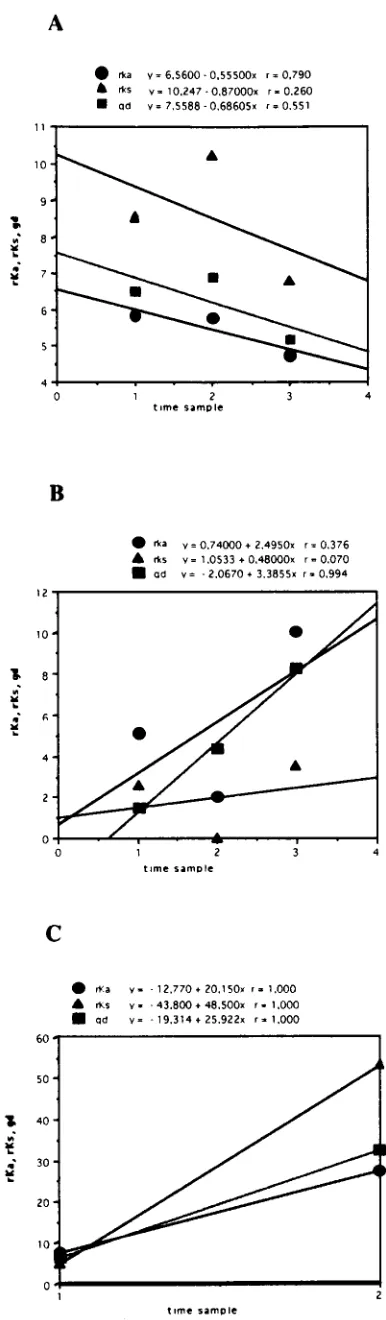
Pairwise comparisons were performed between sequences obtained at different time points; regression curves were
con-structed with DeltaGraph software (Deltapoint, Inc., Monte-rey, Calif.), and correlation coefficients (r values) were calcu-lated by the least-squares method. The values were expressed as average nucleotide substitutions per nonsynonymous site (rKa) or per synonymous site (rKs). The Jukes-Cantor model of
molecular evolution (22) was used to calculate the intersample gd among sequences at different times. Table 2 lists the inter-sample rKa/rKsratios and the gd calculated for different time
points for the three patients; by using this approach, the rela-tive contributions of nonsynonymous and synonymous changes can be efficiently estimated. The results are shown graphically in Fig. 3, where rKa, rKs, and gd values are plotted against time.
In the samples from patients B and C, all parameters increased with time (Table 2; Fig. 3); in the samples from patient B, the intersample rKa/rKsratios always exceeded 1.0, indicating that
rKa was the dominant contributor to the overall gd. By
con-trast, this ratio was consistently below 1.0 in the samples from patient A (documenting low selective forces, at least in the early phases of acute infection [samples A1 to A3]) and fluctuated in patient C. In patient C, rKs was the dominant
contributor to gd in sample C3. Overall, the analysis of inter-sample parameters of molecular evolution yielded three dif-ferent profiles in the cases of acute type C hepatitis evolving into chronic infection. These differences in viral genetic evo-lution parallel differences in viral load (Table 1).
A better characterization of HCV variability in patients with acute infection has important implications for the understand-ing of the natural history of this infection. Either because of the high evolutionary potential of HCV HVR-1 compared with other viral sequences or because this region includes neutral-izing epitopes, the analysis of its intrahost evolution may pro-vide crucial information on virus-host relationships at any point in time. The low intrasample genetic divergence ob-served in the first samples collected from these three patients, before a specific humoral immune response was elicited, sug-gests that in its early phase HCV infection is an oligoclonal event. This finding may reflect either selective amplification or selective transmission, as hypothesized for human immunode-FIG. 2. Phylogenetic tree analysis of HVR-1 sequences in samples obtained
[image:4.612.55.287.67.231.2]from patients A, B, and C. Branch lengths are drawn to scale. Bootstrap values (indicating the reproducibility of the particular bifurcation point) obtained with 1,000 replications of bootstrap sampling are shown only when they are greater than 75%.
TABLE 2. Intra- and intersample variability of HVR-1 during HCV primary infection
Sample
Intrasample variability
Samples
Intersample variability
Ka/Ksa gd b
(mean) rKa/rKsa gd b (mean6SD)
A1 0.87 3.67
A2 0.66 7.56 A1-A2 0.68 6.5162.66
A3 0.00 0.00 A1-A3 0.56 6.9062.45
A4 2.47 2.47 A1-A4 0.69 5.1462.92
B1 2.80 2.11
B2 1.26 5.88 B1-B2 3.00 1.4760.89
B3 4.90 0.35 B1-B3 2.02 4.4061.92
B4 2.16 13.78 B1-B4 2.88 8.2462.96
C1 1.42 7.79
C2 1.69 4.80 C1-C2 1.57 6.0662.58
C3 1.11 10.83 C1-C3 0.51 32.53611.65 aThe average number of nucleotide substitutions per nonsynonymous site and per synonymous site for all pairwise comparisons within each sampling point (Ka,
Ks) and of sequences obtained at different time points (rKa, rKs) were calculated by using the Jukes-Cantor model of molecular evolution implemented in the MEGA program (see Materials and Methods).
bThe intra- and intersample gd were calculated with DNADIST software implemented in the PHYLIP package (version 3.5c).
on November 9, 2019 by guest
http://jvi.asm.org/
[image:4.612.309.547.499.669.2]ficiency virus type 1 infection (32, 33). In the former case, viral selection from a heterogeneous inoculum would occur even though multiple HCV variants penetrate into the new host (because of its biomolecular characteristics only one would be amplified, becoming the dominant population); in the latter, a single viral variant would be transmitted efficiently, due either to its high concentration in specific compartments or biological fluids or to its ability to penetrate the mucosal barriers of the new host, such as the conjunctiva of patient B. Independent of the underlying biomolecular mechanism and even though our evidence is largely indirect, since we could not analyze any sample from the transmitters, the hypothesis that in its early phase HCV infection could be an oligoclonal event may have important implications for planning efficient prevention strat-egies.
At 2 to 4 months after collection of the first sample and soon after seroconversion, the intrasample gd decreased further. In patient A, this reduction reached its peak 6 months after col-lection of the first sample (A3). The finding of a single domi-nant HVR-1 variant among 20 clones in sample A3 suggests a process of selection of variants within the incoming viral pop-ulation in this phase. Nonetheless, a substantial increase in the intrasample gd of actively replicating viruses was subsequently observed (in patients B and C in the third samples, in patient A only 1 year later and to a lesser extent [Fig. 2; Table 2]). These data suggest that when HCV becomes persistent after primary infection, viral genetic evolution enters an adaptive phase in most cases, albeit to different extents. From this point of view, HCV persistence (although not always the primary infection) may be compatible with an ideal Darwinian system, as also documented by Ka/Ksratios higher than 1.0 (in patient
A only in the fourth sample [A4]), since synonymous substitu-tions (Ks) are not subjected to selection. The heterogeneous
features of acute HCV infection were confirmed by the dynam-ics of intersample gd and rKaand rKsvalues. In other words,
our data documenting the absence of a precise common pat-tern during primary infection indicate that the adaptation of HCV to persistence shows clear differences in different sub-jects who are infected with different HCV genotypes and have different exposures, clinical features, and outcomes.
Our study does not directly address the issue of the nature of the host forces for viral selection. Theoretically, two major components of these forces may be active in infected patients: immune response and acquisition of a wider cellular host range for the virus. Whether (as presently believed) or not the major components of the selective pressure are related to immune selection, it would be important to account for the absence of a clear-cut correlation between the gd, rKa, and rKsand the
time, at least in acute infection.
In conclusion, the present molecular study of primary HCV infection and early viral persistence documents different dy-namics of viral genetic evolution (as well as of viral replication) in three patients with acute type C hepatitis and suggests that these features are the molecular counterpart of a differential dynamics of viral fitness for individual environments.
Nucleotide sequence accession numbers. The sequences
[image:5.612.67.260.65.725.2]described in this paper have been submitted to EMBL and assigned accession no. AJ225271 to AJ225286 (patient A), FIG. 3. Average values of frequencies of rKa, rKs, and gd are plotted against the time sampling points for each patient (A, B, and C, respectively). Each symbol represents the average value of pairwise comparisons between the se-quences from the first sample and those from each of the subsequent samples. For each regression line, the r values are reported above the graphs.
on November 9, 2019 by guest
http://jvi.asm.org/
AJ225287 to AJ225303 (patient B), and AJ225304 to AJ225331 (patient C).
This work was supported in part by grants from the Italian Istituto Superiore di Sanita` (target project “Epatiti Virali”) and Consiglio Nazionale delle Ricerche (target project “Biotechnology”) to M.C.
REFERENCES
1. Alter, J. H., R. H. Purcell, J. W. Shih, J. C. Melpolder, M. Houghton, Q.-L.
Choo, and G. Kuo. 1989. Detection of antibody to hepatitis C virus in prospectively followed transfusion recipients with acute and chronic non-A non-B hepatitis. N. Engl. J. Med. 321:1494–1500.
2. Chomczynski, P., and N. Sacchi. 1987. Single-step method of RNA isolation by acid guanidinium thiocyanate-phenol-chloroform extraction. Anal. Bio-chem. 161:156–159.
3. Choo, Q. L., G. Kuo, A. J. Weiner, L. R. Overby, D. W. Bradley, and M.
Houghton.1989. Isolation of a cDNA clone derived from a blood-borne non-A, non-B viral hepatitis genome. Science 244:359–362.
4. Choo, Q. L., K. H. Richman, J. H. Han, K. Berger, C. Lee, C. Dong, C.
Gallegos, D. Coit, A. Medina-Selby, P. J. Barr, A. J. Weiner, D. W. Bradley, G. Kuo, and M. Houghton.1991. Genetic organization and diversity of the hepatitis C virus. Proc. Natl. Acad. Sci. USA 88:2451–2455.
5. Domingo, E., J. Diez, M. A. Martinez, J. Hernandez, A. Holguin, B. Borrego,
and M. G. Mateau.1993. New observations on antigenic diversification of RNA viruses. Antigenic variation is not dependent on immune selection. J. Gen. Virol. 74:2039–2045.
6. Felsenstein, J. 1993. Phylogeny interference package, version 3.5. Depart-ment of Genetics, University of Washington, Seattle.
7. Gojobori, T., E. N. Morijama, and M. Kimura. 1990. Molecular clock of viral evolution, and the neutral theory. Proc. Natl. Acad. Sci. USA 87:10015– 10018.
8. Higashi, Y., S. Kakumu, K. Yoshioka, T. Wakita, M. Mizokami, K. Ohba, Y.
Ito, T. Ishikawa, M. Takayanagi, and Y. Nagai.1993. Dynamics of genome change in the E2/NS1 region of hepatitis C virus in vivo. Virology 197:659– 668.
9. Houghton, M. A. Weiner, J. Han, and Q.-L. Choo. 1991. Molecular biology of hepatitis C viruses: implications for diagnosis, development and control of viral disease. Hepatology 14:381–388.
10. Ishak, K., A. Baptista, L. Bianchi, F. Callea, J. De Groote, F. Gudat, H.
Denk, V. Desmet, G. Korb, R. N. MacSween, M. J. Phillips, B. G. Portmann, H. Poulsen, P. J. Scheuer, M. Schmid, and H. Thaler.1995. Histological grading and staging of chronic hepatitis. J. Hepatol. 22:696–699. 11. Kao, J. H., P.-J. Chen, M.-J. Lai, T. H. Wang, and D. S. Chen. 1995.
Quasispecies of hepatitis C virus and genetic drift of the hypervariable region in chronic type C hepatitis. J. Infect. Dis. 172:261–264.
12. Kato, N., Y. Ootsuyama, H. Sekiya, S. Ohkoshi, T. Nakazawa, M. Hijikata,
and K. Shimotohno.1994. Genetic drift in hypervariable region 1 of the viral genome in persistent hepatitis C virus infection. J. Virol. 68:4776–4784. 13. Kumar, S., K. Tamura, and M. Nei. 1994. MEGA: molecular evolutionary
genetic analysis for microcomputers. Comput. Appl. Biosci. 10:189–191. 14. Kumar, U., J. Monjardino, and H. C. Thomas. 1994. Hypervariable region of
hepatitis C virus envelope glycoprotein (E2/NS1) in an agammaglobulinemic patient. Gastroenterology 106:1072–1075.
15. Kurosaki, M., N. Enomoto, F. Marumo, and C. Sato. 1994. Evolution and selection of hepatitis C virus variants in patients with chronic hepatitis C. Virology 205:161–169.
16. Lawal, Z., J. Petrik, V.-S. Wong, G. J. M. Alexander, and J. P. Allain. 1997. Hepatitis C virus genomic variability in untreated and immunocompromised patients. Virology 228:107–111.
17. Li, W. H., and D. Graur. 1991. Fundamentals of molecular evolution. Si-nauer Associates Inc., Sunderland, Mass.
18. Li, W. H., C. I. Wu, and C. C. Luo. 1985. A new method for estimating synonimous and nonsynonimous rates of nucleotide substitutions consider-ing the relative likelihood of nucleotide and codon changes. Mol. Biol. Evol.
2:150–174.
19. Manzin, A., P. Bagnarelli, S. Menzo, F. Giostra, M. Brugia, R. Francesconi,
F. B. Bianchi, and M. Clementi.1994. Quantitation of hepatitis C virus genome molecules in plasma samples. J. Clin. Microbiol. 32:1939–1944. 20. Martell, M., J. I. Esteban, J. Quer, J. Genesca, A. Weiner, R. Esteban, J.
Guardia, and J. Gomez.1992. Hepatitis C virus (HCV) circulates as a population of different but closely related genomes: quasispecies nature of HCV genome distribution. J. Virol. 66:3225–3229.
21. Miller, R. H., and R. H. Purcell. 1990. Hepatitis C virus shares amino acid sequence similarity with pestiviruses and flaviviruses as well as members of two plant virus supergroups. Proc. Natl. Acad. Sci. USA 87:2057–2062. 22. Nei, M., and T. Gojobori. 1986. Simple methods for estimating the numbers
of synonimous and nonsynonimous nucleotide substitutions. Mol. Biol. Evol.
3:418–426.
23. Odeberg, J., Z. Yun, A. So¨nnerborg, K. Bijøro, M. Uhle´n, and J. Lundeberg. 1997. Variation of hepatitis C hypervariable region 1 in immunocompro-mised patients. J. Infect. Dis. 175:938–943.
24. Okamoto, H., Y. Sugiyama, S. Okada, K. Kurai, Y. Akahane, Y. Sugai, T.
Tanaka, K. Sato, F. Tsuda, Y. Miyakawa, M. Mayumi.1992. Typing hepatitis C virus by polymerase chain reaction with type-specific primers: application to clinical surveys and tracing infectious sources. J. Gen. Virol. 73:673–679. 25. Shimizu, Y. K., M. Hijikata, A. Iwamoto, H. J. Alter, R. H. Purcell, and H.
Yoshikura.1994. Neutralizing antibodies against hepatitis C virus and the emergence of neutralization escape mutant viruses. J. Virol. 68:1494–1500. 26. Silini, E., F. Bono, A. Cerino, V. Piazza, E. Solcia, and M. U. Mondelli. 1993. Virological features of hepatitis C virus infections in hemodialysis patients. J. Clin. Microbiol. 31:2913–2917.
27. Temin, H. W. 1989. Is HIV unique or merely different? J. Acquired Immune Defic. Syndr. 2:1–29.
28. Tong, M. J., N. S. El-Farra, A. S. Reikes, and R. L. Co. 1995. Clinical outcomes after transfusion-associated hepatitis C. N. Engl. J. Med. 332: 1463–1466.
29. Van Doorn, L.-J., I. Capriles, G. Maertens, R. DeLeys, K. Murray, T. Kos,
H. Schellekens, and W. Quint.1995. Sequence evolution of the hypervariable region in the putative envelope region E2/NS1 of hepatitis C virus is corre-lated with specific humoral immune responses. J. Virol. 69:773–778. 30. Weiner, A. J., H. M. Geysen, C. Christopherson, J. E. Hall, T. J. Mason, G.
Saracco, F. Bonino, K. Crawford, C. D. Marion, and K. A. Crawford.1992. Evidence for immune selection of hepatitis C virus (HCV) putative envelope glycoprotein variants: potential role in chronic HCV infections. Proc. Natl. Acad. Sci. USA 89:3468–3472.
31. Yamaguchi, K., E. Tanaka, K. Higashi, K. Kiyosawa, A. Matsumoto, S.
Furuta, A. Hasegawa, S. Tanaka, and M. Kohara.1994. Adaptation of hepatitis C virus for persistent infection in patients with acute hepatitis. Gastroenterology 106:1344–1348.
32. Zhang, L., R. S. Diaz, D. D. Ho, J. W. Mosley, M. P. Busch, and A. Mayer. 1997. Host-specific driving force in human immunodeficiency virus type 1 evolution in vivo. J. Virol. 71:2555–2561.
33. Zhu, T., H. Mo, D. S. Nam, Y. Cao, R. A. Koup, and D. D. Ho. 1993. Genotypic and phenotypic characterization of HIV-1 in patients with pri-mary infection. Science 261:1179–1181.
34. Zibert, A., E. Schreier, and M. Roggendorf. 1995. Antibodies in human sera specific to hypervariable region 1 of hepatitis C virus can block viral attach-ment. Virology 208:653–661.