Rochester Institute of Technology
RIT Scholar Works
Theses
Thesis/Dissertation Collections
5-12-2015
Do Bugs Foreshadow Vulnerabilities? A Study of
the Chromium Project
Felivel Camilo
Follow this and additional works at:
http://scholarworks.rit.edu/theses
This Thesis is brought to you for free and open access by the Thesis/Dissertation Collections at RIT Scholar Works. It has been accepted for inclusion in Theses by an authorized administrator of RIT Scholar Works. For more information, please [email protected].
Recommended Citation
Do Bugs Foreshadow Vulnerabilities?
A Study of the Chromium Project
By
Felivel Camilo
A Thesis Submitted in Partial Fulfillment of the
Requirements for the Degree of
Master of Science in Software Engineering
Approval Committee:
Andrew Meneely
Meiyappan Nagappan
Department of Software Engineering
College of Computing and Information Sciences
Rochester Institute of Technology
Rochester, NY
ABSTRACT
As developers face ever-increasing pressure to engineer secure software,
researchers are building an understanding of security-sensitive bugs (i.e.
vulnerabilities). Research into mining software repositories has greatly increased
our understanding of software quality via empirical study of bugs. However,
conceptually vulnerabilities are different from bugs: they represent abusive
functionality as opposed to wrong or insufficient functionality commonly
associated with traditional, non-security bugs. In this study, we performed an
in-depth analysis of the Chromium project to empirically examine the relationship
between bugs and vulnerabilities. We mined 374,686 bugs and 703 post-release
vulnerabilities over five Chromium releases that span six years of development.
Using logistic regression analysis, we examined how various categories of
pre-release bugs and review experiences (e.g. stability, compatibility, etc.) are
associated with post-release vulnerabilities. While we found statistically significant
correlations between our metrics and post-release vulnerabilities, we also found the
association to be weak. Number of features, SLOC, and number of pre-release
security bugs are, in general, more closely associated with post-release
Do Bugs Foreshadow Vulnerabilities?
A Study of the Chromium Project
Felivel Camilo
Department of Software Engineering Rochester Institute of Technology,
134 Lomb Memorial Drive Rochester, NY, USA 14623
1+585-475-7829 [email protected]
Abstract—As developers face ever-increasing pressure to engi-neer secure software, researchers are building an understanding of security-sensitive bugs (i.e. vulnerabilities). Research into mining software repositories has greatly increased our un-derstanding of software quality via empirical study of bugs. However, conceptually vulnerabilities are different from bugs: they represent abusive functionality as opposed to wrong or insufficient functionality commonly associated with traditional, non-security bugs. In this study, we performed an in-depth analysis of the Chromium project to empirically examine the relationship between bugs and vulnerabilities. We mined 374,686 bugs and 703 post-release vulnerabilities over five Chromium releases that span six years of development. Using logistic regression analysis, we examined how various categories of pre-release bugs and review experiences (e.g. stability, compatibility, etc.) are associated with post-release vulnerabilities. While we found statistically significant correlations between our metrics and post-release vulnerabilities, we also found the association to be weak. Number of features, SLOC, and number of pre-release security bugs are, in general, more closely associated with post-release vulnerabilities than any of our non-security bug categories. In a separate analysis, we found that the files with highest defect density did not intersect with the files of highest vulnerability density. These results indicate that bugs and vulnerabilities are empirically dissimilar groups, warranting the need for more research targeting vulnerabilities specifically.
I. INTRODUCTION
Developers are facing an ever-increasing pressure to en-gineer secure software. A simple coding mistake or design flaw can lead to an exploitable vulnerability if discovered by the wrong people. These vulnerabilities, while rare, can have catastrophic and irreversible impact on our increasingly digital lives. Vulnerabilities as recent as Shellshock and Heartbleed are reminders that small mistakes can lead to widespread problems. To engineer secure software, developers need a scientifically rigorous understanding of how to detect and prevent vulnerabilities.
We can build an understanding of vulnerabilities by viewing them as security-sensitive bugs. That is, a vulnerability can be defined as a “software defect that violates an [implicit or explicit] security policy” [1]. Research into mining software repositories has greatly increased our understanding of soft-ware quality via empirical study of bugs. Researchers have provided a myriad of metrics, prediction models, hypothesis
tests, and other actionable empirical insight that speak to the nature of bugs [2]–[4]. At first glance, research on software quality should translate to software security.
However, vulnerabilities are conceptually different than tra-ditional bugs. Vulnerabilities represent an abuse of functiona-lity as opposed to wrong or insufficient functionafunctiona-lity com-monly associated with non-security bugs. Vulnerabilities are about allowing “too much” functionality so as to be open to attack. For example, an open permissions policy may function perfectly well for most users, but would be quickly exploited by attackers. Or, a simple memory leak can be coerced into denial-of-service attack. As a result, vulnerabilities are about what the system is supposed topreventfrom happening beyond the functionality that the customer requires.
Thus, the relationship between bugs and vulnerabilities deserves empirical examination. In particular, can software quality problems foreshadow security problems? If the corre-lation between bugs and vulnerabilities is strong, then empiri-cal analyses should focus primarily the super-group of bugs. If not, perhaps some subgroups of bugs (e.g. stability bugs) may foreshadow vulnerability problems in the future.
Furthermore we examine the association of bugs and vulnerabilities in terms of the social aspects present in the development environment, evaluating code review effective-ness and participant experience, in particular how experience in reviewing bug issues translates to increased vulnerability awareness. If the difference between bugs and vulnerabilities is strong, a person experienced reviewing bugs might not be prepared to identify security problems.
The objective of this research is improve our fundamental understanding of vulnerabilities by empirically evaluating the
connections between bugs and vulnerabilities. We conducted
RQ1. Are source code files fixed for bugs likely to be fixed for future vulnerabilities?(We found that files with more pre-release bugs are slightly more likely to present post-pre-release vulnerabilities.)
RQ2. Are some types of bugs more closely related to vulnera-bilities than others?(Here we discovered that while of some types of pre-release bugs present a stronger association than others to post-release vulnerabilities, this relation is overall weak.)
RQ3. Do the source code files with the most bugs also have the most vulnerabilities?(We found that files with the top count of pre-release bugs have only some post-release vulnerabilities.)
RQ4. Does experience in reviewing bugs boost vulnerabilities
awareness? (Our results indicate that bug experience is
slightly a better metric than number of bugs, but stills has a small influence on the amount of vulnerabilities that make it pass the review stage.)
The rest of the paper is organized as follows. Sections II and III cover the terminology and related work introducing the concepts to understand of the paper. Section IV we present our research questions. In Section V we introduce and explain the Chromium browser. Section VI explains our analysis methodology approach, answers the research questions and discusses the results. Section VII we discuss the threats to validity and we finally conclude in Section VIII with a brief summary.
II. TERMINOLOGY
We use various technical and statistical terms with respect to processing and analyzing the data. We define these terms first ensuring that the essence of the paper can be understood by a broader audience.
A. Data terms
When we refer to arelease, we are referring to a milestone in the software development life cycle for our case study project. Releases represent a snapshot of all source code files at a specific point in time. The project evolves from release to release through small changes called commits. The commits represent unique changes to the source code of the project, and are recorded by a version control system (e.g. Git). We also make the special distinction between non-security related software flaws (bugs), that manifest as the lack of expected functionality. Security related software flaws (vulnerabilities) manifest as violation of the system’s security policies [1]. We categorize files of a release as vulnerable if they were fixed as a result of a vulnerability post-release, and other files are
neutral (i.e. no vulnerabilities were known to be associated with them).
We also use the metric Source lines of code (SLOC) as a measurement of file size. In this study source comments or whitespace are not considered SLOC. SLOC forms part of a group called traditional software metrics [5] (Other metrics in this group are Code Churn and ciclomatic complexity).
We also employ term experience to measure the number of reviewers that had previously participate in a review on a specific bug type.
B. Statistics terms
Spearman correlation coefficient: This is a statistical test for measuring the association between two or more variables. This metric has the ability to rank the strength of the correlation between variables. The following scale is used to measure and interpret the result values [6]: a) ±0.00 - 0.30 “Negligible”
b)±0.30 - 0.50 “Low correlation”c)±0.50 - 0.70 “Moderate correlation”d)±0.70 - 0.90 “High correlation”e) and±0.90 - 1.00 “very High correlation”.
Mann-Whitney-Wilcoxon test (MWW): This test evaluates
the difference in values of two populations, and reveals if the two populations are statistically equal when compared against a null hypothesis. Previous software metrics studies [4], [7] have suggested this as suitable test for validating software metrics.
Cohen’s D Statistic: The Cohen’s D is an effect size
measure that evaluates the strength of a phenomenon [8], [9]. While MWW measures statistical significance, it does not measures the strength of the association. In this study we make use of the Cohen’s D to support the results of the MWW test and measure how closely related the vulnerable population is to neutral population. Cohen’s D is defined as:
δ= mean difference
standard deviation
The original paper measures in terms of non-overlap percen-tage, We use the inverse of that measure [10] in this paper , where a lower Cohen’s D indicates that a larger overlap exists. The following scale was proposed originally by the authors [11] to interpret the results in terms of non-overlap: a) 0.20 “Small”b) 0.50 “Medium”c) or 0.80 “Large”.
Logistic Regression: Logistic regression analysis predicts
the possibility of a binary outcome based on a set of indicator variables. The goal of a logistic regression is to find the equation (the right combination of indicator variables) that best predicts the probability of a true or false outcome [2], [12].
Akaike information criterion (AIC): This is a measure of
relative model fitness calculated on generalized models. This metric can be used to rate a group of models and find the best one among them. By itself the AIC is not a measure of how fitted the model is, but instead it is relative rank, suitable for comparing with other models that were trained using the same data set. A lower the AIC value, means a better fit model [2], [13], [14].
Precision and recall: When we use logistic regression to predict the outcome of a binary variable, the model can make two types of mistakes: False Positives (F P) and False Negatives (F N). False positives are when the model identified neutral file as vulnerable, and false negatives are when the model identifies a vulnerable file as neutral. The relevant values are defined as True Positives (T P) and True Negatives (F N), when the model accurately identifies a vulnerable or neutral file.
Precision is defined as the fraction of all the predictions that are relevant , that is precision= (T PT P+F P). Recall is defined as the fraction of all relevant instances that are retrieved, that isrecall= (T PT P+F N). To serve as example and to explain the application of this metric in our study we present the following scenario: Imagine a data set of 50 files, from which 30 files are known to be “vulnerable”. Then we use a model to retrieve 30 files, if the model is able to identify 10 vulnerable files correctly but misidentifies on 20 files, here precision = 1020
andrecall= 1030.
F-measure: This is a metric that can be interpreted the as
a weighted average of precision and recall. It is considered a more complete metric that using only precision and recall [16] because it takes into account both values. The F-measure is defined as:
F1= 2·
precision·recall precision + recall
Area Under the ROC Curve (AUC): Receiver operating
characteristic curves can be used to graphically represent the performance of a logistic model by plotting the precision and recall. The area under the ROC curve measures the ability of the model to correctly classify the binary outcome. To understand this concept, consider the following example: We have separated the files in vulnerable and neutral; after that we randomly select two files one from the vulnerable group and one from the neutral group and then use a model to predict the outcome (Vulnerable or Neutral); the AUC represents the percentage of observations in which the model will be able to discriminate correctly between two files.
III. RELATEDWORK
Other researchers have studied the relationship between bugs and vulnerabilities, and this work extends those questions with further analysis and a larger data set. Gegick, M. et al. [3], [17] studied the prediction of attack prone components, by identifying and ranking components that are more likely to present vulnerabilities. These rankings were proposed to prioritize the security risk management efforts. In their study they used automated static analysis tools to calculate different metrics and show how these metrics relate with a higher vulnerability risk. This study directly relates with our research, as it tries to evaluate vulnerability-proneness in files based on non-security factors (i.e. code churn, SLOC, and previous manual inspections), we go a step further by taking account multiple releases as factor.
In a prior study by Meneely, A. et al. [4], the authors evalua-ted code review effectiveness and the Linus laws applying in
terms of vulnerabilities. Investigating if “many eyes make all the bugs shallow”, also apply to vulnerabilities. The results from this previous study show that contrasted with traditional bugs, vulnerabilities are still missed by many reviewers, indi-cating an intrinsic difference in the two groups, that we aim to clarify. We have expanded the data set from this previous study and have included four additional releases, introduced the bug report data and recollected the commit logs, code reviews and vulnerability entries. Additionally we have included five new types of developer experience metrics.
On another study Bosu A. [18] studied specifically how ex-perience affects the effectiveness of the code reviews in terms of vulnerabilities. Their results show that the contribution of inexperienced developers were 1.8 to 24 times more likely to be vulnerable. This work focuses more on the commits that contributed the security failures, in contrast here we examine the history of the files, and account for specific types of bug related experience.
Studies have shown the potential use of logistic regression analysis as a way to predict future software flaws, based on traditional software metrics [5] and defects. A previous study by T.-H Chen et al. [2] shows the use of logistic regression analysis using various static and historical defects metrics to explain future software defects. This study takes into account the defect history of each topic and evaluate the probability of future defects. We borrow the historical analysis from their approach by apply it to the evaluation of future vulnerability. Also Shihab et al. [19] evaluated different software metrics in look for patterns that lead to high impact defects. These defects break the functionality of production software systems and cause a negative impact on customer satisfaction. This study also makes use of logistic regression as the means of predicting a binary outcome. Their findings indicate that while logistic regression analysis can be used to predict high impact defects, there is a need of further development to bring these predictions techniques closer to an industry adoption.
Other studies have evaluated the occurrence security-related bugs through the analysis of source control repositories and static analysis tools. Mitropoulos, D. et al. [20] studied the relation of software bugs compared to other bugs categories, using maven repositories. Their results indicate security bugs do not have a recognizable pattern in the projects they studied, and encourage the further investigation on this topic. Mitropoulos, D. et al. [21] also studied the evolution of security related bugs by tracking down their introduction. Their results show that the number of security-related software bugs increases as the system evolves and it is influenced by external software dependencies. These two studies use static analysis tools to identify bugs, in contrast We use data from a bug tracking system and bug labels, eliminating bias introduced by the tool.
research as we make use of Google Code labels to classify the pre-release bugs.
IV. RESEARCHQUESTIONS
We approach our analysis by first conducting an overall analysis with a single variable, then we conducted our analy-sis by using the categorizations provided by the Chromium project. Then we examined how vulnerabilities are spread across files when ranked by defect density. Finally we ex-plored how specific experience in reviewing bug related issues associates with vulnerability discovery. Thus, our four research questions are:
• RQ1. Are source code files fixed for bugs likely to be
fixed for future vulnerabilities?
• RQ2. Are some types of bugs more closely related to vulnerabilities than others?
• RQ3. Do the source code files with the most bugs also have the most vulnerabilities?
• RQ4. Does experience in reviewing bugs boost vulnera-bilities awareness?
V. DATA: THECHROMIUMPROJECT
The Chromium Browser is the open source project behind Googles Chrome Browser. The Chromium project is a large project consisting of more than 4 million Source Lines of Code (SLOC). We selected this project because its high visibility and popularity in the open source developer community and more significantly because it offers different analysis opportunities and perspectives that can be explored using software repository mining techniques [23]. Our in-depth analysis to produce this data involved analyzing code reviews, investigating vulnerabi-lity claims, and maintaining traceabivulnerabi-lity between the artifacts.
A. Chromium Vulnerabilities (NVD, Public Disclosures)
The Chromium team regularly acknowledges vulnerabilities that have been fixed in each new release. These post-release vulnerabilities are recorded in the National Vulnerability Database (NVD) and given a Common Vulnerabilities and Exposures (CVE) identifier. However, not every CVE entry is accurate. Thus, we conducted manual analysis to ensure the credibility of each vulnerability verifying that it was acknowledged by Chromium, fixed, and the fix was released. These vulnerabilities are post-release vulnerabilities that are reported to the Chromium Team, and present potential threats users. In this study, we have traceability from 703 CVE entries to the code review and the commit that fixed the vulnerabilities.
A key part of mining the vulnerability data was tracing them to code reviews and git logs. We mined 242,635 Git [24] commits, spanning across six years of development of the Chromium project. These commits contain information about the source files that were change. Additionally the commits contain the ID of the bug report that this change contributes to fix and the ID of the code review that inspected the change before adding it to the main code base. This IDs are used to link the records in a relational database. The commit data is
the central point of our data set, combining together the bugs and the vulnerabilities through code reviews. The code reviews also provide us with participation information, we track each participant throughout the different Releases, increasing one experience point each time they review a specific bug issue type.
B. Chromium Bug Tracking System (Google Code)
Chromium uses Google Code as bug tracking system [25], [26]. We have collected 374,686 bug entries with 5,825 different labels, and 3,801,444 bug comments. A bug entry does not necessarily mean an actual flaw in the system: system features, and other tasks are in this database as well. To be considered in the analysis the bugs need to have at least one commit referencing to the specific bug id, this means the bug is relevant and have been addressed at least by one fix attempt. The Google Code labels function as a taxonomy system, and they allow the developers to label specific keywords to the bugs reports, including the “bug” label. The system then uses these labels to categorize, filter and search the bug repository. Special labels are used to attach additional critical information like priority (Pri), product category (Cr), operating system where the bug occurs (OS), possible milestone to release a fix (M-value) and type of bug. Additionally Google Code users can manually add arbitrary labels to the bug reports. To mitigate misspellings of labels, we manually inspected the label choices throughout the 5,825 labels that were used.
We aggregated these labels and examined how often they were used. Among the 5,825 labels, only a few were labeled consistently. For our RQ2 question about categories, we exa-mined labels that were used over 1,000 times and identified categories that were not specific to Chromium (e.g. “stability” is specific to Chromium, but “Milestone18 Migration” is not).
C. Processing By Releases
To account for the evolution of the project, we separated the data into releases. Chromium utilizes a rapid release cycle, with a major release coming out approximately every two months. In prior work [27] we found that vulnerabilities on average have remained in the system for approximately two years prior to their fix. Using those results as a guide, a vulnerability fixed within one year of a release may have reasonably existed in the system for up to one year prior a release. Additionally, we conducted our analysis in time segments that are non-overlapping to avoid double counting and ultimately auto-correlation. Thus, we chose five major releases that were approximately one year apart: versions 5.0, 11.0, 19.0, 27.0, and 35.0.
not necessarily from bugs that were never part of production release.
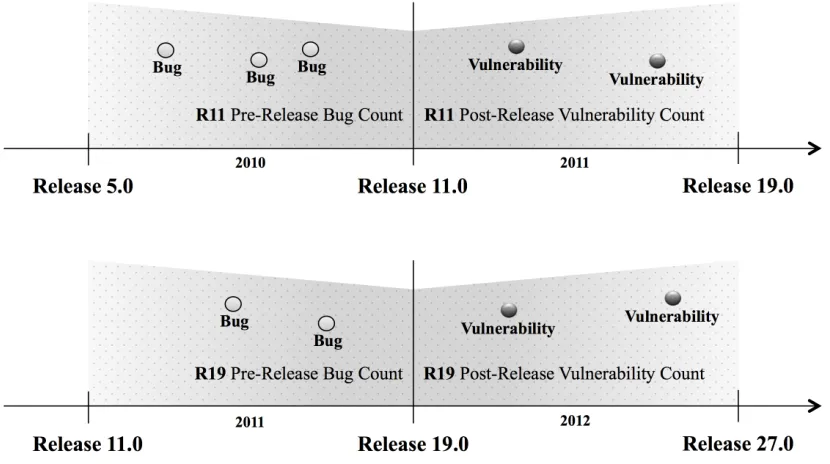
We used this pre-release bug data and post-release vulnerability data so that no overlap exists between the groups. As shown in Figure 1, bugs between 5.0 and 11.0 are used exactly once: in the Release 11.0 analysis. The only overlap is in our analysis of pre-release “security bugs” and post-release vulnerabilities: these groups are not entirely the same as some vulnerabilities are not recorded in the bug-tracking system and some security-labeled bug entries were never part of a release to users.
The Git repository contained specific release information via the tag feature. We performed a manual investigation for each specific release dates to corroborate the dates, comparing the actual release of the product to the public and the date of the final version commit.
D. Computing Metrics
We used Ruby and the Ruby on Rails ActiveRecord libraries to parse, model, verify and query the data. We used R to conduct our analysis. We made use of a nightly build process to integrate and verify long running queries. The conceptual data diagram can be found in Figure 2.
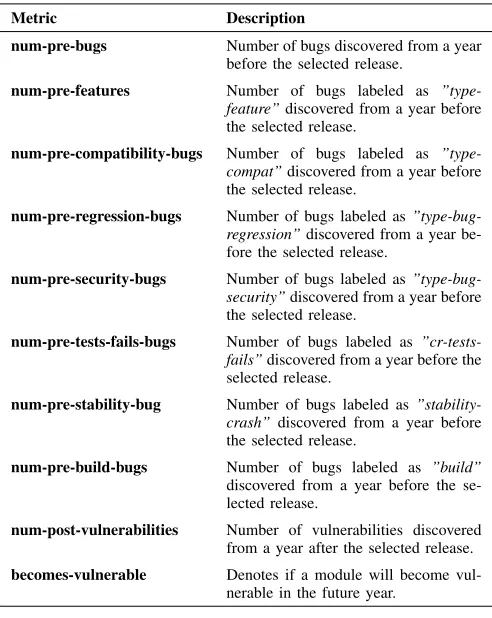
We set up a process to calculate different file-level metrics in a release per release basis. We present the bug file-level metrics in Table I. For each file we count the number of pre-release bugs and the number of post-release vulnerabilities reported in a one year. We only use source code files, which are primarily C/C++ file extensions.
To measure the pre-release bug count we evaluated if the specific file was modified in a commit that linked to a bug report, if a match is found we add one to the bug count. Only bug reports opened from a year prior to the specific release date are taken into account. Additionally in this step we make use of the Chromium bug labels to categorize the bug count in different types of bugs. We created 7 bug categories based on the 7 most vulnerability relevant labels. These 7 labels were selected from the top most used labels.
To measure the post-release vulnerabilities we evaluated if the specific file was modified in a commit that linked to a code review that fixed a vulnerability. In comparison to the criteria for bugs this is a forward search, only selecting the vulnerabilities that were reported from the release date to a year after the release date, this information is selected as num-post-vulnerabilities. The booleanbecomes-vulnerableis set to true if any vulnerabilities are found in that future date range. A graphical representation of both selection processes can be found in Figure 1.
Finally, we removed files that were never fixed for any bugs nor vulnerabilities. Since no quality nor security data data exist for these files, no inference can be made about their quality or security. Table II shows the a summary of the state of the releases.
VI. ANALYSISAPPROACH& RESULTS
[image:8.612.328.544.60.210.2]We began an in-depth exploratory statistical analysis using the metrics calculated at the file level. We used the pre-release
[image:8.612.313.559.266.575.2]Fig. 2. Conceptual diagram of data set
TABLE I
FILE-LEVELMETRICSCOMPUTEDPERRELEASE
Metric Description
num-pre-bugs Number of bugs discovered from a year before the selected release.
num-pre-features Number of bugs labeled as ”type-feature”discovered from a year before the selected release.
num-pre-compatibility-bugs Number of bugs labeled as ”type-compat”discovered from a year before the selected release.
num-pre-regression-bugs Number of bugs labeled as ”type-bug-regression”discovered from a year be-fore the selected release.
num-pre-security-bugs Number of bugs labeled as ”type-bug-security”discovered from a year before the selected release.
num-pre-tests-fails-bugs Number of bugs labeled as ”cr-tests-fails”discovered from a year before the selected release.
num-pre-stability-bug Number of bugs labeled as ”stability-crash” discovered from a year before the selected release.
num-pre-build-bugs Number of bugs labeled as ”build” discovered from a year before the se-lected release.
num-post-vulnerabilities Number of vulnerabilities discovered from a year after the selected release.
becomes-vulnerable Denotes if a module will become vul-nerable in the future year.
TABLE II
SELECTEDRELEASESBEFORE ANDPOSTPROCESS. NUMBER OF FILES (VULNERABILITY PERCENTAGE)
Release Date Pre-Process Post-Process
Chromium 5.0 Jan 2010 9,142 (2.55%) 2,276 (11.08%)
Chromium 11.0 Jan 2011 17,005 (3.35%) 4,760 (12.80%)
Chromium 19.0 Feb 2012 21,818 (1.40%) 6,826 (4.61%)
Chromium 27.0 Feb 2013 30,087 (0.98%) 8,451 (3.58%)
[image:8.612.321.556.639.722.2]Fig. 1. Release time line explaining bug and vulnerability selection criteria. For Release 11: the population of possible pre-release bugs is equal to the bugs reports opened in (roughly) 2010. The population of possible post-release vulnerabilities is equal to the vulnerabilities reported in the next year.
bugs as independent variables and future vulnerabilities as dependent variable. In this section we explain in detail the analysis methodology and show the experimental results.
Our first goal was to evaluate the quality of our independent variables. The validity of our future results depends on our ability to distinguish between these the pre-release bug types. Thus, having two or more variables with heavy correlation will increase the comparison difficulty of the next analysis steps.
We applied the Spearman correlation coefficient analysis on our 7 pre-release bug variables looking to remove variables that present high co-linearity. The results from the Spearman correlation coefficient indicate that the pre-release bug varia-bles show a negligible to low correlation with each other. In Table III we present the maximum Spearman correlation coefficient of each variable when we run the test against all other pre-release variables. Even the highest values indicate low correlations, so we did not see strong co-linearity that would interfere with multiple regression.
RQ1. Are source code files fixed for bugs likely to be fixed for future vulnerabilities?
Motivation. Our goal here is to evaluate, in a broad sense, if files that have been frequently fixed for bugs also have a higher probability of being fixed for a vulnerability. This research question serves as an overall measure of quality and security, but does not delve into comparing other factors such as features and security-related bugs (as RQ2 does).
Analysis. To examine how the prelease bugs are re-lated to an increased chance of future vulnerability, we used the two tailed non-parametric Mann-Whitney-Wilcoxon test
(MWW) to examine if a statistically significant correlation exists. We tested the number of pre-release bugs, separating the population in vulnerable and neutral files, and evaluated the becomes vulnerable hypothesis. To examine the amount of overlap between neutral and vulnerable files with respect to number of bugs, We used the Cohen’s D [8] statistic.
The MWW results in Table IV show that in comparison vulnerable files have a larger median pre-release bug count than neutral files; this difference is small but constant for all of our releases. All of our MWW test results were statistically significant (p <0.05). We also included in this analysis the SLOC population to reconfirm finding from related and prior work that vulnerable files tend to be larger in size than neutral files.
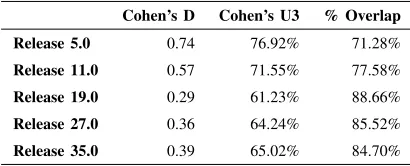
The Cohen’s D statistic is useful for gauging the strength of our MWW results by evaluating the amount of overlap between the vulnerable and neutral populations. This statistic is computed by comparing the two population means and factoring in how many of each population are above the other population’s mean. Our results for Cohen’s D, presented in Table V, show that the lowest amount of overlap between vulnerable and the neutral populations with respect to bugs is 71.28% on Release 5.0. As the project matures, the overall overlap stays above 75%. The Cohen’s D literature indicates that this overlap is considered to be medium-to-large, indi-cating that the association is relatively weak. That is, many neutral files have many bugs and many vulnerable files have few bugs.
TABLE III
SPEARMANRANKCORRELATIONCOEFFICIENTBETWEENPRE-RELEASEBUGVARIABLESPERRELEASE
Release 5.0
Metric (a) (b) (c) (d) (e) (f) (g)
(a) num-pre-features 1.00 0.02 -0.03 -0.12 -0.03 0.03 -0.12
(b) num-pre-compatibility-bugs 0.02 1.00 0.12 0.15 0.01 0.07 0.01 (c) num-pre-regression-bugs -0.03 0.12 1.00 0.03 0.03 0.19 -0.03
(d) num-pre-security-bugs -0.12 0.15 0.03 1.00 -0.03 0.05 0.02
(e) num-pre-tests-fails-bugs -0.03 0.01 0.03 -0.03 1.00 -0.02 0.05
(f) num-pre-stability-crash-bugs 0.03 0.07 0.19 0.05 -0.02 1.00 -0.05
(g) num-pre-build-bugs -0.12 0.01 -0.03 0.02 0.05 -0.05 1.00
Release 11.0
Metric (a) (b) (c) (d) (e) (f) (g)
(a) num-pre-features 1.00 0.01 0.04 -0.02 -0.08 0.06 -0.18
(b) num-pre-compatibility-bugs 0.01 1.00 0.07 0.08 0.02 0.04 0.04 (c) num-pre-regression-bugs 0.04 0.07 1.00 0.13 0.03 0.29 0.01
(d) num-pre-security-bugs -0.02 0.08 0.13 1.00 0.02 0.18 -0.03
(e) num-pre-tests-fails-bugs -0.08 0.02 0.03 0.02 1.00 0.01 0.09
(f) num-pre-stability-crash-bugs 0.06 0.04 0.29 0.18 0.01 1.00 0.00
(g) num-pre-build-bugs -0.18 0.04 0.01 -0.03 0.09 0.00 1.00
Release 19.0
Metric (a) (b) (c) (d) (e) (f) (g)
(a) num-pre-features 1.00 0.07 0.05 0.04 -0.04 -0.07 -0.23
(b) num-pre-compatibility-bugs 0.07 1.00 0.07 0.08 0.02 0.06 -0.03
(c) num-pre-regression-bugs 0.05 0.07 1.00 0.07 0.06 0.19 -0.12 (d) num-pre-security-bugs 0.04 0.08 0.07 1.00 0.04 0.15 -0.06
(e) num-pre-tests-fails-bugs -0.04 0.02 0.06 0.04 1.00 0.02 0.00
(f) num-pre-stability-crash-bugs -0.07 0.06 0.19 0.15 0.02 1.00 -0.14
(g) num-pre-build-bugs -0.23 -0.03 -0.12 -0.06 0.00 -0.14 1.00
Release 27.0
Metric (a) (b) (c) (d) (e) (f) (g)
(a) num-pre-features 1.00 0.04 0.00 -0.07 0.00 -0.05 -0.29
(b) num-pre-compatibility-bugs 0.04 1.00 0.02 0.05 0.00 0.02 -0.01
(c) num-pre-regression-bugs 0.00 0.02 1.00 0.04 0.02 0.13 -0.06 (d) num-pre-security-bugs -0.07 0.05 0.04 1.00 0.01 0.11 -0.05
(e) num-pre-tests-fails-bugs 0.00 0.00 0.02 0.01 1.00 0.01 0.04
(f) num-pre-stability-crash-bugs -0.05 0.02 0.13 0.11 0.01 1.00 -0.03
(g) num-pre-build-bugs -0.29 -0.01 -0.06 -0.05 0.04 -0.03 1.00
Release 35.0
Metric (a) (b) (c) (d) (e) (f) (g)
(a) num-pre-features 1.00 -0.01 -0.32 -0.12 -0.02 -0.10 -0.13
(b) num-pre-compatibility-bugs -0.01 1.00 0.01 0.03 -0.01 0.01 0.00
(c) num-pre-regression-bugs -0.32 0.01 1.00 -0.04 0.03 0.13 -0.06
(d) num-pre-security-bugs -0.12 0.03 -0.04 1.00 0.00 0.02 -0.02 (e) num-pre-tests-fails-bugs -0.02 -0.01 0.03 0.00 1.00 0.01 0.00
(f) num-pre-stability-crash-bugs -0.10 0.01 0.13 0.02 0.01 1.00 -0.02
TABLE IV
MWW TEST RESULTS FORSLOCAND NUM-PRE-BUGS PERRELEASE. ALLRESULTWERESTATISTICALLYSIGNIFICANT(p−value <0.05). Metric Median Vuln. Median Neutral
Release 5.0 SLOC 5.30 4.63
num-pre-bugs 1.95 1.39
Release 11.0 SLOC 5.27 4.26
num-pre-bugs 1.61 1.10
Release 19.0 SLOC 5.31 4.42
num-pre-bugs 1.61 1.39
Release 27.0 SLOC 5.43 4.67
num-pre-bugs 1.79 1.39
Release 35.0 SLOC 5.73 4.76
[image:11.612.71.276.297.380.2]num-pre-bugs 1.94 1.61
TABLE V
COHEN’SD EFFECTSIZESTATISTIC FOR NUM-PRE-BUGS IN VULNERABLE AND NEUTRAL POPULATIONS PERRELEASE.
Cohen’s D Cohen’s U3 % Overlap
Release 5.0 0.74 76.92% 71.28%
Release 11.0 0.57 71.55% 77.58%
Release 19.0 0.29 61.23% 88.66%
Release 27.0 0.36 64.24% 85.52%
Release 35.0 0.39 65.02% 84.70%
future. However, this association has many counterexamples, leading to a weak association overall.
RQ2. Are some types of bugs more closely related to vulnera-bilities than others?
Motivation. From RQ1, we learned that, in aggregate, a connection between bugs and vulnerabilities exists in Chromium across multiple releases. However, bugs come in many different forms. Some bugs can be related to maintaining compatibility across operating systems, other might be related to stability problems that could foreshadow future vulnera-bilities. For example, code with a history bugs related to 32-bit and 64-bit builds might have integer overflow problems that become exploitable.
Furthermore, we use this sub-category analysis to gauge the strength of the connection between bugs and vulnerabilities. In particular, we use SLOC, features, and security-related bugs as bases of comparison against non-security bugs.
Thus, our objective in this question is twofold: (a) identify trends between specific types of bugs and the occurrence of future vulnerabilities, and (b) compare those types to baselines of SLOC, security-related bugs, and features.
Analysis. We performed logistic regression analysis to eva-luate these patterns by comparing the model quality. We based the model quality in two statistical tests: model goodness of fit (how well the created model fits the data) and model performance (how well model is able explain the data). We
TABLE VI
CATEGORYMODELSBASED ONBUGTYPES
Metric Description
fit-base Our base model based only on SLOC.
fit-num-pre-bugs Based on SLOC + num-pre-bugs.
fit-features Bug category based on SLOC + num-pre-features.
fit-security Bug category based on SLOC + num-pre-security-bugs.
fit-stability Bug category based on SLOC + num-pre-stability-bugs + num-pre-compatibility-bugs + num-pre-regression-bugs.
fit-build Bug category based on SLOC + num-pre-build-bugs + num-pre-tests-fails-num-pre-build-bugs.
must point out, however, that these analyses for tocomparing
categories of bugs, not to create an overall vulnerability
prediction model as has been done in other literature [2]–[4], [19].
To implement this approach first we built a base model based on SLOC, to serve as the baseline for evaluating the improvement in model quality that each pre-bug-metrics produces. Our RQ1 results, as well as other studies [28] have shown that files with higher SLOC are more likely to be vulnerable.
We continued this process by performing a forward selection of the variables, building models adding one pre-release bug type at a time, we managed to identify 4 groups of pre-release bug variables that can be represented in logical bug categories and show model quality improvement over the individual pre-release bug types. The description of each of these category groups can be found on Table VI.
Finally we compared the variance on the overall quality of the output that each category group introduces.
Goodness of fit: These metrics present a way to evaluate
how well a model fits the data when compared to other models, in our case the base model. In this step we measured: a) The AIC of each modelb) and the D2.
Our results show that adding the pre-release bug metrics have a positive effect overall on the quality of the models, but we found this relation to be weak and not constant.
On Release 5.0 and 11.0, the modelfit-num-pre-bugs, show the strongest correlation with improvement of model goodness of fit.
We also found that fit-security and fit-features present the stronger positive association when compared to the other category models on almost all releases, averaging -2.78% and -0.84% of AIC reduction respectively. One exception to this trend is Release 27, where the modelfit-featuresis associated with a lower quality model (increased AIC). While other category models are also associated with lower AIC, we found that the improvement is not as significant when compared to the baseline SLOC model.
TABLE VII
GOODNESS OF FITMETRICS FORPRE-RELEASE OFBUG BASED CATEGORYMODELSPERRELEASE
Release 5.0
Model AIC AIC DEC D2 D2 INC
fit-base 1424.40 - 0.04
-fit-num-pre-bugs 1377.40 -3.30% 0.07 86.39%
fit-security 1402.20 -1.56% 0.05 42.68%
fit-features 1423.90 -0.04% 0.04 4.34%
fit-stability 1419.50 -0.34% 0.05 19.25%
fit-build 1423.80 -0.04% 0.04 8.09%
Release 11.0
Model AIC AIC DEC D2 D2 INC
fit-base 3098.40 - 0.08
-fit-num-pre-bugs 3093.00 -0.17% 0.08 2.69%
fit-security 3095.90 -0.08% 0.08 1.65%
fit-features 3071.10 -0.88% 0.09 10.73%
fit-stability 3090.50 -0.25% 0.09 5.08%
fit-build 3099.20 0.03% 0.08 1.15%
Release 19.0
Model AIC AIC DEC D2 D2 INC
fit-base 2365.60 - 0.04
-fit-num-pre-bugs 2367.00 0.06% 0.04 0.60%
fit-security 2358.60 -0.30% 0.05 8.50%
fit-features 2337.90 -1.17% 0.05 28.06%
fit-stability 2361.30 -0.18% 0.05 9.75%
fit-build 2350.10 -0.66% 0.05 18.41%
Release 27.0
Model AIC AIC DEC D2 D2 INC
fit-base 2432.50 - 0.04
-fit-num-pre-bugs 2434.40 0.08% 0.04 0.02%
fit-security 2286.10 -6.02% 0.10 134.10%
fit-features 2434.10 0.07% 0.04 0.34%
fit-stability 2427.50 -0.21% 0.05 9.88%
fit-build 2421.90 -0.44% 0.05 13.11%
Release 35.0
Model AIC AIC DEC D2 D2 INC
fit-base 1038.20 - 0.03
-fit-num-pre-bugs 1040 0.17% 0.03 0.47%
fit-security 976.42 -5.95% 0.09 180.41%
fit-features 1015.50 -2.19% 0.06 69.82%
fit-stability 1038.70 0.05% 0.04 15.50%
fit-build 1038.70 0.05% 0.04 25.01%
TABLE VIII
PERFORMANCEMETRICS FORPRE-RELEASEBUGBASEDCATEGORY MODELPERRELEASE
Release 11.0
Model Precision Recall F-measure AUC
fit-base 0.29 0.35 0.32 70.89%
fit-num-pre-bugs 0.24 0.49 0.32 66.63%
fit-security 0.28 0.34 0.31 70.41%
fit-features 0.25 0.50 0.33 71.97%
fit-stability 0.26 0.41 0.32 69.92%
fit-build 0.25 0.48 0.33 70.86%
Release 19.0
Model Precision Recall F-measure AUC
fit-base 0.11 0.31 0.16 66.84%
fit-num-pre-bugs 0.09 0.48 0.15 66.12%
fit-security 0.11 0.34 0.17 67.06%
fit-features 0.10 0.46 0.16 68.77%
fit-stability 0.09 0.41 0.15 66.40%
fit-build 0.09 0.44 0.16 67.61%
Release 27.0
Model Precision Recall F-measure AUC
fit-base 0.11 0.32 0.16 66.48%
fit-num-pre-bugs 0.07 0.51 0.13 66.57%
fit-security 0.15 0.40 0.21 70.03%
fit-features 0.07 0.50 0.11 65.54%
fit-stability 0.08 0.46 0.13 66.35%
fit-build 0.08 0.48 0.14 68.42%
Release 35.0
Model Precision Recall F-measure AUC
fit-base 0.04 0.35 0.07 66.50%
fit-num-pre-bugs 0.03 0.54 0.05 66.48%
fit-security 0.06 0.51 0.10 75.34%
fit-features 0.03 0.47 0.06 67.31%
fit-stability 0.03 0.45 0.06 65.90%
73.47% and 22.66% improvement respectively over the base model. Reconfirming the trend that among the evaluated bug categories fit-security and fit-features present the strongest correlation with chances of vulnerabilities.
The complete result set for the goodness of fit metrics is shown in Table VII. The models with the best fit are shown in bold, and represent the strongest association with post-release vulnerabilities.
Model Performance: In this step we evaluate the variance
in explanatory power that each bug category produces, when the category models are used to predict the probability of vulnerabilities and compared against next release data. We used next-release validation on four releases, meaning that we used the data from one release to train a model, then apply that model to the subsequent release. Next-release validation is particularly helpful because it simulates the data that the team could have feasibly collected at that time in history.
In our validation, we examining the following statistics:
a) Precision and recall,b) F-measure,c) Area under the ROC (AUC).
We compare these statistics to the output of the base model. We present our findings in Table VIII showing the performance improvement of each model.
In these results we notice that the category model fit-securityis associated with improvement of the precision in 3 out of 4 evaluated releases. The category model fit-num-pre-bugsis associated with an increase in the recall measurement in in 3 out of 4 evaluated releases. The results show that again
fit-security is associated with an improvement in F-measure. In terms of AUC we found that the models fit-security and
fit-features have a stronger positive relation than the other models.
Results Interpretation: Summarizing the results from both
aspects “model goodness fit” and “model performance” we notice that, when compared to baselines of features, SLOC, and security bugs, traditional non-security bugs have a positive but weak association with vulnerabilities. Among the results, the strongest positive correlation with overall model quality was found in the variables release feature bugs and pre-release security bugs. But even with this existing association, the improvement over our baseline model is very small and the overall predictive power is relatively small compared to the literature [3], [12], [28], [29].
This result is particularly interesting given that several sub-categories of bugs are related to security properties. System stability is key to providing availability (i.e. preventing denial-of-service attacks), so one might assume that stability prob-lems in a file’s past may lead to vulnerability probprob-lems in the future, but this effect was small.
This weak association presents no evidence that bugs and vulnerabilities are empirically similar groups. And it shows that it can be tough call to identify future vulnerabilities based solely on the pre-release bug history. We advice to include other vulnerability identification patterns where needed [29].
RQ3. Do the source code files with the most bugs also have the most vulnerabilities?
Motivation. In this question, we want to simulate how bugs could be used in practice. In industry due to constant schedule pressures, last-minute security audits are common and reviewers have limited resources to perform a thorough code inspection.
Because bugs represent missing or wrong intended functionality, most review efforts focus on fixing these type of bugs, this it will represent profit for the business and the team will get closer to shipping the product or feature. Additionally as we have stated before, bugs are more common and visible problem, when contrasted to vulnerabilities.
Thus, a software team might be tempted to use the concept “bugginess” (defect density) as their only guide to prioritize code inspections inspections, here we want to explore how well will that guide work to point out the files that would later need to be fixed for vulnerabilities?
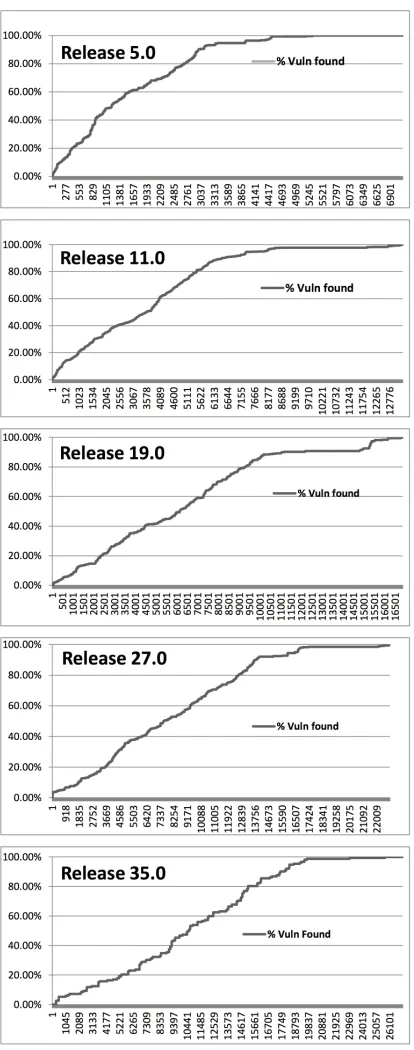
Analysis. To explore this question, we present alift curve
for each release demonstrating how many vulnerabilities exist in the top-ranked files by defect density. Figure 3 shows these results by release. As an interpretation example of the charts, in Release 11.0, 60% of the post-release vulnerabilities can be found in the top 30% of the buggiest files. While this ranking is better than random (i.e. roughly a diagonal line), the prediction capabilities of defect density is significantly worse than what is found in the vulnerability prediction literature [28], [29].
Consider this results in a common industry code review sce-nario, where we are reviewers focusing on important features and were only able to inspect 20 files, lest say of about 25 lines of code or more. If we used defect density and size (SLOC) to rank and prioritize the files for review at each release, based on our results those files would, at best, contain 1.4% of the vulnerabilities. An optimal top-20 file ranking would account for an average of 12% of vulnerabilities, so ranking by defect density is far from optimal.
The situation gets worse, however, if we went the other way round examining the question from the direction of vulnerabilities: ranking by files with the mostvulnerabilities
per SLOC. In this case, across the five releases, none of the Top 20 files with the most vulnerabilities per SLOC appear in the Top 20 of the buggiest files.
Our results show that top buggy files contain only some of the vulnerabilities, accentuating even more the differences between bugs and vulnerabilities.
RQ4. Does experience in reviewing bugs boost vulnerabilities awareness?
Fig. 3. Lift curves of % vulnerabilities found when ranked by num-pre-bugs shows a weak association
only exists to some degree. But even in within overlap, re-viewers might be still be missing vulnerabilities if they are not practiced at recognizing them. Thus, developer experience can be a factor in whether or not a vulnerabilities are prevented.
[image:14.612.320.557.82.257.2]In a given project, developers can have many different types of experience that can shape the type of feedback they provide. For example a reviewer that has solved many stability problems becomes familiar with the patterns that lead to this
TABLE IX
FILE-LEVELREVIEWEXPERIENCEMETRICSCOMPUTEDPERRELEASE
Metric Description
security experience Average number of reviewers that had previously worked on a fix referencing a bug labeled as”type-bug-security”.
stability experience Average number of reviewers that had previously worked on a fix referencing a bug labeled as”stability-crash”.
build experience Average number of reviewers that had previously worked on a fix referencing a bug labeled as”build”.
test fail experience Average number of reviewers that had previously worked on a fix referencing a bug labeled as”cr-tests-fails”.
compatibility experience Average number of reviewers that had previously worked on a fix referencing a bug labeled as”type-compat”.
types of failures, making him a good asset in stability code review. Our previous study [4] showed that vulnerable files have less security-experienced reviewers than neutral files. Borrowing this concept we have expanded the experience data set with new types of bug-related experience metrics.
We calculated the experience metrics at the file level using the following procedure: If a reviewer participates in a code review for a commit labeled with a specific bug type, we say this reviewer earned experience with this type of bug. Then when we separate the data into releases, we evaluate each file and aggregate and average the number of specific bug experienced reviewers that it had during that release time span. The experience metrics are presented in Table IX.
In this area we do not take into account bugsfeature nor
regressionas they are more common traditional changes, and every reviewer will have some experience in this areas. We encourage future research to evaluate the effects of these two types of experience.
Approach. For this question we employed a similar methodology as in RQ1 and R2. We performed a Mann-Whitney-Wilcoxon test (MWW) and employed logistic re-gression analysis to evaluate the goodness of fit when com-pared against our base model SLOC. Finally we compare these results against the bug results of RQ2 and look for trends in the types of bugs.
Analysis. We start by performing a Spearman corre-lation coefficient analysis on the experience metrics to iden-tify and remove possible variable duplication, these re-sults are presented in Table X. We noticed that the met-ricsstability experienceandbuild experiencepresent simi-lar correlation. From this result have decided to only se-lect build experience to represent both metrics. We will also like to point out that for Release 5.0 there were no
TABLE X
SPEARMANRANKCORRELATIONCOEFFICIENTBETWEENEXPERIENCEVARIABLESPERRELEASE
Release 5.0
Metric security experience stability experience build experience test fail experience compatibility experience
bug security experience 1.00 0.45 0.50 NA 0.34
stability experience 0.45 1.00 0.43 NA 0.29
build experience 0.50 0.43 1.00 NA 0.32
test fail experience NA NA NA NA NA
compatibility experience 0.34 0.29 0.32 NA 1.00
Release 11.0
Metric security experience stability experience build experience test fail experience compatibility experience
bug security experience 1.00 0.38 0.38 0.25 0.31
stability experience 0.38 1.00 0.54 0.17 0.24
build experience 0.38 0.54 1.00 0.16 0.25
test fail experience 0.25 0.17 0.16 1.00 0.28
compatibility experience 0.31 0.24 0.25 0.28 1.00
Release 19.0
Metric security experience stability experience build experience test fail experience compatibility experience
bug security experience 1.00 0.52 0.50 0.41 0.42
stability experience 0.52 1.00 0.64 0.30 0.30
build experience 0.50 0.64 1.00 0.34 0.33
test fail experience 0.41 0.30 0.34 1.00 0.11
compatibility experience 0.42 0.30 0.33 0.11 1.00
Release 27.0
Metric security experience stability experience build experience test fail experience compatibility experience
bug security experience 1.00 0.39 0.34 0.31 0.30
stability experience 0.39 1.00 0.59 0.28 0.21
build experience 0.34 0.59 1.00 0.30 0.23
test fail experience 0.31 0.28 0.30 1.00 0.16
compatibility experience 0.30 0.21 0.23 0.16 1.00
Release 35.0
Metric security experience stability experience build experience test fail experience compatibility experience
bug security experience 1.00 0.43 0.41 0.25 0.29
stability experience 0.43 1.00 0.65 0.32 0.23
build experience 0.41 0.65 1.00 0.33 0.24
test fail experience 0.25 0.32 0.33 1.00 0.23
TABLE XI
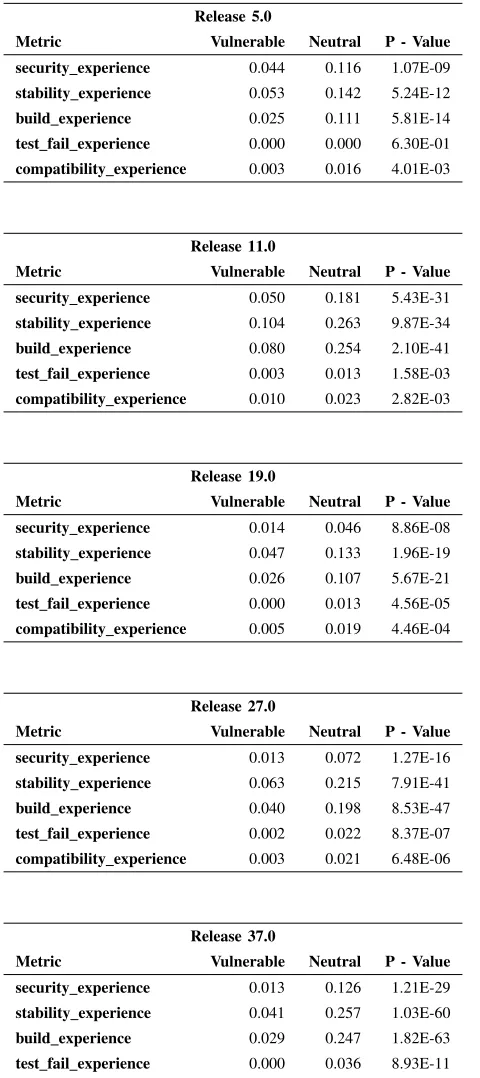
MWW TEST RESULTS FOREXPERIENCEMETRICS PERRELEASE. HERE WE PRESENT THEMEAN,AS THE MEDIAN WAS ZERO IN MANY CASES.
Release 5.0
Metric Vulnerable Neutral P - Value
security experience 0.044 0.116 1.07E-09
stability experience 0.053 0.142 5.24E-12
build experience 0.025 0.111 5.81E-14
test fail experience 0.000 0.000 6.30E-01
compatibility experience 0.003 0.016 4.01E-03
Release 11.0
Metric Vulnerable Neutral P - Value
security experience 0.050 0.181 5.43E-31
stability experience 0.104 0.263 9.87E-34
build experience 0.080 0.254 2.10E-41
test fail experience 0.003 0.013 1.58E-03
compatibility experience 0.010 0.023 2.82E-03
Release 19.0
Metric Vulnerable Neutral P - Value
security experience 0.014 0.046 8.86E-08
stability experience 0.047 0.133 1.96E-19
build experience 0.026 0.107 5.67E-21
test fail experience 0.000 0.013 4.56E-05
compatibility experience 0.005 0.019 4.46E-04
Release 27.0
Metric Vulnerable Neutral P - Value
security experience 0.013 0.072 1.27E-16
stability experience 0.063 0.215 7.91E-41
build experience 0.040 0.198 8.53E-47
test fail experience 0.002 0.022 8.37E-07
compatibility experience 0.003 0.021 6.48E-06
Release 37.0
Metric Vulnerable Neutral P - Value
security experience 0.013 0.126 1.21E-29
stability experience 0.041 0.257 1.03E-60
build experience 0.029 0.247 1.82E-63
test fail experience 0.000 0.036 8.93E-11
compatibility experience 0.002 0.027 1.95E-07
Following the Spearman analysis we separated the files into vulnerable and neutral and employed a MWW test to evaluate the difference of means in terms of experience. In this step we used the mean value because we found many medians values to be zero.
The MWW results displayed in Table XI show in all the cases that neutral files have more experienced reviewers than vulnerable files, this indicates that having more bug experienced reviewers, decreases the probability of future vulnerabilities. The results were statistically significant also in all occurrences, here we borrow from our previous work [4] the Bonferoni correction by dividing the alpha threshold by the number of hypotheses, in this case we have five variables, thus we check forp <0.01instead of the standard p <0.05. We gather an interesting insight when we weight the impact of the different experience metrics, noticing that among the results build experience, test fail experience and compat-ibility experience have a larger impact in the reduction of the vulnerability probability, than security experience in all the releases. For example on Release 5, the metric compatibil-ity experiencehas an impact of 433.33% on the vulnerability outcome, while security experience has only a 163.64% impact. We can see this as a sound outcome as a person that has experience in different environments, gains awareness of all the different variables that come into play in these systems (file systems, interfaces, etc.), and with this expanded awareness comes a better understanding of vulnerability attack points.
To continue our analysis we created four new logistic models, and calculated the AIC and the D2 for each one of
them, these results are presented in Table XII. The results we got from this analysis vary greatly from release to release. For example on Release 5.0 the model build experienced
presents a 2.23% decrement in AIC, when compared to the base model. On almost all releases the results on AIC scores are very close, with the model security experienced being the most effective, except for Release 35.0. The D2 results show that the experience metrics do not significantly increase the amount of deviance explained by the base model.
From this models we found that bug based experience has little to no influence in improving the quality of the base model. These results show that while in most of our cases the added experience slightly increases model quality, we found no evidence of a strong positive association between experience reviewing for bugs and increased model quality.
Finally we contrasted the Bug based models from RQ2 with the Experience based models, evaluating which set of metrics has a better fit in our data set when we use future vulnera-bilities as our dependent variable. The comparison presented in Table XIII shows thatexperience based variablesproduce a better fitted model in 3 of our 5 evaluated releases. We also notice the models based security andbuild present the best fit almost all of the cases across bug and experience, but the improvement keeps being small when compared to the base model.
TABLE XII
MODELGOODNESS OFFITRESULTS FOREXPERIENCEMETRICSPER RELEASE
Release 5.0
Model AIC AIC DEC D2 D2 INC
fit-base 1424.40 - 0.04
-security experienced 1398.20 -1.84% 0.04 0.64%
build experienced 1392.60 -2.23% 0.04 10.76%
test fail experienced 1396.20 -1.98% 0.04 0.64%
compatibility experienced 1395.60 -2.02% 0.04 5.37%
Release 11.0
Model AIC AIC DEC D2 D2 INC
fit-base 3098.40 - 0.08
-security experienced 3079.60 -0.61% 0.08 -1.51%
build experienced 3080.50 -0.58% 0.08 -1.83%
test fail experienced 3081.60 -0.54% 0.08 -2.27%
compatibility experienced 3080.40 -0.58% 0.08 -1.79%
Release 19.0
Model AIC AIC DEC D2 D2 INC
fit-base 2365.60 - 0.04
-security experienced 2362.80 -0.12% 0.04 4.13%
build experienced 2366.10 0.02% 0.04 1.06%
test fail experienced 2363.30 -0.10% 0.04 3.66%
compatibility experienced 2366.00 0.02% 0.04 1.17%
Release 27.0
Model AIC AIC DEC D2 D2 INC
fit-base 2432.50 - 0.04
-security experienced 2434.10 0.07% 0.04 -0.09%
build experienced 2433.70 0.05% 0.04 0.23%
test fail experienced 2433.30 0.03% 0.04 0.66%
compatibility experienced 2434.00 0.06% 0.04 -0.03%
Release 35.0
Model AIC AIC DEC D2 D2 INC
fit-base 1038.20 - 0.03
-security experienced 1038.20 0.00% 0.03 1.81%
build experienced 1037.70 -0.05% 0.03 3.39%
test fail experienced 1037.40 -0.08% 0.03 4.00%
compatibility experienced 1037.60 -0.06% 0.03 3.54%
TABLE XIII
MODELGOODNESS OFFITCOMPARISONBETWEENBUGS AND EXPERIENCEMETRICSPERRELEASE
Release 5.0
Model Bug AIC Experience AIC Variation
fit-base 1424.40
security 1402.20 (-1.56%) 1398.20 (-1.84%) 0.29%
build 1423.80 (-0.04%) 1392.60 (-2.23%) 2.24%
compatibility 1419.50 (-0.34%) 1395.60 (-2.02%) 1.61%
Release 11.0
Model Bug AIC Experience AIC Variation
fit-base 3098.40
security 3095.90 (-0.08%) 3079.60 (-0.61%) 0.53%
build 3099.20 (0.03%) 3080.50 (-0.58%) 0.61%
compatibility 3090.50 (-0.25%) 3080.40 (-0.58%) 0.29%
Release 19.0
Model Bug AIC Experience AIC Variation
fit-base 2365.60
security 2358.60 (-0.3%) 2362.80 (-0.12%) -0.18%
build 2350.10 (-0.66%) 2366.10 (0.02%) -0.68%
compatibility 2361.30 (-0.18%) 2366.00 (0.02%) -0.16%
Release 27.0
Model Bug AIC Experience AIC Variation
fit-base 2432.50
security 2286.10 (-6.02%) 2434.10 (0.07%) -6.08%
build 2421.90 (-0.44%) 2433.70 (0.05%) -0.48%
compatibility 2427.50 (-0.21%) 2434.00 (0.06%) -0.28%
Release 35.0
Model Bug AIC Experience AIC Variation
fit-base 1038.20
security 976.42 (-5.95%) 1038.20 (0.00%) -5.95%
build 1038.70 (0.05%) 1037.60 (-0.06%) 0.10%
VII. THREATS TOVALIDITY
We chose the Chromium project as a large, open source project to be representative of many large software projects. But, as with any empirical study, these results may be specific to the Chromium project. Labels such as the ones we used were based on our own investigation of Chromium, and may not generalize to other project (e.g. different development teams may define “stability bugs” differently).
In this study we depend on the recorded information of bugs and vulnerabilities. We do not have the knowledge of issues that were fixed, but never reported to the bug tracking system or to the National Vulnerability Database.
By presenting the variance in the model fitness and per-formance metrics, we caution the reader about the overall predictability of vulnerabilities. Other studies (even our own [28]) have shown prediction models of vulnerabilities that outperform the models here. The multiple regression models are formed as a comparison of multiple groups of metrics.
Because we are using the code reviews as our key point of relation between bugs and vulnerabilities, the utilization of the same code reviews to study for experience trends might introduce an auto-correlation bias, and even when taking this into account we did not found a positive association. We encourage further analysis on this topic to strengthen our findings.
We compared the quality of the models from one release with data of the next release. It is also possible to combine models from multiple releases to identify bug patterns that take more time to reveal its effects on vulnerabilities. We could for example average the prediction results of Release 5.0, 11.0, 19.0 and 27.0 to evaluate the probability of vulnerabilities in Release 35.0. However we postpone this investigation for future work.
VIII. SUMMARY
In this study we evaluated the correlation between pre-release bugs, reviewer experience and post-pre-release vulnera-bilities on the Chromium project. The results show that, while an empirical connection between bugs and vulnerabilities exist, the connection is considerably weak. The strongest indi-cators of vulnerability are past security-related bugs and new features - neither of which are non-security bugs. Furthermore, the buggiest files do not intersect with the files with many vulnerabilities. Additionally we looked into how experience in reviewing bug issues can help increase vulnerabilities aware-ness, finding that while experience based metrics preform better than bug based metrics, the influence of experience still weak. This evidence underscores the conceptual difference between bugs and vulnerabilities, and indicates that additional empirical research must be directed at vulnerability data specifically.
ACKNOWLEDGMENTS
This research is supported by the National Science Foun-dation (grant CCF-1441444). Any opinions, findings, and conclusions or recommendations expressed in this material are
those of the author(s) and do not necessarily reflect the views of the National Science Foundation. We thank the Software Archeology group at RIT for their valuable contributions to this work.
REFERENCES
[1] I. V. Krsul, “Software vulnerability analysis,” Ph.D. dissertation, Purdue University, 1998.
[2] T.-H. Chen, S. Thomas, M. Nagappan, and A. Hassan, “Explaining software defects using topic models,” inMining Software Repositories (MSR), 2012 9th IEEE Working Conference on, June 2012, pp. 189–198. [3] M. Gegick, P. Rotella, and L. Williams, “Predicting attack-prone com-ponents,” in Software Testing Verification and Validation, 2009. ICST ’09. International Conference on, April 2009, pp. 181–190.
[4] A. Meneely, A. C. R. Tejeda, B. Spates, S. Trudeau, D. Neuberger, K. Whitlock, C. Ketant, and K. Davis, “An empirical investigation of socio-technical code review metrics and security vulnerabilities,” in Proceedings of the 6th International Workshop on Social Software Engineering, ser. SSE 2014. New York, NY, USA: ACM, 2014, pp. 37– 44. [Online]. Available: http://doi.acm.org/10.1145/2661685.2661687 [5] D. Tegarden, S. Sheetz, and D. Monarchi, “Effectiveness of traditional
software metrics for object-oriented systems,” inSystem Sciences, 1992. Proceedings of the Twenty-Fifth Hawaii International Conference on, vol. iv, Jan 1992, pp. 359–368 vol.4.
[6] M. Mukaka, “A guide to appropriate use of correlation coefficient in medical research,”Malawi Medical Journal, vol. 24, no. 3, pp. 69–71, 2012.
[7] N. F. Schneidewind, “Methodology for validating software metrics,” Software Engineering, IEEE Transactions on, vol. 18, no. 5, pp. 410– 422, 1992.
[8] J. Cohen,Statistical power analysis for the behavioral sciences. Aca-demic press, 2013.
[9] J. Ruscio, “A probability-based measure of effect size: Robustness to base rates and other factors.”Psychological Methods, vol. 13, no. 1, p. 19, 2008.
[10] K. K. Zakzanis, “Statistics to tell the truth, the whole truth, and nothing but the truth: formulae, illustrative numerical examples, and heuristic interpretation of effect size analyses for neuropsychological researchers,” Archives of clinical neuropsychology, vol. 16, no. 7, pp. 653–667, 2001. [11] J. Cohen, “Statistical power analysis,”Current directions in
psycholog-ical science, pp. 98–101, 1992.
[12] A. Cruz and K. Ochimizu, “Towards logistic regression models for pre-dicting fault-prone code across software projects,” inEmpirical Software Engineering and Measurement, 2009. ESEM 2009. 3rd International Symposium on, Oct 2009, pp. 460–463.
[13] A. E. Raftery, “Bayesian model selection in social research,” Sociolog-ical methodology, vol. 25, pp. 111–164, 1995.
[14] K. P. Burnham and D. R. Anderson, “Multimodel inference understand-ing aic and bic in model selection,”Sociological methods & research, vol. 33, no. 2, pp. 261–304, 2004.
[15] A. Guisan and N. E. Zimmermann, “Predictive habitat distribution models in ecology,”Ecological modelling, vol. 135, no. 2, pp. 147–186, 2000.
[16] T. Y. Chen, F.-C. Kuo, and R. Merkel, “On the statistical properties of the f-measure,” inQuality Software, 2004. QSIC 2004. Proceedings. Fourth International Conference on, Sept 2004, pp. 146–153. [17] M. Gegick, L. Williams, J. Osborne, and M. Vouk, “Prioritizing software
security fortification throughcode-level metrics,” inProceedings of the 4th ACM workshop on Quality of protection. ACM, 2008, pp. 31–38. [18] A. Bosu, “Characteristics of the vulnerable code changes identified through peer code review,” in Companion Proceedings of the 36th International Conference on Software Engineering. ACM, 2014, pp. 736–738.
[19] E. Shihab, A. Mockus, Y. Kamei, B. Adams, and A. E. Hassan, “High-impact defects: a study of breakage and surprise defects,” in Proceed-ings of the 19th ACM SIGSOFT symposium and the 13th European conference on Foundations of software engineering. ACM, 2011, pp. 300–310.
[21] D. Mitropoulos, G. Gousios, and D. Spinellis, “Measuring the occur-rence of security-related bugs through software evolution,” in Informat-ics (PCI), 2012 16th Panhellenic Conference on, Oct 2012, pp. 117–122. [22] C. Tantithamthavorn, S. McIntosh, A. E. Hassan, A. Ihara, and K. ichi Matsumoto, “The impact of mislabelling on the performance and inter-pretation of defect prediction models,” inProc. of the 37th Int’l Conf. on Software Engineering (ICSE), 2015, p. To appear.
[23] W. Poncin, A. Serebrenik, and M. van den Brand, “Process mining software repositories,” in Software Maintenance and Reengineering (CSMR), 2011 15th European Conference on, March 2011, pp. 5–14. [24] C. Bird, P. Rigby, E. Barr, D. Hamilton, D. German, and P. Devanbu,
“The promises and perils of mining git,” inMining Software Reposito-ries, 2009. MSR ’09. 6th IEEE International Working Conference on, May 2009, pp. 1–10.
[25] M. Fischer, M. Pinzger, and H. Gall, “Populating a release history database from version control and bug tracking systems,” inSoftware Maintenance, 2003. ICSM 2003. Proceedings. International Conference on. IEEE, 2003, pp. 23–32.
[26] D. Behl, S. Handa, and A. Arora, “A bug mining tool to identify and analyze security bugs using naive bayes and tf-idf,” in Optimization, Reliabilty, and Information Technology (ICROIT), 2014 International Conference on, Feb 2014, pp. 294–299.
[27] A. Meneely, H. Srinivasan, A. Musa, A. Rodriguez Tejeda, M. Mokary, and B. Spates, “When a patch goes bad: Exploring the properties of vulnerability-contributing commits,” inEmpirical Software Engineering and Measurement, 2013 ACM / IEEE International Symposium on, Oct 2013, pp. 65–74.
[28] Y. Shin, A. Meneely, L. Williams, and J. Osborne, “Evaluating complex-ity, code churn, and developer activity metrics as indicators of software vulnerabilities,”Software Engineering, IEEE Transactions on, vol. 37, no. 6, pp. 772–787, Nov 2011.