0022-538X/96/$04.0010
Copyrightq1996, American Society for Microbiology
Human Immunodeficiency Virus Type 1 Infection of H9 Cells
Induces Increased Glucose Transporter Expression
LYNN R. SORBARA,1FRANK MALDARELLI,2GEORGES CHAMOUN,3BRIAN SCHILLING,3
SUDHICHAI CHOKEKIJCAHI,4LOUIS STAUDT,5HIROAKI MITSUYA,4
IAN A. SIMPSON,1ANDSTEVEN L. ZEICHNER3*
Diabetes Branch, National Institute of Diabetes and Digestive and Kidney Diseases,1Laboratory of Molecular
Microbiology, National Institute of Allergy and Infectious Diseases,2and Pediatric Branch,3Medicine Branch,4and
Metabolism Branch,5National Cancer Institute, Bethesda, Maryland 20892
Received 18 April 1996/Accepted 1 July 1996
A clone obtained from a differential display screen for cellular genes with altered expression during human immunodeficiency virus (HIV) infection matched the sequence for the human GLUT3 facilitative glucose transporter, a high-velocity–high-affinity facilitative transporter commonly expressed in neurons of the central nervous system. Northern (RNA) analysis showed that GLUT3 expression increased during infection. Flow cytometry showed that GLUT3 protein expression increased specifically in the HIV-infected cells; this increase correlated with increased 2-deoxyglucose transport in the HIV-infected culture. HIV infection therefore leads to increased expression of a glucose transporter normally expressed at high levels in other cell types and a corresponding increase in glucose transport activity. If HIV infection places increased metabolic demands on the host cell, changes in the expression of a cellular gene that plays an important role in cellular metabolism might provide a more favorable environment for viral replication.
Glucose enters most cells through a facilitated diffusion mechanism mediated by a family of integral membrane trans-porter proteins. Seven genes, GLUT1 to GLUT7, named in their order of cloning, encode the currently characterized fa-cilitative glucose transporters (for review, see reference 2). GLUT1 is expressed in many tissues and is probably respon-sible for basal glucose uptake into most cells. GLUT3 is ex-pressed principally in mammalian brain tissue. In humans, GLUT3 is also expressed at high levels in sperm, platelets, and placenta tissue (12). It has a high affinity for glucose and the highest transport velocity of all the transporters (25). The other transporters mediate glucose uptake in certain special-ized cell types and intracellular compartments with various affinities and activities.
About 25 years ago, several laboratories began to investigate the metabolic changes that accompany viral infection and transformation, including changes in glucose transport activity. They found that murine sarcoma virus- and Rous sarcoma virus-infected and -transformed cells take up more glucose than do normal cells (14, 15, 30). Experiments with tempera-ture-sensitive Rous sarcoma viruses demonstrated that cells infected or transformed with the mutant viruses transported more glucose at the permissive temperature than they did at the nonpermissive temperature (20, 27). Some studies de-scribed changes only in the Vmax of glucose transport (30),
while others also described changes in glucoseKm(14), which
were accepted as evidence for the induction of previously non-expressed transporter types. Some investigators took the changes in glucose transport activity as a marker for the trans-formed or infected state. They argued that transtrans-formed and infected cells had increased metabolic demands which were served by the increase in glucose transport (30, 31). Infection and transformation by other nonretroviruses such as
polyoma-virus and Sindbis polyoma-virus also lead to increases in glucose trans-port (7, 10, 17).
When the transporter protein genes were cloned and char-acterized, it became apparent that different mechanisms could lead to the increase in glucose transport, depending on the virus and cell type. Transformation of mouse cells bysrcleads to increased expression of GLUT1 (3, 9, 33, 34). In chicken embryo fibroblasts,srcincreases glucose transport both by al-tering the turnover of the GLUT1-like transporter and by increasing expression of the GLUT3-like transporter (32–34). Recently, polyomavirus was found to increase glucose trans-port in its host cells by increasing the amounts of GLUT1 in the plasma membrane through a posttranslational mechanism (35). In addition to treatment with viruses, treatment with growth factors and glucose deprivation can also lead to an increase in glucose transporter expression and glucose trans-port, but these are also largely changes in GLUT1 expression (16, 22, 28).
Here we show that human immunodeficiency virus (HIV) infection of H9 lymphocytic cells leads to an increase in GLUT3 RNA and protein expression, accompanied by an in-crease in glucose transport in the infected cells.
As part of a larger effort to identify cellular genes with altered expression during HIV infection, we are conducting a screen in H9 cells infected with HIVLAIusing differential
dis-play (23). Clone 15 obtained in the screen contained a 207-base insert that matched the gene for GLUT3 (GenBank accession no. M20681 [21]). A probe was prepared from clone 15 and hybridized to a Northern (RNA) blot made with RNA from a 4-day time course infection. In our infection experiments, H9 cells were grown in RPMI 1640–15% fetal bovine serum and, to ensure an adequate supply of glucose and prevent glucose-deprivation-induced increases in transporter expression, the medium was supplemented daily with an additional 10 mM glucose, which was sufficient to maintain the glucose concen-tration of the culture medium above 4 mM (data not shown). The cells were split daily and maintained between 0.53 106
and 1.03106cells per ml. The cells were exposed to HIV LAI
* Corresponding author. Mailing address: Pediatric Branch, NCI, NIH, Building 10, Room 13N240, Bethesda, MD 20892. Phone: (301) 402-3637. Fax: (301) 402-0575. Electronic mail address: zeichner @box-z.nih.gov.
7275
on November 9, 2019 by guest
http://jvi.asm.org/
(ABI) at a multiplicity of infection of approximately 1 to 2, and samples were taken from mock-infected (uninfected) cells and cells exposed to virus. Cells were collected at the times indi-cated in the figures, through 4 days after infection, the time for a single replication cycle under these conditions (6). RNA was prepared by a modification of the procedure of Chomczynski and Sacchi (5), and Northern blots were prepared with 0.5mg of poly(A)1RNA essentially as described previously (1). The blots were probed with an antisense, in vitro-synthesized RNA probe (Promega) made from clone 15 (cloned in pCRII; In-vitrogen) for GLUT3 or with a probe made from the highly homologous rat GLUT1 for the GLUT1 control (31). Blots were also probed with a beta-actin control probe.
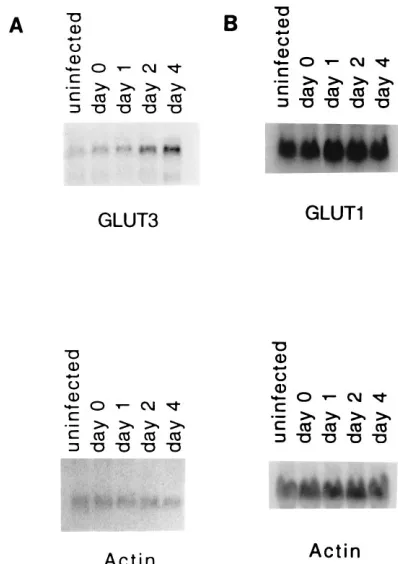
The results (Fig. 1A) show that the expression of GLUT3 increases steadily over the course of the infection, with the intensity of the GLUT3 band increasing about 4.5-fold. Since most inducible changes in glucose transport result from alter-ations in the expression of the GLUT1 transporter (for review, see references 2 and 22), Northern blots were also probed with a probe for GLUT1 (Fig. 1B). Here, the intensity of the GLUT1 band showed only a slight increase during infection (;10 to 20% in repeated experiments). Blots were also exam-ined with probes for GLUT2, GLUT4, and GLUT5, but no signal was detected (data not shown).
In order to determine whether an increase in GLUT3 pro-tein expression accompanied the increase in GLUT3 mRNA, infected (as described above) and mock-infected cells were fixed and stained each day with a mouse monoclonal antibody to GLUT3 and a patient serum broadly recognizing HIV an-tigens and subsequently with fluorescent tagged second anti-bodies. On each day, the cells were fixed in 4% paraformalde-hyde in phosphate-buffered saline (PBS) buffered to pH 7.2,
washed three times in PBS and once in PBS with 3% bovine serum albumin (BSA), and resuspended in the primary anti-bodies for 45 min at 48C. The antibodies used included mouse monoclonal antibodies against GLUT1 and GLUT3 (kindly provided by Novo-Nordisk); an HIV1 patient serum which recognizes Gag, Gag/Pol, Vpu, and Env proteins; and control nonimmune human and mouse sera as indicated below. The cells were subsequently stained with phycoerythrin-conjugated donkey anti-mouse (Jackson Immunoresearch) and fluorescein isothiocyanate-conjugated goat anti-human (Kirkegaard and Perry) second antibodies for 45 min at 4C. The stained cells were examined with a Becton Dickinson FACSort flow cytom-eter using CellQuest software. Cell populations were gated to exclude dead cells and syncytia. The proportion of cells stain-ing positive for each specific serum was determined by com-parison with control sera, and the level of expression was plotted as the geometric mean of log fluorescence intensity. On each day, HIV-expressing cells in fluorescence-activated cell sorter plots were identified by comparison with uninfected cells. The HIV1population was defined as cells with fluores-cein isothiocyanate fluorescence intensity greater than that of 99.5% of the cells (HIV2) in the uninfected culture. In prac-tice, the HIV-infected cells formed a discrete population with geometric mean fluorescence intensity of fluorescein isothio-cyanate staining which was approximately 10-fold greater than that detected for uninfected cells. The percent HIV-infected cells was determined by dividing the number of cells defined as HIV1by the total number of cells. The levels of expression of the antigens in the infected cells were compared with those observed in the control cells fixed and stained each day and processed in parallel with the infected cells.
The signal due to HIV increased over the course of infec-tion, with 70 to 80% of the cells becoming HIV1by day 4 of infection. Although the staining pattern of the uninfected con-trol cells varied somewhat from day to day, the signal due to GLUT3 (Fig. 2A; Table 1) increased approximately twofold specifically in the HIV-infected cells, compared with the unin-fected cells stained in parallel on each day. In control experi-ments to examine changes in GLUT1 expression (Fig. 2B, Table 1), the signal due to GLUT1 increased also, but only by about 40 to 50%.
The increase in GLUT3 expression was confirmed in control single-color flow cytometry experiments (Fig. 3). In these ex-periments uninfected and infected cells were stained only for GLUT3 or GLUT1. The infected cells showed an increased signal due to GLUT3 (Fig. 3, solid lines) compared with the uninfected culture (Fig. 3, dashed lines).
Since glucose transporter expression increased at both the RNA and protein levels, we performed 2-deoxyglucose trans-port assays on cells during a time course infection to determine whether a functional change in glucose transport capacity ac-companied the observed increase in transporter expression. Infected and mock-infected cells were exposed to radiolabeled 2-deoxyglucose, and the uptake rates were determined during the course of the infection (Fig. 4). At the indicated times after infection, mock-infected and infected cells were washed twice in PBS. Six samples were run for each time point. The final cell pellets were resuspended in Krebs’ Ringer’s solution (pH 7.4) containing 30 mM HEPES (N-2-hydroxyethylpiperazine-N9 -2-ethanesulfonic acid) and 2.0% BSA (Intergen, Purchase, N.Y.). The assay was started by adding a reaction mix contain-ing 0.2 mM 2-deoxy-D-glucose with 20 mCi of tritiated
2-de-oxyglucose (New England Nuclear) per ml, and the cells were incubated at room temperature for the times indicated below. The reaction was stopped by adding 1 ml of cold PBS with 1024
M cytochalasin B. Cell suspensions were collected on
nitrocel-FIG. 1. Northern analysis of RNA made from an infection conducted over time and probed for GLUT3 (A) and GLUT1 (B). RNA was made from unin-fected (mock-inunin-fected) cells and from inunin-fected cells at the indicated times.
on November 9, 2019 by guest
http://jvi.asm.org/
[image:2.612.75.274.69.351.2]lulose filters in a Millipore filter apparatus and washed. Ra-dioactivity was determined by scintillation counting in Filter Count scintillation fluid (Packard). Mean values 6 standard deviations were plotted for each assay time point. Uptake rates were determined by linear regression.
On days 1 and 2, the rates of 2-deoxyglucose uptake in the uninfected and infected cells were virtually the same, as indi-cated by the diverging slopes of the lines in Fig. 3. However, by day 3 glucose uptake was increased 1.5-fold over that in the controls and by day 4 the rate was 2.0-fold higher in the in-fected cells. This, however, may represent an underestimate of the true differences in the transport rate, since not all of the cells present in the infected culture were actually infected. Further, some of the cells in the infected culture showed sub-stantial cytopathic effect by day 4 and may have been leaky, leading to both a loss of labeled 2-deoxyglucose and an over-estimation of the viable cell number.
Our results show that infection of H9 cells by HIV-1 leads to
an increase in glucose transporter expression, largely involving the GLUT3 transporter, with an accompanying increase in glucose transport. Infection and transformation by other vi-ruses, including retrovivi-ruses, have been postulated to lead to increased metabolic demands upon the host cell and thus to a need for increased glucose transport. HIV-infected cells may also have increased metabolic demands compared with unfected cells. The induction of GLUT3 expression and an in-crease in glucose transport may represent an adaptation to supply these demands. Additionally, increased intracellular glucose may tend to inhibit apoptotic cell death (13, 19), lead-ing to an increase in virus production. Increased intracellular glucose might also help to compensate for metabolic derange-ments associated with HIV infection, such as mitochondrial dysfunction (24).
The changes in glucose transport activity observed in asso-ciation with HIV infection are clearly of physiological signifi-cance, since they fall within the range seen when a variety of
FIG. 2. Flow cytometric analysis of glucose transporter expression during HIV infection. Cells were either infected or mock-infected with HIV and then fixed and stained 1 h after infection (Day 0) and each day for 4 days. The cells were stained each day with an HIV1patient antiserum that recognizes Gag/Pol, Vpu, and Env antigens and with monoclonal antibodies against GLUT3 (A) and GLUT1 (B).
on November 9, 2019 by guest
http://jvi.asm.org/
cells are subjected to such diverse chronic stimuli as glucose deprivation, depolarization, transformation, and infection by other viruses (reviewed in references 11, 22, and 26). In all cases, these chronic changes in glucose transport activity result in two- to fourfold increases in transporter expression and transport activity. Such changes are distinct from the acute 6-to 10-fold changes in transport activity which are seen in mus-cle and adipose tissue in response to insulin or contraction and which result from the recruitment of preformed intracellular GLUT4 transporters to the plasma membrane.
The increase in GLUT3 expression seen in the HIV-infected H9 cells is unlikely to have resulted from nonspecific stimula-tion of the cells because, in contrast to the findings obtained with the HIV-infected H9 cells, stimulation of peripheral blood lymphocytes with phytohemagglutinin leads to an in-crease in glucose transport due to inin-creased expression of GLUT1 and not GLUT3. In the stimulated lymphocytes the level of GLUT3 expression either remains constant or declines (4). Glucose deprivation leads to an increase in GLUT1 ex-pression but not GLUT3 exex-pression (22). However, whether the increase in GLUT3 expression in HIV-infected cells results from the action of a specific viral gene product on the cell or
through some preexisting cellular homeostatic mechanisms and whether the increase in GLUT3 RNA levels occurs be-cause of increased synthesis or decreased RNA turnover re-main to be determined.
For HIV, it is particularly interesting that the largest in-crease in expression occurs with GLUT3. If inin-creased glucose transport does confer an advantage upon an infected cell, an increase in GLUT3 expression could be especially advanta-geous, as GLUT3 has a high affinity for glucose and the highest maximal rate of glucose transport of any of the described transporters (25). Such an advantage in glucose uptake com-pared with uninfected cells might be particularly important in environments in which many cells are packed tightly together and glucose concentration can be expected to be relatively low, for example, in lymphoid tissues in which large numbers of infected and uninfected cells lie in close proximity (8, 29). This set of circumstances may operate in the central nervous system. There, GLUT3 is expressed in neuronal cells while GLUT1 is expressed in the glial elements, potentially leading to prefer-ential uptake of glucose by the neurons under conditions of limiting glucose (26).
Several other cellular genes are known to exhibit altered expression during HIV infection or to interact with HIV pro-teins (18). While the interactions of some of these cellular gene products with HIV are controversial, several have obvious pathogenically favorable consequences for the virus. Altered expression of genes, such asGLUT3, whose expression affects the intracellular metabolic environment may therefore repre-sent an adaptation that enables the virus to change the intra-cellular environment so as to favor viral replication. Genes which exhibit altered expression during viral infection might provide alternate targets for antiviral therapy.
[image:4.612.317.558.68.302.2]The mouse monoclonal antibodies were the kind gifts of P. R. Hansen and A. Holm, Royal Veterinary and Agricultural University, Copenhagen, Denmark; P. N. Jorgensen, Novo-Nordisk; and T. Ploug,
FIG. 3. Control single-color flow cytometric study of GLUT3 and GLUT1. Cells collected 3 days after exposure to virus (solid lines) or corresponding mock-infected cells (dashed lines) were fixed and stained only with a monoclonal antibody against either GLUT3 (A) or GLUT1 (B). An increase in GLUT3 expression was evident when the cells were stained only with antibody against the transporter. FL2-H, fluorescence intensity due to phycoerythrin-conjugated sec-ondary antibody recognizing mouse monoclonal antibodies to either GLUT3 or GLUT1.
[image:4.612.53.300.92.174.2]FIG. 4. Radiolabeled 2-deoxyglucose transport assays during a time course infection. Infected and mock-infected cells were used in a radiolabeled 2-deoxy-glucose transport assay during a time course infection. The tritium counts taken up into the cells are plotted as a function of time during the assay. The slopes of the uptake curves represent transport rates.
TABLE 1. Glucose transporter expression during HIV infection of H9 cellsa
Day
Result for cells from the following culture with antibody to:
GLUT3 GLUT1
Uninfected Infected Uninfected Infected HIV2 HIV1 HIV2 HIV1
3 1.47 1.81 2.84b 9.98b 9.58 13.67b
4 1.44 –c 4.30b 4.34b 5.71 6.33b
aData are from Fig. 2. Cells were obtained each day from the uninfected and
infected cultures, fixed in 4% paraformaldehyde, washed in PBS-BSA, and stained on each day with monoclonal antibodies to GLUT3 and GLUT1. Values represent the geometric mean log fluorescence intensity. Only values from days 3 and 4 are included because too few HIV1cells were present in the GLUT1 and GLUT3 experiments on the other days for statistical analysis.
bSignificant (P,0.001) increase in mean log fluorescence intensity compared with control cells (HIV2cells in the infected cell culture or uninfected cells) fixed and stained on the same day by the Komogorov-Smirnov statistical com-parison of histograms using the CellQuest software.
cToo few cells were present for statistical analysis.
on November 9, 2019 by guest
http://jvi.asm.org/
[image:4.612.62.301.541.658.2]Panum Institute, University of Copenhagen. We thank P. Pizzo for encouragement and support.
REFERENCES
1.Ausubel, F. M., R. Brent, R. E. Kingston, D. D. Moore, J. G. Seidman, J. A. Smith, and K. Struhl.1994. Current protocols in molecular biology. Green Publishing and Wiley Interscience, New York.
2.Bell, G. I., C. F. Burant, J. Takeda, and G. W. Gould.1993. Structure and function of mammalian facilitative sugar transporters. J. Biol. Chem.268: 19161–19164.
3.Birnbaum, M. J., H. C. Haspel, and O. M. Rosen.1987. Transformation of rat fibroblasts by FSV rapidly increases glucose transporter gene transcrip-tion. Science235:1495–1498.
4.Chakrabarti, R., C. Y. Jung, T. P. Lee, H. Liu, and B. K. Mookerjee.1994. Changes in glucose transport and transporter isoforms during the activation of peripheral blood lymphocytes by phytohemagglutinin. J. Immunol.152: 2660–2668.
5.Chomczynski, P., and N. Sacchi.1987. Single-step method of RNA isolation by acid guanidinium thiocyanate-phenol-chloroform extraction. Anal. Bio-chem.162:156–159.
6.Dimitrov, D. S., R. L. Willey, H. Sato, L.-J. Chang, R. Blumenthal, and M. A. Martin.1993. Quantitation of human immunodeficiency virus type 1 infec-tion kinetics. J. Virol.67:2182–2190.
7.Eckhart, W., and M. Weber.1974. Uptake of 2-deoxyglucose by BALB/3T3 cells: changes after polyoma infection. Virology61:223–228.
8.Embretson, J., M. Zupancic, J. L. Ribas, A. Burke, P. Racz, K. Tenner-Racz, and A. T. Haase.1993. Massive covert infection of helper T lymphocytes and macrophages by HIV during the incubation period of AIDS. Nature (Lon-don)362:359–362.
9.Flier, J. S., M. M. Mueckler, P. Usher, and H. F. Lodish.1987. Elevated levels of glucose transport and transporter messenger RNA are induced by rasorsrconcogenes. Science235:1492–1495.
10. Garry, R. F., D. A. Bostick, and E. T. Ulug.1986. Sindbis virus infection increases hexose transport in quiescent cells. Virology155:378–391. 11. Gould, G. W., and G. D. Holman.1993. The glucose transporter family:
structure, function, and tissue-specific expression. Biochem. J.295:329–341. 12. Haber, R. S., S. P. Weinstein, E. O’Boyle, and S. Morgello.1993. Tissue distribution of the human GLUT3 glucose transporter. Endocrinology132: 2538–2543.
13. Halicka, H. D., B. Ardelt, X. Li, M. M. Melamed, and Z. Darzynkiewicz. 1995. 2-Deoxy-D-glucose enhances sensitivity of human histiocytic lymphoma
U937 cells to apoptosis induced by tumor necrosis factor. Cancer Res. 55:444–449.
14. Hatanaka, M., and H. Hanafusa.1970. Analysis of a functional change in membrane in the process of cell transformation by Rous sarcoma virus; alteration in the characteristics of sugar transport. Virology41:647–652. 15. Hatanaka, M., R. J. Huebner, and R. V. Gilden.1969. Alterations in
char-acteristics of sugar uptake by mouse cells transformed by murine sarcoma viruses. J. Natl. Cancer Inst.43:1091–1096.
16. Hiraki, Y., O. M. Rosen, and M. J. Birnbaum.1988. Growth factors rapidly induce expression of the glucose transporter gene. J. Biol. Chem.263:13655– 13662.
17. Isselbacher, K. J.1972. Increased uptake of amino acids and 2-deoxy-D
-glucose by virus-transformed cells in culture. Proc. Natl. Acad. Sci. USA 69:585–589.
18. Jeang, K.-T.1994. HIV and cellular factors, p. IV-1-11.InG. Myers et al.
(ed.), Human retroviruses and AIDS 1995. Los Alamos National Laboratory, Los Alamos, N.M.
19. Kan, O., S. A. Baldwin, and A. D. Whetton.1994. Apoptosis is regulated by the rate of glucose transport in an interleukin 3 dependent cell line. J. Exp. Med.180:917–923.
20. Kawai, S., and H. Hanafusa.1971. The effects of reciprocal changes in temperature on the transformed state of cells infected with a Rous sarcoma virus mutant. Virology46:470–479.
21. Kayano, T., H. Fukumoto, R. L. Eddy, Y. S. Fan, M. G. Byers, T. B. Shows, and G. I. Bell.1988. Evidence for a family of human glucose transporter-like proteins. Sequence and gene localization of a protein expressed in fetal skeletal muscle and other tissues. J. Biol. Chem.263:15245–15248. 22. Klip, A., T. Tsakiridis, A. Marette, and P. Ortiz.1994. Regulation of
expres-sion of glucose transporters by glucose: a review of studies in vivo and in cell cultures. FASEB J.8:43–53.
23. Liang, P., and A. B. Pardee.1992. Differential display of eukaryotic messen-ger RNA by means of the polymerase chain reaction. Science257:967–971. 24. Macho, A., M. Castedo, P. Marchetti, J. J. Aguilar, D. Decaudin, N. Zamzami, P. M. Girard, J. Uriel, and G. Kroemer.1995. Mitochondrial dysfunctions in circulating T lymphocytes from human immunodeficiency virus-1 carriers. Blood86:2481–2487.
25. Maher, F., T. Davis-Hill, and I. Simpson.1996. Substrate specificity and kinetic parameters of GLUT3 in rat cerebellar granule cells. Biochem. J. 315:827–831.
26. Maher, F., S. J. Vannucci, and I. A. Simpson.1994. Glucose transporter proteins in brain. FASEB J.8:1003–1011.
27. Martin, G. S., S. Venuta, M. Weber, and H. Rubin.1971. Temperature-dependent alterations in sugar transport in cells infected by a temperature-sensitive mutant of Rous sarcoma virus. Proc. Natl. Acad. Sci. USA68:2739– 2741.
28. Murakami, T., T. Nishiyama, T. Shirotani, Y. Shinohara, M. Kan, K. Ishii, F. Kanai, S. Nakazuru, and Y. Ebina.1992. Identification of two enhancer elements in the gene encoding the type 1 glucose transporter from the mouse which are responsive to serum, growth factor, and oncogenes. J. Biol. Chem. 267:9300–9306.
29. Pantaleo, G., C. Graziosi, J. F. Demarest, L. Butini, M. Montroni, C. H. Fox, J. M. Orenstein, D. P. Kotler, and A. S. Fauci.1993. HIV infection is active and progressive in lymphoid tissue during the clinically latent stage of dis-ease. Nature (London)362:355–358.
30. Weber, M. J.1973. Hexose transport in normal and in Rous sarcoma virus-transformed cells. J. Biol. Chem.218:2978–2983.
31. Werner, H., M. Adamo, W. L. Lowe, C. T. J. Roberts, and D. LeRoith.1989. Developmental regulation of rat brain/hep G2 glucose transporter gene expression. Mol. Endocrinol.3:273–279.
32. White, M. K., T. B. Rall, and M. J. Weber.1991. Differential regulation of glucose transporter isoforms by thesrconcogene in chicken embryo fibro-blasts. Mol. Cell. Biol.11:4448–4454.
33. White, M. K., and M. J. Weber.1988. Transformation by thesrconcogene alters glucose transport into rat and chicken cells by different mechanisms. Mol. Cell. Biol.8:138–144.
34. White, M. K., and M. J. Weber.1990. Thesrconcogene can regulate a human glucose transporter expressed in chicken embryo fibroblasts. Mol. Cell. Biol.10:1301–1306.
35. Young, A. T., J. Dahl, S. F. Hausdorff, P. H. Bauer, M. J. Birnbaum, and T. L. Benjamin.1995. Phosphatidylinositol 3-kinase binding to polyoma virus middle tumor antigen mediates elevation of glucose transport by increasing translocation of the GLUT1 transporter. Proc. Natl. Acad. Sci. USA92: 11613–11617.