ASS
ACUTE
CH
SESSMEN
E
ST
‐
ELEV
DISSERT
(B
ENNAI,
NT
OF
LO
VATION
TATION
S
Branch
II
‐
August
, TAMIL
ONGITUD
MYOCA
SUBMITT
Cardiolo
t
‐
2011
L NADU
DINAL
ST
ARDIAL
I
ED
FOR
D
ogy)
.
TRAIN
IN
NFARCT
DM
N
This is to certify that this dissertation titled “ASSESSMENT OF LONGITUDINAL STRAIN IN ACUTE ST‐ELEVATION MYOCARDIAL INFARCTION ” submitted by Dr.P.Ashok Kumar, to the faculty of
Cardiology, The Tamilnadu Dr.M.G.R.Medical University, Chennai in partial fulfillment of the
requirement for the award of DM degree Branch [Cardiology] is a bonafide research work
carried out by him under our direct supervision and guidance.
DECLARATION
I, Dr.P.Ashok Kumar, solemnly declare that the dissertation titled “ASSESSMENT OF
LONGITUDINAL STRAIN IN ACUTE ST‐ELEVATION MYOCARDIAL INFARCTION ” has been
prepared by me. This is submitted to The Tamilnadu Dr.M.G.R.Medical University, Chennai, in
partial fulfillment of the regulations for the award of DM degree Branch [Cardiology].
INTRODUCTION
Coronary Artery Disease is the leading cause of death worldwide. Every year about 100,000
people in the United States suffer acute Myocardial Infarction (AMI)1. The AMI incidence
though shows declining trend in the west it is on the rise in the developing world. Effective
management of this increasing epidemic imposes a technical challenge as well as a socio‐
economic burden to the third world countries. In addition to the routine clinical and
Electrocardiographic (ECG) evaluation, Echocardiography is an integral part of AMI
management. Assessment of overall Left ventricular (LV) function and the regional wall motion
of individual myocardial segments is the essence of Echocardiography in the patients with AMI.
Traditionally the regional wall motion is assessed subjectively by 2D imaging and objectively by
calculation of wall motion score index. Global LV function is usually assessed by Teichzolts and
Simpson`s methodologies. These modalities have their own limitations in patients with Acute
myocardial infarction. Tissue Doppler imaging offsets some of the disadvantages of 2D
echocardiography but by itself has several disadvantages in the assessment of regional and
overall LV function. The introduction of Strain imaging has added substance to the imaging of
patients with AMI. Strain and strain rate imaging has overcome the disadvantages of 2D as well
as Tissue Doppler imaging and has stood the test of time since its introduction a decade ago.
The modality of Strain imaging is fast advancing with the initial reports of Doppler based strain
imaging now giving way to strain by 2D Speckle tracking.
This study utilizes Longitudinal strain derived by 2D speckle tracking for assessment of
regional and global LV function in patients with AMI and compares the same with traditional
REVIEW OF LITERATURE
The usual indices of global left ventricular (LV) function, such as ejection fraction and volumes,
are load‐dependent, and standard volumetric approaches to their measurement may be
influenced by image quality, technical considerations such as off‐axis imaging, and
measurement error. The assessment of regional function is more difficult, remains highly
subjective, and requires significant training.2
Regional Wall Motion Analysis:
The immediate manifestation of myocardial ischemia is a decrease in or cessation of myocardial
contractility (systolic thickening), even before the occurrence of ST‐segment changes or the
development of symptoms. Ischemic myocardium may continue to demonstrate some degree
of passive forward motion because of the pulling action of adjacent nonischemic muscle, but
the contractility (systolic thickening) of the ischemic myocardial segments is decreased
(hypokinesis) or absent (akinesis). Normally, left ventricular (LV) free wall thickness increases
more than 40% during systole. In normal subjects, the percentage of thickening of the
ventricular septum is somewhat less than that of the free wall of the LV. Hypokinesis is defined
as systolic wall thickening less than 30%, and akinesis is defined as wall thickening less than
10%. Dyskinesis is defined as a myocardial segment moving outward during systole, usually in
association with systolic wall thinning.
With multiple tomographic imaging planes, two‐dimensional (2D) echocardiography allows
visualization of all LV wall segments. For purposes of regional wall motion analysis, the LV is
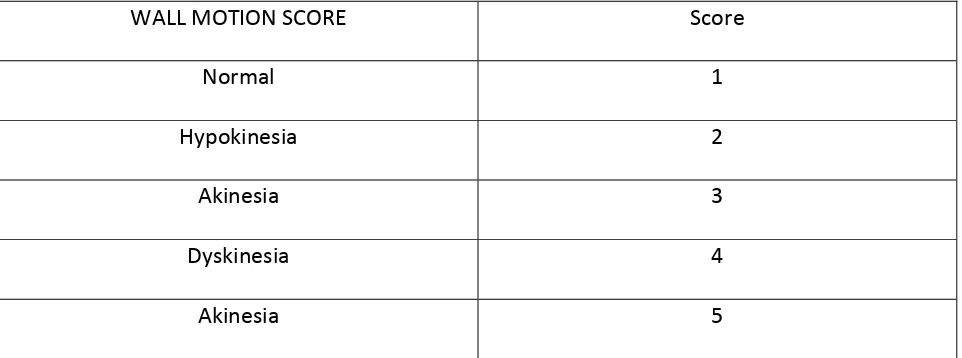
divided into several segments. The American Society of Echocardiography has recommended a
assigned a score on the basis of its contractility as assessed visually: normal = 1, hypokinesis = 2,
akinesis = 3, dyskinesis = 4, and aneurysm = 5.(Table 1) On the basis of this wall motion analysis
scheme, a wall motion score index (WMSI) is calculated to semiquantitate the extent of
regional wall motion abnormalities:
WMSI= sum of wall motion scores/ Number of segments visualized
A normally contracting LV has a WMSI of 1 (each of the 16 segments receives a wall motion
score of 1; hence, the total score is 16 and WMSI is 16/16 = 1). The larger the infarct the higher
the WMSI because wall motion abnormalities become more severe.
WALL MOTION SCORE Score
Normal 1
Hypokinesia 2
Akinesia 3
Dyskinesia 4
Akinesia 5
Table 1: Table showing standard wall motion scores. Optional scores include 0 for
hyperdynamic myocardium, 6 for Akynesia with scar, 7 Dyskinesia with scar.(Not included in this study)
What does the WMSI indicate? Because the echocardiographic analysis of wall motion
abnormality is subjective and the reduction of systolic myocardial thickening is not proportional
to the incremental amount of infarcted or ischemic myocardial tissue 4, the correlation of the
WMSI with the actual size of the myocardial infarct or the perfusion defect may not be good in
the case of acute myocardial infarction. When a 2D echocardiographic examination was
[image:6.612.67.548.306.485.2]infarction with ST‐segment elevation on the ECG, the overall correlation between the WMSI
and the perfusion defect was good 5. Patients with WMSI greater than 1.7 had a perfusion
defect larger than 20%. The correlation was better in patients with an anterior wall myocardial
infarction than in those with an inferior or lateral wall myocardial infarction with a smaller
infarct size. However, it is possible to have relatively normal myocardial contractility when
there is a myocardial perfusion defect. Also, the reverse is true, depending on the clinical
situation. Without a previous ischemic insult, a small subendocardial perfusion can be present
when no visible contractility abnormality is evident. However, the myocardium may remain
akinetic for a period of time after coronary reperfusion. Therefore, knowledge of both
myocardial contractility and perfusion is vital for the management of the subset of patients
with coronary artery disease. Another interesting subset of patients with acute myocardial
infarction is the group with normal coronary arteries, for example, patients with apical
ballooning syndrome, subarachnoid hemorrhage, or pheochromocytoma or those who have
had electroconvulsive therapy. In these situations, marked wall motion abnormalities are
present acutely but perfusion is normal. These wall motion abnormalities usually resolve in 5 to
10 days.
Technical Caveats
A reliable regional wall motion analysis is among the most challenging tasks in
echocardiography. All available windows and tomographic planes should be used to visualize all
the LV segments. Apical short‐ and long‐axis views are especially useful in evaluating the apical
third of the LV. Continuous scanning from the apical four‐chamber to the apical long‐axis to the
chronic obstructive pulmonary disease or who are obese, a lower frequency (2.0‐2.5 MHz)
transducer should be used to optimize the definition of the endocardium, and the subcostal
window may provide adequate visualization of the LV segments. A new imaging method that
uses the principle of harmonic resonance (native harmonic imaging) can improve visualization
of the endocardium. In patients with a good apical window, the use of higher frequency
transducers, with adjustment of the focal zone to the near region, may enhance the definition
of the apical endocardium, help delineate apical wall motion abnormalities, and differentiate
thrombus from apical trabeculation.6
The assessment of regional wall motion on echocardiography is limited when visualization of
the LV endocardium is not adequate. Several new modalities may enhance the ability to analyze
regional wall motion.
Global Left Ventricular Function assessment by Ejection Fraction
The most popular expression of global LV function is the LVEF. LVEF is a simple measure of how
much of the end‐diastolic volume is ejected or pumped out of the LV with each contraction.
Although readily influenced by loading conditions, this simple measure has been found to be a
strong predictor of clinical outcome in almost all major cardiac conditions and is used to select
the optimal management strategy, including the implantation of an intracardiac defibrillator or
biventricular pacing 7,8. Most frequently, LVEF is determined visually by eyeballing 2D
echocardiographic images of the LV. This visual assessment is reasonably reliable when
performed by an experienced echocardiographer but has considerable interobserver variation7.
volumetric measurements. Quantitatively, LVEF can be calculated from M‐mode, 2D, and 3D
echocardiograms.
M‐mode recording of 2D measurements of LV dimensions from the mid ventricular papillary
muscle level is used to calculate the LVEF as follows,9
LVEF= (%D2) + (1‐ D2)( %L)
D2 = LVDE2‐LVES2/LVED2 x100
where %ΔD2 is the percentage fractional shortening of the square of the minor axis, and %ΔL is
the percentage fractional shortening of the long axis, mainly related to apical contraction: 15%
for normal, 5% for hypokinetic apex, 0% for akinetic apex, ‐5% for dyskinetic apex, and ‐10% for
apical aneurysm.
There are two components in the equation. The first component is actually a percentage
change in the LV area or fractional shortening of the square of the LV short axis. If it is assumed
that the apical long‐axis dimension remains the same during systolic contraction, the
percentage area change or fractional area change is equal to the percentage volume change.
Because the apical long axis shortens 10% to 15% with systole, an apical correction factor, the
second component, is added. This factor varies with the contractility of the apex.
LVEF is perferrably calculated from 2D or 3D volume measurements. Although there are several
different methods for measuring LV volume and LVEF from 2D echocardiographic images of the
LV, the disk summation or biplane Simpson method is used most often. The LV endocardial
border is traced from one apical or two orthogonal apical views to create multiple (usually 20)
cylinders whose volume is summated to provide LV volume. It is most critical to trace the actual
included as a part of the LV cavity, not as part of the LV wall. If the definition of the endocardial
border is not clear, the intravenous administration of a perfluorocarbon contrast agent will help
delineate this border. LV volume is usually larger when measured with the contrast agent.
Another crucial technical point for reliably measuring LV volume is avoiding foreshortening of
apical views. The apical long axis is divided by the number of cylinders created within the LV,
and the resulting distance (long‐axis dimension Ã∙ number of cylinders) becomes the height of
each cylinder. Therefore, the long‐axis dimensions from two apical views should be similar. In
subjects with uniform contractility, LV volume measured with a single plane is very close to the
LV volume obtained with the biplane Simpson method. The biplane Simpson method is
preferred for measuring the L volume of an LV with regional wall motion abnormalities. In any
given view, a circular disk is assumed at each level along the ventricle. Obviously, if a regional
wall motion abnormality is not visualized in the plane of examination, this technique will
overestimate the ejection fraction. For this reason, when dealing with patients with coronary
disease in whom regional abnormalities are anticipated, biplane methodology is necessary if
precise measurements are required. Because of the regional nature of coronary disease, other
methods, such as area length calculations, have had less acceptance in evaluating patients with
coronary disease.10
The echocardiographic measurement of myocardial strain (€) offers a series of regional and
global parameters that may be useful in the assessment of systolic and diastolic function. Strain
is a measure of tissue deformation. As the ventricle contracts, muscle shortens in the
longitudinal and circumferential dimensions (a negative strain) and thickens or lengthens in the
constrained by a number of complexities when the parameter is measured by
echocardiography. First, to quantify the lengthening or shortening process an initial
measurement of length is required (Lagrangian strain), and the same findings may not
necessarily be obtained by the measurement of instantaneous strain during contraction
(Eulerian or natural strain). Second, tissue deformation occurs in three planes, in addition to
which shearing motion involves a number of other tensors, so our current measurement
approaches are a vast simplification of the true motion of the heart. Third, the assumption that
tissue is incompressible is not completely true, and for example ignores the variation in
myocardial blood volume between diastole and systole. Fourth, the complexities of fiber
direction cause a longitudinal shortening of 20% to 30% to generate radial shortening of 50% to
70% 11
Myocardial strain may be measured using a variety of echocardiographic techniques. Although
M‐mode techniques provide both accurate temporal and accurate spatial resolution, and may
therefore be used to measure strain in a single dimension, the current era of myocardial strain
measurement began with the measurement of SR from comparison of adjacent tissue velocities
by Heimdal et al. 12 Subsequently, strain has been measured using speckle tracking techniques
13
Each of these methodologies presents its own clinical challenges.
Tissue Doppler‐based strain.
TECHNICAL ASPECTS. The velocity of movement of myocardium can be recorded by tissue
Doppler techniques and displayed as a parametric color image in which each pixel represents
the velocity relative to the transducer. These data may also be expressed graphically as the
that a descending gradation of velocity exists from the LV base to apex, reflecting the
contraction of the base toward a relatively fixed apex. There is a gradation of peak velocities at
different locations along the LV wall. Although these velocity recordings provide information
about the motion of the wall, the ability of contraction in adjacent segments to influence the
velocity in any given segment limits the site‐specificity of velocity data. Rather than examine
the motion of a segment relative to the transducer, which is susceptible to tethering to
adjacent tissue, myocardial motion may be measured relative to the adjacent myocardium. The
instantaneous gradient of velocity along a sample length may be quantified by performing a
regression calculation between the velocity data from adjacent sites along the scan line, and
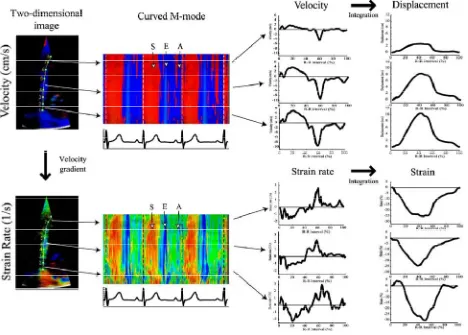
these instantaneous data may then be combined to generate an SR curve14. Integration of this
curve provides instantaneous data on deformation—shortening or lengthening—that represent
strain (Fig. 1). These data therefore reflect the movement of one tissue site relative to another
within the sample volume, in contrast to tissue velocity data, which merely reflect movement of
one site relative to the transducer. A number of experimental and clinical articles have attested
to the benefits of site specificity in avoiding motion caused by tethering to adjacent segments,
which is especially important when dealing with coronary artery disease. 15,16 Like tissue
velocity, strain parameters are most commonly used to assess myocardial motion in a base‐to‐
apex direction, which is sensitive to mild subendocardial damage. In contrast, the measurement
for radial strain from tissue velocity data is unsuitable for clinical use. It is difficult to
accommodate the optimal inter‐site distance required for SR measurements (12 mm) in a
ventricle of normal thickness, and the use of a shorter offset distance is associated with greater
line means that only anteroseptal and posterior segments can be analyzed with this technique,
and because of the combination of right ventricular (RV) and LV myocardial structure in the
septum, effectively only radial strain of the posterior wall measurements are meaningful.
Fig 1: Derivation of strain from tissue Doppler data. Regression calculation between adjacent tissue velocity data points along this length generates the strain rate curve, which is then integrated to calculate strain.
LIMITATIONS OF DERIVATION OF SR FROM TISSUE VELOCITY.
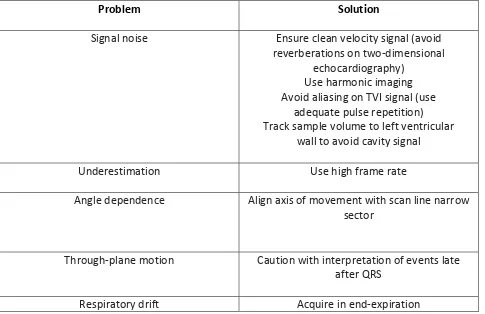
The velocity‐regression technique has a number of potential pitfalls (Table 2). First, the
comparison of adjacent velocities is exquisitely sensitive to signal noise, and the quality of SR
curves may vary depending on the care used in obtaining the underlying velocity data.
Optimizing the velocity signal should include avoidance of reverberation artifact and ensuring
adequate frame rate (100 frames/s). Inadequate pulse‐repetition frequency leads to aliasing.
[image:13.612.81.511.189.432.2]spatial averaging are important in optimizing the SR signal, although this comes at the cost of
reducing spatial resolution. The second limitation relates to the limits on spatial resolution that
are imposed by imaging at high temporal resolution. If the number of Doppler interrogating
beams is limited in an effort to maximize temporal resolution, spatial resolution may be
compromised. This may contaminate myocardial velocity signals with adjacent LV blood pool
velocities, which are an important source of noise. In turn, this will compromise the SR signal.
Tracking the sample throughout the cardiac cycle is also important to ensure that the sample
remains within the myocardium. Use of a narrow imaging sector—although inconvenient for
clinical imaging— enables a limited number of Doppler beams to be focused in a small area,
[image:14.612.67.552.379.693.2]optimizing spatial resolution.
Table2: Problems and Solutions for Tissue‐Velocity Based Strain Rate Imaging
Problem Solution
If a narrow sector is undesirable, reduction of frame rate will allow the use of more Doppler
beams across the imaging sector, effectively sacrificing temporal for spatial resolution. These
limitations on lateral resolution significantly limit the ability of the technique to assess
longitudinal subendocardial and subepicardial SR during standard imaging.
Third, like all Doppler techniques, tissue velocity‐based strain is sensitive to alignment. The
application of this technique to areas where the axis of contraction changes along the scan line
(e.g., the apex) means that different vectors may be involved at each site (Fig. 2), with
consequent error in strain measurement 17
Fig 2: Impact of angulations on strain rate imaging. Interrogation parallel with the wall (mid‐ septum, shown in blue) identifies long‐axis shortening, and at right angles to the wall (apex, shown in red) identifies short‐axis thickening. However, an intermediate angle (apical septum, shown in yellow) causes underestimation—a mixture of vectors at 45% produces a net absence
of recordable strain. Scan planes are shown as continuous lines, longitudinal and radial
contraction vectors as broken lines.
[image:15.612.75.543.306.573.2]Fourth, the derivation of data along the scan line means that the velocity regression technique
is unidirectional. Even when tracking is used to try to maintain the sample volume within a
segment of myocardium, it needs to be remembered that the myocardium undergoes a
wringing, torsional motion so that the sample will inevitably move out of the scanning field in
the course of the cardiac cycle. This motion has little effect on systolic measurements, because
peak SR occurs early in systole, but it may become important in the measurement of diastolic
phenomena. These considerations of through‐plane motion may be particularly important
when the myocardial function is non‐uniform, as for example, with an ischemic
cardiomyopathy. Finally, angle changes during the cardiac cycle and with respiratory movement
may contribute to drifting of the strain curve. These technical challenges of tissue velocity
based SR measurements can be avoided by careful acquisition or by the use of speckle derived
measurements.
VALIDATION. Despite these limitations, it is important to acknowledge that this technique has
been extensively validated, initially with sonomicrometry 18 Subsequent studies have confirmed
correlation with magnetic resonance imaging 19
Echocardiography‐based measurement of strain.
RATIONALE A Doppler‐independent technique for strain measurement would have attractions
with respect to signal noise, angle dependency, and the ability to monitor strain in two
dimensions rather than one dimension. Various echocardiographic techniques have been used,
including comparison of adjacent radiofrequency signals, and more recently, block‐matching
and speckle tracking techniques 20,21 These speckles are ultrasound reflectors within tissue, are
may be calculated by comparison of these speckles from frame to frame, although attention to
technical detail is important, because comparisons at high frame rates are associated with high
levels of noise, and comparisons at low frame rates risk loss of correlation because of excessive
displacement of the speckles.
Fig 3: Two‐dimensional (2D) strain is based on comparison of the image texture (i.e., pattern of
individual speckle elements) from frame to frame. The distortion of this pattern permits
assessment of strain in the axis of movement rather than the axis of the ultrasound beam.
COMPARISON WITH TISSUE VELOCITY METHODOLOGY. Because the assessment incorporates
baseline length, twodimensional (2D) strain (in contrast to the velocity regression approach) is
able to measure Lagrangian strain. The approach also has the added attraction of offering a
feasible approach to radial measurements, which may be a more accurate measure of wall
thickening than M‐mode echocardiography, in which a proportion of apparent thickening is
thought to reflect joining of the trabeculae. Finally, the technique offers a completely new
approach to the assessment of torsional motion, derived from circumferential strain at
different levels in the heart. However, differences in frame rate and smoothing lead to the
[image:17.612.74.539.188.352.2]measurement of timing parameters.(Table 3) Nonetheless, magnitude parameters seem to be
analogous with the 2D strain and velocity regression approaches 20
Table 3: Parameters Obtained From Strain Rate Imaging
Type of Parameter Specific Measurement Comment
Timing Time to onset of systole
and time to relaxation
Problems with reproducibility in
clinical settings, may be less
suited to 2D strain due
to lower temporal resolution.
Magnitude
(longitudinal or radial)
Peak systolic strain rate
Peak diastolic strain rate
Peak systolic strain
Susceptible to angulation issues
with TVI‐based strain, probably
more robust with 2D strain
but frame rate may be a
limitation
Through‐plane motion may limit
site specificity.
Corresponds with regional
ejection fraction and may be less
suited to stress
echocardiography
Magnitude + timing End‐systolic strain
Post‐systolic thickening
Dependent on accurate defining
of end‐systole, lacks information
about rate of contraction.
Not a specific marker of
ischemia.
COMPARISON WITH TISSUE VELOCITY METHODOLOGY. Because the assessment incorporates
baseline length, twodimensional (2D) strain (in contrast to the velocity regression approach) is
able to measure Lagrangian strain. The approach also has the added attraction of offering a
feasible approach to radial measurements, which may be a more accurate measure of wall
thickening than M‐mode echocardiography, in which a proportion of apparent thickening is
thought to reflect joining of the trabeculae. Finally, the technique offers a completely new
[image:18.612.64.546.159.487.2]different levels in the heart 22 However, differences in frame rate and smoothing lead to the
availability of less detail in the SR and strain curves, with potential difficulties in the
measurement of timing parameters. Nonetheless, magnitude parameters seem to be analogous
with the 2D strain and velocity regression approaches, ischemic myocardium, but although
delayed contraction is a pathophysiological hallmark of ischemia, and despite some favorable
clinical results23, the clinical application of timing parameters is limited by measurement
variations. It seems more feasible to obtain these results using tissue velocity signals, which,
although not site‐specific, are less prone to artifact.
MAGNITUDE PARAMETERS: Normal ranges of SR and strain have been described 24 Normal
resting values for longitudinal SR vary between 1.0/s and 1.4/s, with the standard deviation in
most locations ranging from 0.5/s to 0.6/s. Normal longitudinal systolic strain in most segments
varies from 15% to 25%, with normal radial strains ranging from 50% to 70%, and standard
deviations of 5% to 7%. Although reproducibility data have been published, there has been little
attention to test/retest variation, which is important if the technique is to be used in serial
follow‐up. Normal ranges for magnitude parameters are influenced by increasing age, pre‐load
(strain increases as LV size increases), and after‐load (strain decreases with increasing blood
pressure). Strain rate seems to be less dependent on loading. Regional variations pose an even
greater problem—in addition to ischemia, these may be caused by curvature or by non‐uniform
fiber direction and differences in angulation. The magnitude parameters obtained by Tissue
Doppler strain correlates well with Speckle derived strain.25
DATA ACQUSITION: Although integration of a regional velocity curve measures regional
Fig 4: Data sets derived from high frame rate 2‐dimensional (2D) color Doppler myocardial
velocity can be displayed either as real‐time 2D velocity (top left) or strain rate (SR) (bottom left)
image. Regional velocity or SR profiles can also be derived from any selected point in 2D data
sets during postprocessing
Although regional systolic strain rates (SRs) measure the rate of local deformation, regional
systolic strain expresses the percentage of deformation (note that regional estimation provides
no information on absolute wall thickness but only measures relative changes). Each regional
strain curve can be subdivided into component parts, each of which represents a different
mechanic phase of cardiac cycle (Figure 5). This subdivision is done by incorporating timing data
for global mechanical events into the SR/strain curve. Normally, such subdivision of the
[image:20.612.76.544.73.408.2]closure, and mitral valve opening. Currently, radial strain can only be processed reliably for
Fig 5: Data on timing of global events is implanted into normal regional velocity, strain rate,
and strain rate (SR) curves to subdivide cardiac cycle into mechanical components. ICT,
Isovolumic contraction time; IVRT, isovolumic relaxation time.
posterior wall segments. Radial strain cannot be measured in the septum by current methods.
This is most likely a result of the functionally bilayered structure of the interventricular septum
and the presence of two radial velocity gradients within the septum, one on the left ventricular
(LV) side and one on the right.
Normal segmental velocity, SR, and strain values for both radial and longitudinal function for a
group of healthy adults (age 20‐40 year) have already been defined by Sun JP et al as well as
[image:21.612.75.534.102.440.2]significantly higher in the radial direction (normal radial peak systolic strain value: 50%‐70%)
compared with longitudinal peak systolic strain (normal value: 20%‐30%) in the same segment.
For each wall, the regional deformation curves can be time aligned and displayed together with
the timing of global events to allow the evaluation of the temporal changes in regional
deformation within the wall. In addition to recording regional radial and longitudinal SR/strain,
it is also possible to resolve circumferential‐radial shear strain. This describes the local torsion
and twisting/untwisting, and can be derived from a series of parasternal short‐axis views taken
at apical and midpapillary muscle levels with data taken at high frame rate, ie, 200 frames/s.
CHANGES IN PRELOAD, AFTERLOAD, and CONTRACTILITY: HOW DO THEY AFFECT SR
MEASUREMENT ?
Myocardial deformation is the result of the complex interaction of intrinsic contractile force
and extrinsic loading conditions applied to a tissue with variable elastic properties. Therefore,
changes in preload and afterload, and the changes in myocardial stiffness, are important
determinants of the pattern and the magnitude of myocardial deformation. Thus, SR and strain
indices are not direct measures of contractility. Mathematic modelling studies would predict
that peak systolic strain values will increase with increasing preload as long as contractile
function is preserved, 26 whereas peak systolic strain values will decrease both with increasing
ventricular size and with increasing afterload (again with preservation of contractile function).
Regional peak systolic values will also decrease if intrinsic contractility is reduced, as in regional
ischemia or in cardiomyopathies. It is interesting to note that longitudinal end‐systolic strain
values should be proportionally more decreased by dilatation when compared with radial
related to local contractile function and is less dependent on changes in preload or afterload.
Indeed, by measuring peak systolic SR (or, even better, rate of increase of SR) we may come
closest in clinical practice to representing regional contractile function. These modelling
predictions have subsequently been substantiated in the experimental setting by Weidemann
et al,27 who studied normal myocardium. In this study, ultrasound‐derived peak systolic SR
correlated best with dP/dt (an index of contrac‐ tile function), whereas peak systolic strain
correlated best with changes in stroke volume and, therefore, was more closely related to
changes in global hemodynamics than changes in contractility.
POTENTIAL CLINICAL APPLICATION OF STARIN IMAGING
Ischemic Heart Disease
Despite several attempts to implement new cardiac ultrasound methods to quantify ischemia,
the routine clinical evaluation of regional function in ischemic heart disease has remained firmly
on the basis of visual assessment of wall motion and wall thickening. However, the eye has
been shown to have limitations in assessing the timing of the complex changes in regional
myocardial deformation that occur in differing ischemic substrates. Kvitting et al28 showed that
healthy individuals can neither reliably visualize nor time regional mechanical events when they
occur at a time interval of less than 90 milliseconds. Thus, postsystolic thickening (PST), which is
an important parameter to measure when attempting to quantify regional ischemia (and which
usually lasts only 50‐60 milliseconds), may neither be displayed by ultrasound systems with low
frame rates nor, if displayed, be appreciated visually. Even in ultrasound systems with
sufficiently high frame rates, it would be necessary to time aortic valve closure to determine
there is a need for a fully quantitative temporally resolved ultrasound approach to study the
regional changes in deformation induced by ischemia. In theory, this approach could be on the
basis of the high spatial and temporal resolution inherent in M‐mode echocardiography.
However, this approach often can only be applied to the quantification of radial function in two
myocardial segments (basal septum and basal posterior wall). Long‐axis function of each of the
4 cardiac walls can also be studied by M‐mode by measuring atrioventricular plane
displacement. However, this measurement only reflects the sum of the regional displacements
in the underlying wall segments and does not, per se, measure regional function. SR/strain
imaging could, allow the quantification of longitudinal segmental deformation throughout a
myocardial wall. However, in the radial direction, it can normally only be applied to the
posterior wall mid and basal segments. Several experimental studies have already shown that
both radial and longitudinal 1‐dimensional ultrasonic deformation indices can discriminate
between the different ischemic substrates.29 Such differentiation is on the basis of the
comparison of regional deformation information acquired both at rest and during a low‐dose
dobutamine challenge. The sequence of changes in deformation consistently induced by acute
ischemia has been well defined by both experimental sonomicrometric and cardiac ultrasound
studies.30,31 Acute ischemia induces both early systolic thinning and a delay in the onset of
systolic thickening. There is also a flow related progressive decrease in the rate and degree of
systolic thickening. Concomitant with the decrease in maximal systolic thickening, an abnormal
ischemia‐related thickening of the myocardium occurs after aortic valve closure. This abnormal
phenomenon has been termed “ischemia‐induced PST”. Experimental ultrasound studies have
maximal systolic SR/strain with a concomitant development of increasing PST. Ischemia‐related
changes in systolic SR/strain indices have also been shown to be detectable earlier than are
changes in either tissue velocities or the visual detection of regional wall‐motion abnormalities.
Stunned myocardium (ie, postischemic myocardium with flow reserve) has an abnormal
deformation pattern at rest that is similar to that of ischemic myocardium (ie, myocardium with
inadequate flow reserve). However, during a low‐dose (10‐15 mcg/kg/min) dobutamine
challenge, the response of stunned versus ischemic myocardium was completely different. A
“stunning” response is characterized by normalization of peak systolic SR/strain with an
associated progressive decrease in PST, whereas an ischemic response is characterized by a
dose‐dependent increase in PST associated with either a reduction or no change in systolic
SR/strain32 Infarcted myocardium also has abnormal systolic and early diastolic deformation
properties. The differentiation of an acute or chronic transmural infarction from a
nontransmural infarction can also be achieved by combining a baseline study with a low‐dose
dobutamine challenge. A partial‐thickness infarct will have markedly reduced systolic strain at
rest (with some PST). During a low‐dose dobutamine challenge a partial‐thickness infarct will
exhibit an ischemic response, ie, an increase in PST associated with a reduction or no change in
systolic SR/strain. It has also been demonstrated that the deformation properties of a
nontransmural infarct segment are closely related to the transmural extension of the scar; ie,
the lower the systolic deformation the greater the transmural extension of scar in the region at
risk. Conversely, transmural infarction is characterized by either no measurable systolic
deformation or the presence of abnormal thinning/lengthening at rest, with no inducible
deformation indices have also been used in the experimental setting to quantify changes in
regional deformation induced by reperfusion injury. After the induction of an acute transmural
myocardial infarction, acute reperfusion with Thrombolysis in Myocardial Infarction grade 3
(TIMI 3) flow induces an immediate marked and persistent increase in wall thickness, whereas
the severely reduced peak systolic SR/strain and PST remain unchanged during reperfusion. It is
interesting to note that in this study, during the progression of acute ischemia to transmural
infarction, regional peak systolic SR decreased progressively to near 0 whereas the degree of
PST was almost unchanged. PST also persisted during infarct reperfusion, showing that in
transmural infarction, regional PST is a passive phenomenon and not a direct marker of
segmental viability. Identical changes in deformation have also been observed for patients after
primary coronary intervention (PCI) for acute infarction in whom TIMI 3 flow was re‐
established. Initial clinical studies have also confirmed that consistent changes in regional
deformation are induced by vessel occlusion during PCI. In segments at risk (ie, those not
supplied by collaterals) there is an immediate decrease in systolic SR/strain by some 50%
compared with the baseline values. This is paralleled by the acute development of PST in the
segment at risk during balloon inflation with no measurable change in deformation in distal
nonischemic segments. On the other hand, in segments at risk supplied by collaterals balloon
occlusion resulted in only minor changes in systolic SR/strain and less PST compared with
noncollateralized segments at risk, indicating the protective nature of the collateral supply. In
the same clinical setting, myocardial peak systolic velocities were unable to differentiate
substrates, the typical resting abnormalities and the changes induced by a low‐dose
dobutamine infusion are set out in.33
Other Areas of potential use of Strain imaging:
The Quantification of Dobutamine Stress Echocardiography
The visual assessment of regional myocardial function during dobutamine stress
echocardiography (DSE) has been shown to be highly subjective and dependent on both image
quality and experience. There is also a considerable difference in the interpretation of DSE
among experienced readers. The visual inspection of stress echocardiography images is on the
basis of the analysis of radial motion/thickening. However, ischemic changes first affect long‐
axis function. Because of this, a quantitative technique that assesses both radial and
longitudinal function could enhance the clinical use and reproducibility of stress
echocardiography. Initial attempts to use DMI to quantify stress echocardiography images have
been on the basis of peak systolic velocity measurement. Although initial results have been
promising, peak systolic velocity measurement could only be applied with confidence to the
analysis of basal and midwall segments. Velocity measurement is also limited by both the
confounding effect of the exaggerated translational motion of the heart during a stress test and
the tethering that occurs between normal contracting and hypocontractile segments. Thus,
subtle changes in regional contractility during DSE potentially should be better described by the
measurement of local myocardial deformation indices. A series of clinical studies have shown
that whereas regional SR/strain data acquisition is feasible during a standard DSE,34 this
approach is not practical during either treadmill or bicycle exercise, as these two latter stress
in control subjects, the findings of prior experimental studies were duplicated (ie, for normal
myocardium, an incremental dobutamine infusion produces a linear segmental peak systolic SR
response and a biphasic peak systolic _ response). In addition, the differing responses in
deformation of ischemic, stunned, partial‐thickness, and fullthickness infarcted myocardium to
an incremental dobutamine challenge shown in experimental studies have all been reproduced
in the clinical setting. Furthermore, Voigt et al, 35 in a correlative study comparing deformation
changes induced during stress echocardiography with angiographic and perfusion scintigraphy
data, showed that deformation could be quantified in 85% of segments and visual assessment
of changes in curved M‐mode SR curves could be evaluated in 95% of all segments. The ratio of
induced postsystolic shortening to systolic shortening was found to be the best quantitative
parameter with which to identify stress‐induced ischemia, being 86% sensitive and 90%
specific. In light of the above findings, the following approach might be appropriate to apply to
the quantitation of DSE in clinical practice. First, there should be a visual inspection of the
images. The eye perceiving motion in all LV segments to be synchronous is highly predictive of
normality. When visual inspection suggests there is a regional wall‐motion abnormality, velocity
data could be used to ascertain if the segmental peak systolic velocity response is abnormal. If
abnormal, then ultrasonic deformation indices should then be used to define the ischemic
substrate. In hearts with the combination of conduction or rhythm abnormalities and complex
wall‐motion abnormalities, deformation imaging may be the first line approach to assessing
Table 4: Strain imaging in various spectrum of Acute Coronary Syndromes assessed by
Dobutamine stress
Valvular Heart Disease
Valvular heart disease can alter regional Valvular heart disease can alter regional deformation
indices in differing ways with changes reflecting the complex interactions of changes in
preload/afterload with changes in contractility. A good example of the problems inherent in
quantifying and interpreting regional function in valve disease is aortic stenosis. Traditional
imaging approaches have been on the basis of the visual interpretation of the combination of
[image:29.612.73.537.76.456.2]disease has its main effect on the subendocardial layer, which is better assessed by measuring
long‐axis function. Initial clinical experience with ultrasonic deformation indices in patients with
aortic stenosis demonstrated that the afterload‐related reduction in longitudinal systolic
deformation correlated both with aortic valve area and stroke volume. These clinical findings
are in keeping with those predicted by the mathematic model of Claus et al.26 In addition,
regional deformation indices could discriminate between patients with and without coronary
artery disease who have the same aortic valve area by identifying ischemia‐related changes in
deformation in the segments at risk. Myocardial velocity profiles could not make this
distinction.36
Diastolic Function
Regional abnormalities in myocardial diastolic motion may be detectable despite mitral and
pulmonary vein velocities being normal. Garcia‐Fernandez et al37 already demonstrated in an
experimental model of acute ischemia that up to 40% of segments may have measurable
regional diastolic motion abnormalities whereas blood pool indices remain normal. It should
also be appreciated that changes in regional diastolic function may be expressed differently in
the radial versus the longitudinal direction. For example, for basal segments, changes in E’
velocities/deformation with increasing filling are more pronounced in the radial direction
compared with the longitudinal. One advantage of the new ultrasound deformation SR/strain
indices for the study of diastolic events is that they offer very high real‐time temporal
resolution of deformation (sampling rates of 200 frames/s) compared with other noninvasive
imaging modalities. This is important when studying diastole, as very high amplitude, short‐
change during the isovolumic relaxation period). SR imaging has shown the normal sequence of
regional changes in deformation during diastole to be complex. Regional lengthening will
usually commence in the midinferior septal segment. This early lengthening may start before
aortic valve closure. The early midseptal lengthening may have propagated to the apex by the
time of mitral valve opening. The basal segments are the last to start to lengthen in early
diastole. Their lengthening is associated with the onset of flow into the LV. In contrast, in the
free walls, changes in deformation are more variable. After the cessation of early lengthening
as a result of early filling, there is a reverse lengthening wave caused by passive recoil, which
starts at the apex and spreads toward the base. This recoil is more prominent in young people
and has been related to the presence of an audible third heart sound. During diastasis there are
usually no measurable changes in deformation. Diastasis is followed by a base‐apex wave of
lengthening that is caused by atrial filling of the ventricle. This normal pattern may be markedly
altered in disease.
Cardiomyopathies
A number of studies on the application of velocity, SR, and strain indices to both hypertrophic
and dilated cardiomyopathies have been published.38 In hypertrophic cardiomyopathies, the
thick walls make this disease particularly suitable to studies with SR/strain imaging. SR/strain
imaging indices have been shown to be better than regional velocity profile data in detecting
regional abnormalities in patients with asymmetric septal hypertrophy and in discriminating
hypertrophic cardiomyopathy from physiologic hypertrophy. SR/strain imaging has also been
shown to be better than either gray‐scale M‐mode or velocity data in detecting changes in
antioxidant treatment for hypertrophic cardiomyopathy. Conversely, applying SR/strain imaging
to the study of dilated cardiomyopathies has proved to be very difficult. This is because of a
combination of factors: in these hearts the myocardial walls are thin and hyporeflective and the
shape of the heart is more spheric. Thus, it is difficult to derive interpretable SR/strain curves
because of the combination of poor signal‐noise ratio, a small region of interest, and poor
alignment of the ultrasound beam to the deformation vector to be interrogated.
Right Ventricular Function
Regional right ventricular (RV) velocities, 1‐dimensional strain and SR data can also be derived
from segments of the RV free wall. To characterize regional RV myocardial function, data can be
obtained on radial deformation (by parasternal imaging) and free‐wall longitudinal deformation
(By apical imaging). Kowalski et al 11 studied regional RV SRs and strain in control subjects and
defined segmental velocity/SR/strain profiles and peak values for both radial and longitudinal
regional deformation throughout the LV and RV. However, using current methodology, radial
SR/starin values proved difficult to measure from the normal thin (6 mm) RV free wall, as the
small computational distance, combined with near field imaging artifacts, made accurate
postprocessing of radial RV SR/strain values difficult.
Monitoring Therapy
The evaluation of new therapeutic strategies that affect ventricular function could benefit from
a sensitive, noninvasive measurement technique. Gray‐scale echocardiography is the current
standard clinical ultrasound approach to assessing LV mass and global LV function.
Unfortunately, the sensitivity with which these two parameters can be measured is limited.
only detectable at group level. The relative insensitivity of gray‐scale imaging is a result of the
fact that measurement is on the basis of image segmentation by using signal amplitudes. In
contrast, SR/strain imaging is potentially more sensitive to change, as it is on the basis of
detection of phase shifts and this is inherently less noise sensitive. This advantage was clearly
shown in the clinical study of Di Salvo et al 39 in which SR data were able to detect LV mass
regression in individual patients with Friedreich’s ataxia after 4 months of an antioxidant
therapy. This allowed the early detection of both responders and nonresponders. These
findings contrasted with both regional velocity (unchanged during treatment) and gray‐scale
data, both of which could only detect changes in LV mass index at group level after 1 year of
therapy. Ultrasoundbased deformation imaging is inherently more sensitive in detecting
abnormalities in systolic function and has been confirmed in further clinical studies including
amyloid, Fabry’s disease, type 2 diabetes, aging, Duchenne’s muscular dystrophy and
anthracycline therapy.
The Potential Role of SR/Strain Imaging in Congenital Heart Disease
Deformation imaging has been used to monitor LV function in patients with abnormal left
coronary artery arising from the pulmonary artery both before and after coronary
reimplantation, 40,41 and in the late follow‐up. Weidemann et al42 also used SR/strain imaging to
assess regional RV function late postrepair of tetralogy of Fallot and showed a homogeneous
reduction in deformation properties both within the RV free wall (reflecting the degree of RV
dilatation) and throughout all LV walls for both longitudinal and radial function. Conversely,
myocardial velocities in the LV posterior wall were significantly increased most probably
segments to the dilated RV. SR and strain measurements have also been used to identify and
quantify normal and abnormal systemic ventricle regional function in children after an atrial
AIM OF THE STUDY
To assess longitudinal strain of individual segments and global LV function by strain imaging in
patients with acute ST‐elevation myocardial infarction and to compare them with wall motion score
MATERIALS & METHODS:
Study Population: The study was conducted in patients admitted to the intensive care unit of Govt. Rajaji
hospital, Madurai. Fifty two patients with a diagnosis of Acute ST elevation anterior wall MI were
studied. Thirty two patients had an acute anterior wall MI and twenty had inferior wall MI. Age group of
study in the AWMI group was 52.7+ 9.4, in the IWMI group it was 50.7 + 9.1. 22% of AWMI patients
and 20% in the IWMI group were females. 32% patients in the AWMI and 30% in IWMI were diabetic.
The prevalence of systemic hypertension in the AWMI was higher 43% and in the IWMI group was 20%.
Smoking prevalence was substantial in both MI groups, 75% and 87% in AWMI and IWMI respectively.
75% in the AWMI and 85% in the IWMI group were eligible candidate were thrombolysed.
Inclusion Criteria:
1. Patients with Acute ST elevation MI- Anterior wall and Inferior wall
Exclusion Criteria:
1. Previous Myocardial Infarction
2. Patients with unstable rhythm (Atrial Fibrillation, Heart blocks, Ventricular Tachycardia)
3. Patients with associated Valvular Heart Disease.
4. Patients on Permanent Pacemakers
Localization of MI in the patient population.
Gender Distribution of the study population
32
20
0 10 20 30 40
AWMI IWMI
25
16
7
4
0 5 10 15 20 25 30
AWMI IWMI
Male
Age distribution of the population
Prevalence of Risk Factors.
Echocardiography:
A detailed Echocardiographic evaluation for regional wall motion analysis was done on all
patients using Philips iE33 machine.
Wall Motion Score Index: Two‐dimensional (2‐D) images of the LV were obtained from the apical four‐
chamber view and two chamber view. Wall motion was assessed by analyses of movement and
thickening of the myocardium in the three septal and three lateral segments in the apical four‐chamber
and two chamber views. A score was given to each segment: 1 = normal, 2 = hypokinesia, 3 = akinesia,
4 = dyskinesia, 5= aneurysm. A wall motion score index (WMSI) was calculated as the sum of scores over
number of analyzed segments8 All analyses were performed from three regions along the
interventricular septum (apical, mid‐ and basal septum) and in the corresponding regions on lateral wall.
Simpson method derived ejection fraction was calculated in all patients. A biplane derived EF is
obtained in all patients in A2C and A4C views. This was done by tracking the endocardial border of LV in
the above mentioned views and obtaining the end systolic and end diastolic volumes. The stroke volume
is calculated and the %EF obtained.
Strain (e) is originally defined as a dimensionless quantity produced by the application of a stress. It
represents the fractional or percentages change from the original or unstressed dimension. This equals
the relative change of segmental length occurring between the reference state (end‐diastole) and the
state of deformation (end‐systole) expressed in percentage of end‐diastolic length.
The strain imaging in this study was obtained with the patient in the left lateral decubitus
position using a commercially available system (PHILIPS iE33). The images were acquired using a 3.5‐
MHz transducer at a depth of 16 cm in the parasternal and apical views (2‐ and 4‐chamber images). All
echocardiographic data were analyzed off‐line using Tissue motion Quantification (TMQ advanced)
method of the Q‐Lab software. Analysis of individual myocardial segments was the principal component
chamber view analyzed the basal, mid, apical inferior and anterior segments. Left ventricular apex was
analyzed in both views. The peak systolic longitudinal strain was measured. The global LV longitudinal
strain was assessed with this commercially available technique, myocardial tissue deformation is
calculated using speckle tracking from 2D gray‐scale images (2‐ and 4‐chamber views). Aortic valve
closure timing was marked in the selected views, and 3 points were anchored inside the myocardial
tissue, 2 placed at the basal segments along the mitral valve annulus and 1 at the apex. These points
triggered the automatic process, which analyzed myocardial motion by tracking features (natural
acoustic tags). The percentage of wall lengthening and shortening was displayed for each plane and
represented longitudinal strain. The results of all planes were then combined, which presents the
analysis for each segment along with a global strain value for the entire left ventricle.
The mean frame rate of the obtained images was 70 frames/s (range 40 to 100). Only one
cardiac cycle needs to be acquired for the off line processing but the major issue here is the high quality
image with the maximum possible resolution. The necessity of high image quality is a major limitation
for routine clinical applicability in all patients. At present, the optimal frame rate for speckle tracking
seems to be 50–70 frames per second (FPS), which is however lower compared to TDI (180 FPS). Using
higher frame rates could reduce the under‐sampling problem, but this will result in a reduction of spatial
resolution and consequently less optimal region of interest (ROI) tracking. Low frame rate increases the
spatial resolution, but because speckle tracking software uses a frame‐by‐frame approach to follow the
myocardial movement and searches each consecutive frame for a speckle pattern closely resembling
and in close proximity to the reference frame, with too low a frame rate the speckle pattern could be
outside the search area, again resulting in poor tracking . It is also important to know that different
tracking algorithms potentially produce different results and therefore it should be kept in mind that a
dependency is a great advantage of non‐ Doppler 2D‐strain imaging in comparison to TDI‐derived strain
data.
In our study the automated tracking by the machine may either be accepted as such or altered
according to the wish of the operator if the automated tracking is not satisfactory. This is accomplished
by using the reference point’s function and adjusting the same to match the segment correctly. The
strain was obtained at the peak systole by ECG gating. Placing the cursor at the individual curve at the
peak systolic line gives the value of longitudinal strain of individual segment. Thus the values are
calculated for all the segments and displayed separately is a table. The global strain derived is
automatically displayed by the software and if the tracking is acceptable, this value may be taken as
such. In other cases where the tracking is not satisfactory the image settings are adjusted until a proper
tracking is obtained. The image taken at the apical long axis view was consistently measured as that of
the septum and lateral wall by the software though it did not mean it. Hence for the sake of
questionable acceptability in recognized forums, the values in the particular view were ignored. This
might be considered as one of the major limitation of the study.
The Longitudinal strain obtained is depicted along the Y‐axis of the image as %
shortening/lengthening. The value can be manually calculated by noting the excursion of the plot of
individual myocardial segment. A good excursion of the plot along the X‐Y axis is indicative of good
myocardial strain and hence a good LV function of the segment concerned. When there is uniformly
good excursion of all segments it indicates normal global LV function.
RESULTS
Statistical analysis: Data analysis was done with the help of computer using Epidemiological Information
Package (EPI 2008) developed by Center for Disease Control, Atlanta. Using this software, range,
frequencies, percentages, means, standard deviations, coefficient of correlation and ‘p’ values were
calculated. A ‘p’ value less than 0.05 is taken to denote significant relationship .If the coefficient of
correlation is more than or equal to + 0.5, then there exists significant relationship between the two
variables. A coefficient of correlation of 0.8 or more signifies that a very strong relationship exists
between the two variables.
Peak systolic Longitudinal strain was reduced in the individual ischemic myocardial segments and
uniformly normal in the non‐ischemic segments.[Fig.1] In anterior wall MI patients the WMSI was
increased and strain reduced in mid, apical septum; LV apex; basal, mid and apical lateral; basal, mid and
apical anterior segments. Statistical analysis of the data revealed positive correlation(>0.50) between
the values obtained by WMSI and strain in the basal, mid and apical lateral segments ; basal, mid and
apical anterior. Even though the mid septal ,apical septal and apical segments showed reduced strain,
statistical positive correlation was lacking in these areas. Similarly the basal septal, mid, apical lateral
segments; basal, mid, apical inferior segments showed reduced sterian and increased WMSI. However
only the basal septum, basal, mid and apical inferior segments showed positive
Fig I(a): M‐Mode Echo Teichholz method for calculation of EF in a AWMI patient
[image:43.612.73.416.69.305.2] [image:43.612.74.416.431.669.2]