Page
1
of
16
Statistical First Release
NEET Quarterly Brief – October to December 2014
Reference SFR 8/2015
Date 26 February 2015
Coverage England
Theme Children, Education and Skills
Issued by Department for Education, Sanctuary Buildings, Great Smith Street, London SW1P 3BT
Press office 020 7783 8300
Public enquiries 0370 000 2288
Statistician Dexter Roberts
Email Post16.STATISTICS@education.gsi.gov.uk
Internet DfE-NEET-Statistics
Note: No changes are statistically significant
A National Statistics publication
National Statistics are produced to high professional standards set out in the National Statistics Code of Practice. They undergo regular quality assurance reviews to ensure that they meet customer needs. They are produced free from any political interference.
The proportion of young
people NEET fell across all
summary age groups and
was the lowest on record
for 16-18 year olds.
The
16-18
NEET rate fell to 7.0% in October to December
2014, 0.6 percentage points lower than October to December
2013 and the lowest October to December figure since
comparable data began in 2000.
The
19-24
NEET rate fell by 1.2 percentage points (to 15.9%)
in the same period and the overall
16-24
rate fell by 1.0
percentage points (to 13.1%).
For both
16-18
and
19-24
year olds, this change was driven by
a fall in the proportion of those not in education or training
(NET) and a rise in the employment rate of the NET group.
The proportion of those not
in education or training
(NET)
fell
across
all
summary age groups and
was the lowest on record
for 16-18 year olds.
The proportion of
16-18
year olds NET fell by 1.0 percentage
points (to 13.0%) and was the lowest since comparable data
began in 2000 and 12.1 percentage points lower than the
highest point in 2001.
Page
2
of
16
1. Background and context
This note sets out the available statistics on young people not in education, employment or
training (NEET) and young people not in education or training (NET) from three data
sources. The data from all three sources cover England, and are based on academic age.
Estimates of 16-24 year olds NEET in the UK, based on calendar age, are published by ONS
on the same day as this release. The long term trends in the ONS data are similar to those
shown in this release, although the different coverage and ages used can lead to some
discrepancies when comparing change between specific points in time. Further details and
a link to the ONS publication are available in section 2.f.
1
The methodology used to produce these data was revised in May 2013 to ensure harmonisation with the new ONS UK NEET estimates. Further information about this change and the impact on previously released data can be found in the
Harmonised NEET Methodology paper.
Participation Statistical
First Release (SFR)
These are the authoritative national estimates of NEET and
NET rates. They are published annually in the ‘Participation
in Education, Training and Employment by 16-18 Year Olds
in England’ SFR. These data are only available annually and
cannot be disaggregated to sub-national levels.
Quarterly Labour Force
Survey (LFS)
1Analysis of the LFS allows in-year estimates to be made of
NEET and NET trends as well as estimates for other age
groups, including 16-24, 18-24 and 19-24. The quarterly LFS
estimates cannot be directly compared with the headline
Participation SFR series which is based on more detailed but
less timely data.
The most recent LFS based estimates for NEET, for the period
October to December 2014, are shown in the table below
along with 2012 and 2013 data.
Local Authorities’ Client
Caseload Information
System (CCIS)
Page
3
of
16
Headline Results Table
Table: NEET rates for different age cohorts: England 2012 – 2014
October to
December
2012
October to
December
2013
October to
December
2014
% point change from
October to December
2013 to October to
December 2014
Age 16
3.6% 3.2% 2.5% -0.8pptsAge 17
5.3% 4.9% 5.2% +0.3pptsAge 18
14.5% 14.3% 13.0% -1.3pptsAge 16-18
8.0% 7.6% 7.0% -0.6pptsAge 19-24
18.1% 17.1% 15.9% -1.2pptsAge 16-24
14.9% 14.1% 13.1% -1.0pptsSource: Labour Force Survey, October to December Note: No changes are statistically significant
2. Trends
Historical Context
Understanding the historical trends in NEET rates is an important part of placing current
performance in perspective. The chart below shows the NEET Participation SFR measure
from 1994 along with the LFS NEET measure back to 2000 (the furthest back that the
methodology for each measure can be applied consistently).
The 16-18 NEET rate has tended to fluctuate at around 8-10%, although since 2008 both
measures have shown a downward trend.
Chart 1: NEET historical series for 16-18 year olds: England, end 1994 - end 2014
Page
4
of
16
a. NEET Participation SFR series (last updated August 2014)
The Department’s Statistical First Release (SFR)
'Participation in Education, Training and
Employment by 16-18 Year Olds in England', published in June 2014, is the primary
source of national data on 16-18 year olds NEET. This showed that:
b. NEET quarterly LFS series (last updated February 2015)
We can monitor trends in NEET rates between the publications of the Participation SFR
series using quarterly LFS data.
The trend data for 16-18 year olds shows seasonal patterns that reflect the academic year:
lower rates in autumn (October to December) followed by a gradual rise in spring and
early summer (January to June) with a peak in late summer (July to September).
Participation in education
or training had increased…
Between end 2012 and end 2013 the proportion of 16-18 year
olds participating in education and training increased from
83.6% to 85.6%.
…the employment rate of
the NET group had
increased…
Over the same period, the employment rate of the 16-18 year
olds not in education or training rose from 43.8% to 47.4%.
…resulting in a large fall in
the proportion of young
people NEET.
The result of these two factors is that the proportion of 16-18
year olds NEET at the end of 2013 decreased by 1.6
percentage points to 7.6%.
The proportion of 16-18
year olds NEET has
decreased.
7.0% of 16-18 year olds were NEET in
October to December
2014. The drop of 0.6 percentage points compared to the same
period last year is not statistically significant. This is the
lowest comparable figure since consistent data began in 2000
and is 3.6 percentage points lower than the high point of
10.6% in 2005.
This fall has been caused by
increased participation and
also employment.
The proportion of 16-18 year olds NET decreased by 1.0
percentage points in the last year to 13.0% (see section e for
more details).
Page
5
of
16
Chart 2: NEET Quarterly LFS Series, age 16-18: England, Oct-Dec 2005 to Oct-Dec 2014
Source: Quarterly Labour Force Survey and Participation SFR.
Note: Q1 relates to the months January to March, Q2 relates to April to June, Q3 relates to July to September and Q4 relates to October to December.
c. Regional NEET (last updated August 2014)
The regional picture on 16-18 NEET is taken from
Local Authorities’ Client Caseload
Information System (CCIS), published in May 2014.
CCIS data indicates that the northern English regions have higher NEET rates, i.e. North
East, North West and Yorkshire and Humberside. In comparison, London and East
Midlands have the lowest NEET rates.
Chart 3: Regional NEET, age 16-18: England, Nov 2013-Jan 2014 average
Page
6
of
16
Note that Local Authority CCIS data are published annually and tend to show a lower
percentage NEET than either the Participation SFR or LFS data sources. In addition,
regional NEET estimates for 16-24, 18-24 and 19-24 year olds summary age groups based
on the LFS are published as supplementary tables alongside this Quarterly Brief.
d. NET Participation SFR series (last updated August 2014)
When examining NEET data, it is also important to contextualise it with data on the
proportion of young people not in education or training (NET). These data are also taken from
the SFR ‘Participation in Education, Training and Employment by 16-18 Year Olds in
England’.
Chart 4: NET Participation SFR series, age 16-18: England, end 2000 – end 2013
Source: Statistical First Release (SFR) ‘Participation in Education, Training and Employment by 16-18 Year Olds in England’
Page
7
of
16
e. NET quarterly LFS series (last updated February 2015)
As with the NEET data, we can look at the in-year NET trend data using the quarterly
LFS. The NET series shows the same seasonal pattern as the NEET series. The latest data
shows that:
Chart 5: NET Quarterly LFS series, age 16-18: England, Oct-Dec
2005 to Oct-Dec
2014
Source: Quarterly Labour Force Survey and Participation SFR.
Note: Q1 relates to the months January to March, Q2 relates to April to June, Q3 relates to July to September and Q4 relates to October to December.
The proportion of 16-18
year olds NET has
decreased…
13.0 % of 16-18 year olds were NET in October to December
2014. This is a drop of 1.0 percentage points compared to the
same period last year. The change is not statistically
significant. This is the lowest comparable figure since
consistent data began in 2000 and is 12.1 percentage points
lower than the peak of 25.1% in 2001.
…driven predominantly by
a fall in the proportion of
18 year olds
Page
8
of
16
3. Methodology and Notes
a. NEET and NET Participation SFR series
Description
These data give the definitive measures for 16-18 NEET and NET rates in
England.
Uses
These series should be used as the national time series for 16-18 year
olds NEET and NET in England. The NET series should be used as context
for any NEET data.
Geographical Coverage
England
Age coverage
Academic age 16 to 18
Published source
Statistical First Release (SFR) ‘Participation in Education, Training and
Employment by 16-18 Year Olds in England’
Primary sources
The Schools' Census
Pupil Level Annual Schools’ Census
The Individualised Learner Record (ILR)
Higher Education Statistics Agency (HESA)
Higher Education Students Early Statistics (HESES)
Labour Force Survey
Mid-year estimates and projections of population from the Office for
National Statistics (ONS)
Last period covered
End 2013
Last published
June 2014
Next published
June 2015
b
.
NEET and NET quarterly LFS series
Description
These series are quarterly estimates of NEET and NET amongst young
people from the LFS. They are not directly comparable with the
Participation SFR measure.
However, these statistics are produced using the same methodology as
the ONS UK NEET estimate.
Full details are published in the
technical specification
.
Uses
These series provide more timely data on the recent trends in NEET and
NET since the last Participation SFR. Trends should be assessed by
comparing the current time period with the same time period in the
previous year, to account for seasonal effects. For example,
October-December figures should not be compared with January-March figures.
The NET series should be used as context for any NEET data.
Geographical coverage
England
Age coverage
Academic age 16 to 24
Published source
Quarterly Labour Force Survey
Primary sources
Quarterly Labour Force Survey
Last Period Covered
October-December 2014
Last published
February 2015
Page
9
of
16
c
. Regional NEET
Description
This series is a 3 month average snapshot estimate of the regional NEET
rate taken from the Local Authority Client Caseload Information System
(CCIS) data. It is neither directly comparable with the LFS nor the
Participation SFR series due to the use of ‘currency’ rules. The activity
status of young people in education or employment is not actively
checked every month, but has a shelf life depending on the type of
educational course or the nature of the employment.
For young people whose currency is lapsed a historical assumption is
made on the proportion NEET, taking into account their previously
reported activity.
The combination of both factors leads to estimates of NEET in the CCIS
data that tend to be lower than those estimated from the LFS or those
reported in the annual participation statistical first release.
Uses
This series shows the data, aggregated in regions, used by Local
Authorities to inform local activity and target setting.
Geographical Coverage
England
Age coverage
Academic age 16 to 18
Published source
Management information published on the DfE website as policy data:
16- to 18-year-olds NEET
Primary sources
Client Caseload Information System (CCIS)
Last Period Covered
November 2013 – January 2014 average
Last published
May 2014
Next published
June 2015
d. Scheduled revisions to previously published statistics
Labour Force Survey (LFS) datasets are routinely reweighted in line with population
estimates. The most recent update introduced a new weighting variable, PWT14, to LFS
datasets from July - September 2001 onwards. More information about the impact of the
reweighting on the NEET and NET rates is available in an additional spreadsheets published
with the July to September 2014 quarterly brief.
The PWT14 weights reflects the most recent population estimates for England and Wales,
announced by the Office for National Statistics (ONS) on 16
thJuly 2012.
ONS have produced a comparison of the 2011 Census and the LFS labour market indicators
which can be found at the following link:
http://www.ons.gov.uk/ons/rel/census/2011-census/key-statistics-for-local-authorities-in-england-and-wales/rpt-labour.html
Page
10
of
16
e. National Statistics Publication
The United Kingdom Statistics Authority has designated these statistics as National Statistics,
in accordance with the Statistics and Registration Service Act 2007 and signifying compliance
with the Code of Practice for Official Statistics.
Designation can be broadly interpreted to mean that the statistics:
meet identified user needs;
are well explained and readily accessible;
are produced according to sound methods, and
are managed impartially and objectively in the public interest.
Page
11
of
16
f. Equivalent statistics from the Welsh Assembly Government, Scottish Government and the Office for National Statistics (ONS)
Welsh Assembly Government (WG) Scottish Government (SG) Office for National Statistics (ONS)
Description 1. Annual SFR statistics produced in a method
analogous to the DfE annual SFR.
1. Statistics based on the Annual Population Survey (APS).
1. Monthly Labour Force Survey (LFS) statistics for young people not in full-time education and not in employment -Table 14 from the Labour Market Statistics bulletin.
2.Quarterly Statistics based on the Annual Population Survey (APS). Definition of NEET corresponds to that used in the DfE NEET Quarterly Brief
2. Annual school leaver statistics 2. Quarterly Statistics based on the Labour Force
Survey (LFS). Definition of NEET corresponds to that used in the DfE NEET Quarterly Brief.
3. Pupil destinations based on Careers Wales Survey.
3. Combination of DWP benefits data and school leaver destinations
Uses 1. Regarded as the definitive measure of headline
NEET estimates in Wales.
1. National estimates of NEET. 1. Part of wider labour market statistics; rolling
3-month average both seasonally-adjusted and not seasonally-adjusted; roughly equivalent to NEET but will include some young people in part-time education.
2. Timely data; regional or single-age estimates based on averaging 3 years of data.
2. Proportion of young people in 'positive destinations'. The complement is roughly equivalent to NEET, but will include some young people in part-time education.
2. UK estimate, seasonally adjusted.
3. Local area estimates of NEET. 3. Local area estimates of NEET.
Geographical Coverage
Wales Scotland United Kingdom (UK)
Age coverage Academic age 16-18, 19-24 (SFR); academic age
16-18, 19-24 (APS); interviews in October following Year 11 (Careers Wales)
Actual age 16-19. Actual age 16-17 and 18-24.
Published source
1. Welsh Government | Participation of Young People in Education and the Labour Market, 2012 and 2013 (provisional)
1. Local Area Labour Markets in Scotland: Statistics from the Annual Population Survey 2013
1.UK Labour Market - February 2015
2. Young People Not in Education, Employment or Training (NEET), Year to 30 June 2014
2. Summary statistics for attainment, leaver destinations and healthy living, No. 4: 2014 Edition
2. ONS UK NEET, February 2015
Page
12
of
16
4. Tables
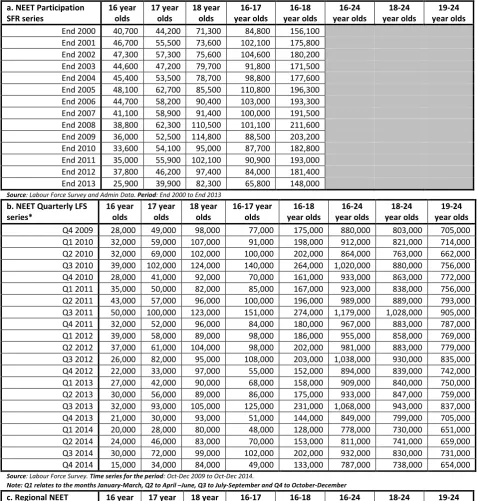
Table 1: Number Not in Education, Employment or Training (NEET): England
a. NEET Participation SFR series 16 year olds 17 year olds 18 year olds 16-17 year olds 16-18 year olds 16-24 year olds 18-24 year olds 19-24 year olds End 2000 40,700 44,200 71,300 84,800 156,100 End 2001 46,700 55,500 73,600 102,100 175,800 End 2002 47,300 57,300 75,600 104,600 180,200 End 2003 44,600 47,200 79,700 91,800 171,500 End 2004 45,400 53,500 78,700 98,800 177,600 End 2005 48,100 62,700 85,500 110,800 196,300 End 2006 44,700 58,200 90,400 103,000 193,300 End 2007 41,100 58,900 91,400 100,000 191,500 End 2008 38,800 62,300 110,500 101,100 211,600 End 2009 36,000 52,500 114,800 88,500 203,200 End 2010 33,600 54,100 95,000 87,700 182,800 End 2011 35,000 55,900 102,100 90,900 193,000 End 2012 37,800 46,200 97,400 84,000 181,400 End 2013 25,900 39,900 82,300 65,800 148,000
Source: Labour Force Survey and Admin Data. Period: End 2000 to End 2013
b. NEET Quarterly LFS series* 16 year olds 17 year olds 18 year olds 16-17 year olds 16-18 year olds 16-24 year olds 18-24 year olds 19-24 year olds Q4 2009 28,000 49,000 98,000 77,000 175,000 880,000 803,000 705,000 Q1 2010 32,000 59,000 107,000 91,000 198,000 912,000 821,000 714,000 Q2 2010 32,000 69,000 102,000 100,000 202,000 864,000 763,000 662,000 Q3 2010 39,000 102,000 124,000 140,000 264,000 1,020,000 880,000 756,000 Q4 2010 28,000 41,000 92,000 70,000 161,000 933,000 863,000 772,000 Q1 2011 35,000 50,000 82,000 85,000 167,000 923,000 838,000 756,000 Q2 2011 43,000 57,000 96,000 100,000 196,000 989,000 889,000 793,000 Q3 2011 50,000 100,000 123,000 151,000 274,000 1,179,000 1,028,000 905,000 Q4 2011 32,000 52,000 96,000 84,000 180,000 967,000 883,000 787,000 Q1 2012 39,000 58,000 89,000 98,000 186,000 955,000 858,000 769,000 Q2 2012 37,000 61,000 104,000 98,000 202,000 981,000 883,000 779,000 Q3 2012 26,000 82,000 95,000 108,000 203,000 1,038,000 930,000 835,000 Q4 2012 22,000 33,000 97,000 55,000 152,000 894,000 839,000 742,000 Q1 2013 27,000 42,000 90,000 68,000 158,000 909,000 840,000 750,000 Q2 2013 30,000 56,000 89,000 86,000 175,000 933,000 847,000 759,000 Q3 2013 32,000 93,000 105,000 125,000 231,000 1,068,000 943,000 837,000 Q4 2013 21,000 30,000 93,000 51,000 144,000 849,000 799,000 705,000 Q1 2014 20,000 28,000 80,000 48,000 128,000 778,000 730,000 651,000 Q2 2014 24,000 46,000 83,000 70,000 153,000 811,000 741,000 659,000 Q3 2014 30,000 72,000 99,000 102,000 202,000 932,000 830,000 731,000 Q4 2014 15,000 34,000 84,000 49,000 133,000 787,000 738,000 654,000
Source: Labour Force Survey. Time series for the period: Oct-Dec 2009 to Oct-Dec 2014.
Note: Q1 relates to the months January-March, Q2 to April –June, Q3 to July-September and Q4 to October-December
c. Regional NEET 16 year
olds 17 year olds 18 year olds 16-17 year olds 16-18 year olds 16-24 year olds 18-24 year olds 19-24 year olds South East London
East of England
South West
West Midlands
East Midlands
Yorks & Humber
North West
North East
Page
13
of
16
Table 2: Number Not in Education or Training (NET): England
d. NET Participation SFR series 16 year olds 17 year olds 18 year olds 16-17 year olds 16-18 year olds 16-24 year olds 18-24 year olds 19-24 year olds
End 2000 82,700 116,300 222,400 198,900 421,300 End 2001 88,300 131,500 235,200 219,800 455,100 End 2002 80,100 135,200 242,300 215,300 457,600 End 2003 75,700 125,700 251,200 201,500 452,700 End 2004 74,500 124,200 245,500 198,700 444,100 End 2005 68,300 122,300 241,000 190,500 431,500 End 2006 67,100 117,400 250,200 184,600 434,800 End 2007 66,700 116,000 245,600 182,700 428,300 End 2008 52,800 114,000 253,000 166,800 419,800 End 2009 44,800 87,400 247,200 132,200 379,400 End 2010 42,900 81,600 230,300 124,500 354,700 End 2011 41,900 80,400 205,200 122,300 327,500 End 2012 44,700 72,000 205,900 116,700 322,500 End 2013 28,700 69,200 183,400 97,900 281,200
Source: Labour Force Survey and Admin Data. Period: End 2000 to End 2013
e. NET Quarterly LFS series* 16 year olds 17 year olds 18 year olds 16-17 year olds 16-18 year olds 16-24 year olds 18-24 year olds 19-24 year olds
Q4 2009 36,000 82,000 213,000 118,000 331,000 2,667,000 2,549,000 2,336,000 Q1 2010 40,000 98,000 220,000 138,000 358,000 2,687,000 2,549,000 2,328,000 Q2 2010 43,000 109,000 223,000 152,000 374,000 2,703,000 2,552,000 2,329,000 Q3 2010 54,000 181,000 265,000 235,000 500,000 3,064,000 2,829,000 2,564,000 Q4 2010 36,000 63,000 204,000 99,000 303,000 2,733,000 2,633,000 2,429,000 Q1 2011 45,000 75,000 208,000 119,000 327,000 2,738,000 2,618,000 2,411,000 Q2 2011 55,000 101,000 222,000 156,000 378,000 2,941,000 2,786,000 2,563,000 Q3 2011 69,000 155,000 233,000 224,000 457,000 3,126,000 2,902,000 2,669,000 Q4 2011 40,000 75,000 183,000 115,000 298,000 2,711,000 2,596,000 2,413,000 Q1 2012 46,000 81,000 187,000 127,000 314,000 2,697,000 2,570,000 2,383,000 Q2 2012 52,000 98,000 216,000 150,000 366,000 2,880,000 2,730,000 2,514,000 Q3 2012 47,000 132,000 226,000 179,000 405,000 3,035,000 2,856,000 2,630,000 Q4 2012 30,000 55,000 195,000 85,000 280,000 2,720,000 2,635,000 2,440,000 Q1 2013 30,000 60,000 191,000 90,000 281,000 2,668,000 2,578,000 2,387,000 Q2 2013 36,000 88,000 200,000 123,000 324,000 2,792,000 2,668,000 2,468,000 Q3 2013 43,000 149,000 221,000 191,000 412,000 3,066,000 2,875,000 2,653,000 Q4 2013 24,000 49,000 193,000 73,000 266,000 2,683,000 2,610,000 2,417,000 Q1 2014 23,000 49,000 178,000 72,000 251,000 2,595,000 2,523,000 2,344,000 Q2 2014 29,000 78,000 195,000 107,000 302,000 2,779,000 2,672,000 2,477,000 Q3 2014 37,000 132,000 220,000 169,000 389,000 3,008,000 2,839,000 2,620,000 Q4 2014 18,000 54,000 176,000 71,000 247,000 2,593,000 2,522,000 2,346,000
Source: Labour Force Survey. Time series for the period: Oct-Dec 2009 to Oct-Dec 2014.
Page
14
of
16
Table 3: Percentage Not in Education, Employment or Training (NEET): England
a. NEET Participation SFR series 16 year olds 17 year olds 18 year olds 16-17 year olds 16-18 year olds 16-24 year olds 18-24 year olds 19-24 year olds
End 2000 6.7% 7.4% 12.2% 7.0% 8.7%
End 2001 7.4% 9.1% 12.2% 8.2% 9.5%
End 2002 7.6% 9.0% 12.2% 8.3% 9.6%
End 2003 7.0% 7.5% 12.4% 7.2% 9.0%
End 2004 6.9% 8.3% 12.3% 7.6% 9.2%
End 2005 7.4% 9.5% 13.2% 8.5% 10.0%
End 2006 6.7% 8.9% 13.5% 7.8% 9.7%
End 2007 6.1% 8.8% 13.8% 7.4% 9.5%
End 2008 5.8% 9.1% 16.2% 7.5% 10.4%
End 2009 5.5% 7.8% 16.5% 6.7% 10.0%
End 2010 5.1% 8.2% 13.8% 6.6% 9.1%
End 2011 5.4% 8.4% 15.2% 6.9% 9.7%
End 2012 5.8% 7.1% 14.5% 6.5% 9.2%
End 2013 4.0% 6.1% 12.5% 5.1% 7.6%
Source: Labour Force Survey and Admin Data, Period: End 2000 to End 2013
b. NEET Quarterly LFS series* 16 year olds 17 year olds 18 year olds 16-17 year olds 16-18 year olds 16-24 year olds 18-24 year olds 19-24 year olds Q4 2009 4.5% 7.4% 15.3% 6.0% 9.1% 14.8% 17.2% 17.5% Q1 2010 5.1% 8.6% 16.8% 6.9% 10.2% 15.2% 17.6% 17.7% Q2 2010 5.2% 10.1% 15.2% 7.8% 10.3% 14.4% 16.3% 16.5% Q3 2010 6.2% 15.0% 19.1% 10.8% 13.5% 17.1% 18.9% 18.9% Q4 2010 4.3% 6.6% 13.9% 5.4% 8.3% 15.6% 18.3% 19.0% Q1 2011 5.3% 8.0% 12.4% 6.6% 8.5% 15.3% 17.7% 18.6% Q2 2011 6.5% 9.1% 14.6% 7.8% 10.1% 16.3% 18.6% 19.3% Q3 2011 7.7% 15.5% 18.4% 11.6% 13.9% 19.4% 21.5% 22.0% Q4 2011 5.1% 8.1% 14.9% 6.6% 9.4% 16.0% 18.5% 19.0% Q1 2012 6.2% 9.0% 13.8% 7.6% 9.7% 15.8% 18.0% 18.7% Q2 2012 5.8% 9.7% 15.9% 7.8% 10.6% 16.2% 18.4% 18.7% Q3 2012 4.3% 12.7% 14.9% 8.6% 10.7% 17.2% 19.4% 20.1% Q4 2012 3.6% 5.3% 14.5% 4.5% 8.0% 14.9% 17.6% 18.1% Q1 2013 4.6% 6.1% 13.8% 5.4% 8.3% 15.0% 17.6% 18.1% Q2 2013 5.0% 8.1% 14.4% 6.7% 9.2% 15.4% 17.7% 18.2% Q3 2013 5.4% 14.5% 16.3% 10.1% 12.2% 17.6% 19.5% 20.0% Q4 2013 3.2% 4.9% 14.3% 4.1% 7.6% 14.1% 16.7% 17.1% Q1 2014 3.2% 4.6% 12.6% 3.8% 6.8% 13.0% 15.4% 15.9% Q2 2014 3.8% 7.4% 13.0% 5.6% 8.1% 13.5% 15.6% 16.0% Q3 2014 4.8% 11.5% 15.2% 8.2% 10.6% 15.4% 17.3% 17.6% Q4 2014 2.5% 5.2% 13.0% 3.9% 7.0% 13.1% 15.5% 15.9%
Source: Labour Force Survey. Time series for the period: Oct-Dec 2009 to Oct-Dec 2014.
Note: Q1 relates to the months January-March, Q2 to April –June, Q3 to July-September and Q4 to October-December
c. Regional NEET 16 year
olds 17 year olds 18 year olds 16-17 year olds 16-18 year olds 16-24 year olds 18-24 year olds 19-24 year olds
South East 2.4% 4.7% 8.4% 3.5% 5.1%
London 1.5% 3.2% 7.2% 2.4% 3.8%
East of England 2.5% 4.9% 8.1% 3.7% 5.1%
South West 2.3% 5.0% 8.7% 3.6% 5.2%
West Midlands 2.7% 6.0% 9.7% 4.3% 6.0%
East Midlands 2.3% 4.9% 7.3% 3.6% 4.8%
Yorks & Humber 2.7% 5.6% 8.8% 4.2% 5.7%
North West 2.8% 5.2% 9.0% 4.0% 5.6%
North East 3.3% 6.8% 13.0% 5.0% 7.6%
Page
15
of
16
Table 4: Percentage Not in Education or Training (NET): England
d. NET Participation SFR series 16 year olds 17 year olds 18 year olds 16-17 year olds 16-18 year olds 16-24 year olds 18-24 year olds 19-24 year olds
End 2000 13.6% 19.4% 38.0% 16.5% 23.5%
End 2001 14.0% 21.5% 39.1% 17.7% 24.7%
End 2002 12.8% 21.3% 39.2% 17.1% 24.3%
End 2003 11.9% 19.9% 39.0% 15.9% 23.7%
End 2004 11.4% 19.4% 38.4% 15.3% 22.9%
End 2005 10.5% 18.5% 37.1% 14.6% 22.0%
End 2006 10.1% 17.9% 37.4% 14.0% 21.9%
End 2007 9.9% 17.3% 37.0% 13.6% 21.3%
End 2008 7.9% 16.7% 37.2% 12.3% 20.6%
End 2009 6.8% 12.9% 35.6% 9.9% 18.7%
End 2010 6.5% 12.3% 33.5% 9.4% 17.7%
End 2011 6.5% 12.1% 30.6% 9.3% 16.5%
End 2012 6.9% 11.1% 30.7% 9.0% 16.4%
End 2013 4.4% 10.6% 27.9% 7.5% 14.4%
Source: Labour Force Survey and Admin Data, Period: End 2000 to End 2013 e. NET Quarterly LFS
series* 16 year olds 17 year olds 18 year olds 16-17 year olds 16-18 year olds 16-24 year olds 18-24 year olds 19-24 year olds
Q4 2009 5.8% 12.3% 33.3% 9.1% 17.2% 44.8% 54.6% 58.0% Q1 2010 6.4% 14.4% 34.7% 10.6% 18.4% 44.9% 54.5% 57.6% Q2 2010 6.9% 16.1% 33.3% 11.7% 19.1% 45.2% 54.4% 57.9% Q3 2010 8.6% 26.7% 40.8% 18.0% 25.6% 51.4% 60.7% 64.0% Q4 2010 5.5% 10.1% 31.0% 7.8% 15.7% 45.5% 55.8% 59.8% Q1 2011 6.7% 11.8% 31.4% 9.2% 16.7% 45.4% 55.3% 59.2% Q2 2011 8.4% 16.0% 33.8% 12.1% 19.5% 48.6% 58.5% 62.4% Q3 2011 10.6% 23.8% 34.9% 17.2% 23.2% 51.4% 60.6% 64.8% Q4 2011 6.4% 11.7% 28.6% 9.1% 15.6% 44.8% 54.3% 58.3% Q1 2012 7.3% 12.5% 29.0% 9.9% 16.3% 44.6% 53.9% 57.9% Q2 2012 8.3% 15.5% 33.0% 11.9% 19.1% 47.4% 56.8% 60.5% Q3 2012 7.7% 20.6% 35.4% 14.3% 21.4% 50.2% 59.6% 63.3% Q4 2012 4.9% 8.7% 29.4% 6.8% 14.7% 45.2% 55.2% 59.3% Q1 2013 5.1% 8.8% 29.3% 7.1% 14.7% 44.1% 53.8% 57.7% Q2 2013 5.9% 12.8% 32.6% 9.5% 17.0% 46.0% 55.8% 59.2% Q3 2013 7.2% 23.2% 34.1% 15.4% 21.9% 50.5% 59.5% 63.5% Q4 2013 3.7% 8.1% 29.6% 5.8% 14.0% 44.5% 54.6% 58.6% Q1 2014 3.5% 8.2% 28.1% 5.8% 13.3% 43.4% 53.3% 57.2% Q2 2014 4.7% 12.5% 30.6% 8.6% 16.1% 46.3% 56.1% 60.0% Q3 2014 5.9% 21.0% 33.7% 13.5% 20.4% 49.7% 59.2% 63.2% Q4 2014 2.9% 8.3% 27.1% 5.7% 13.0% 43.0% 52.8% 56.9%
Source: Labour Force Survey, Period: Oct-Dec 2009 to Oct-Dec 2014 time series
Note: Q1 relates to the months January-March, Q2 to April –June, Q3 to July-September and Q4 to October-December
Page
16
of
16
© Crown copyright 2015.
You may re-use this information (excluding logos) free of charge in any format or medium, under the terms of the Open Government Licence. To view this licence, visit
Open Government Licence or e-mail: psi@nationalarchives.gsi.gov.uk.
Where we have identified any third party copyright information you will need to obtain permission from the copyright holders concerned.
Any enquiries regarding this publication should be sent to us at: