i | P a g e
University of Southern Queensland
Faculty of Engineering and Surveying
VOLTAGE CONTROL IN MICRO-GRIDS
A dissertation submitted by
Mr. ORUGANTI VARA PRASAD YADAV
In fulfilment of the requirements of
ENG8412 Research Project
towards the degree of
MASTERS IN ELECTRICAL AND ELECTRONICS
ENGINEERING
ii | P a g e
ABSTRACT
It is estimated that around 400 million people have no electricity and will not have access
to electrical power resources in the near future. This precludes improvements in living
standards and business opportunities as without a stable and reliable electrical power
source, connectivity to the global information network is not possible. Similarly without
electrical power, mechanization for water supply and other agricultural business
opportunities, medical resources other modern resources such as refrigeration are not
possible. In such small communities, if access to the available energy is not equitable, then
this can create ill-will that breaks down the traditional co-operative nature that is needed for
success in rural India.
The main aim of the project is to investigate the modelling system and strategy for an
Indian stand-alone village based micro-grid and its voltage stability. This is to provide the
local people’s electricity needs in the rural areas of that particular state. Micro-grid
networks are equipped for producing sufficient energy to better the life ambitions of a small
number of connected clients. The project also aims at approaching the challenge of rural
electrification through the use of micro-grids within the local generation source.
The proposed DC micro-grid has been modelled and simulated using the Homer Energy
Software. This Homer energy software performs the various tasks in an accurate manner by
choosing the best possible alternatives and sorting out them optimally. The results showed
that the renewable energy sources would be feasible option when compared with
conventional energy sources for distributing the power in rural parts of India. Finally the
various capital costs have been presented for achieving the best economic viability of the
proposed DC micro-grid system.
iii | P a g e
DISCLAIMER PAGE
University of Southern Queensland
Faculty of Health, Engineering and Science
ENG8411/ENG8412 Masters Dissertation Project
Limitations of Use
The Council of the University of Southern Queensland, its Faculty of Health, Engineering
and Science, and the staff of the University of Southern Queensland, do not accept any
responsibility for the truth, accuracy or completeness of material contained within or
associated with this dissertation.
Persons using all or any part of this material do so at their own risk, and not at the risk of
the Council of the University of Southern Queensland, its Faculty of Health, Engineering
and Science or the staff of the University of Southern Queensland.
This dissertation reports an educational exercise and has no purpose or validity beyond this
exercise. The sole purpose of this dissertation project is to contribute to the overall
education within the student's chosen degree program. This document, the associated
hardware, software, drawings, and other material set out in the associated appendices
should not be used for any other purpose: if they are so used, it is entirely at the risk of the
iv | P a g e
CANDIDATE’S CERTIFICATION
I certify that the ideas, designs and experimental work, results, analysis and conclusions set
out in this dissertation are entirely my own efforts, except where otherwise indicated and
acknowledged.
I further certify that the work is original and has not been previously submitted for
assessment in any other course or institution, except where specifically stated.
ORUGANTI VARA PRASAD YADAV
STUDENT NUMBER: 0061046980
( )
v | P a g e
ACKNOWLEDGEMENTS
I hereby express my gratitude to my family members for their help and patience. This
research project was carried out under the principle supervision of Dr. Andreas Helwig who
vi | P a g e
TABLE OF CONTENTS
Contents
Page
Abstract ii
Limitations of Use iii
Certification iv
Acknowledgements v
List of Figures xv
List of Tables xxi
Nomenclature and Acronyms xxii
CHAPTER 1 – INTRODUCTION 24
1.1 outline of the study 24
1.1.1 Chapter-1 Overview 24
1.1.2 Project introduction 24
1.1.3 Chapter-2 Overview 24
1.1.4 Chapter-3 Overview 25
1.1.5 Chapter-4 Overview 25
1.1.6 Chapter-5 Overview 25
1.1.7 Chapter-6 Overview 25
1.2 Introduction and background of the study 26
1.2.1 Emerging of micro-grids 27
1.2.2 India’s electricity production capacity 28
1.2.3 Power shortages and outages 29
1.2.3.1 Generation of Power 30
vii | P a g e
1.2.3.2 Transmission 32
1.2.3.3 Distribution 33
1.3 The problem 35
1.3.1 Use of Micro-grids 36
1.3.2 Electrification rater 36
1.3.3 Rural Settlements 38
1.3.4 Decentralized power systems 39
1.4 Research objectives 41
1.5 Chapter summary 42
CHAPTER 2 – LITERATURE REVIEW 43
2.1 Introduction 41
2.2 Micro-grids 43
2.2.1 Grid connections 46
2.3 Renewable energy scenario in India 47
2.3.1 Role of Renewable energy 47
2.3.1.1 Wind energy in India 48
2.3.1.2 Solar energy in India 49
2.3.1.3 Bio-mass energy in India 49
2.4 Global status of Micro-grids 51
2.4.1 Benefits of Rural settings 52
2.4.1.1 Economic Benefits 53
2.4.1.2 Social Benefits 54
2.4.1.3 Health Benefits 55
2.4.1.4 Ecological Benefits 56
2.5 Micro-grids Performance 56
viii | P a g e
2.5.1.1 Operations and Maintenance 59
2.5.1.2 Customer Usage 60
2.5.2 Performance Best Practice 61
2.6 Voltage Control Models 63
2.7 Project Justification 66
2.8 Summary 67
CHAPTER-3 RESEARCH DESIGN AND METHODOLOGY 69
3.1 Introduction 69
3.2 Project design 70
3.3 Methodology 72
3.3.1 Introduction to HOMER ENERGY 72
3.3.2 Load schedule considered for the proposed micro-grid design 73
3.3.3 Implementation of HOMER Simulation Interface 75
3.3.4 Model inputs to the HOMER 77
3.3.4.1 Load Input 77
3.3.4.2 Photo-voltaic Array Model Input 78
3.3.4.3 Wind system 79
3.3.4.4 Generator Input 80
3.3.4.5 Batteries Input 81
3.3.4.6 Converters 82
3.3.5 Optimization 83
3.3.6 Sensitivity analysis 83
ix | P a g e
CHAPTER-4 DISPATCH OF ENERGY BETWEEN THE CUSTOMERS 85
4.1 Introduction 85
4.1.1 Flow chart for equitability dispatch of energy between the customers 86
4.2 Implementation of Flow chart logic in PLC Programming by using 90
Zelio Software
4.2.1 Introduction to Zelio Software 90
4.2.2 Input Parameters used in the programming 91
4.2.3 Physical Outputs 92
4.2.4 Configurations used in programming 93
4.2.5 TIME PROGRAMMER (Daily, Weekly and Yearly Programmer) 94
4.3 Summary 96
CHAPTER-5 RESULTS AND DISCUSSIONS 97
5.1 Introduction 97
5.2 Optimization Results 98
5.2.1 Discussions for Optimization results 103
5.3 Comparison of Government Capital Subsidy and Cost of Energy (COE) 104
for Various Biomass Resources
5.3.1 Introduction 104
5.3.1.1 Government capital cost versus Cost of Energy (C0E) for the 104
bio-mass resource 0.1t/d
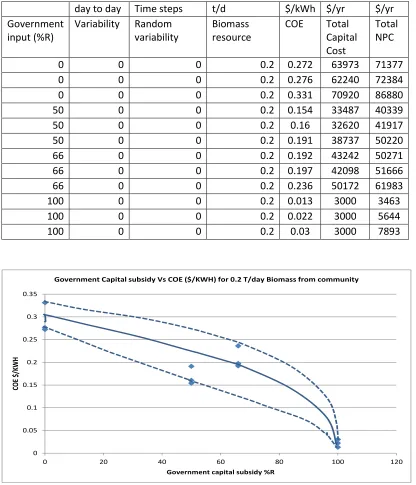
5.3.1.2 Government capital cost versus Cost of Energy (COE) 106
for the biomass resource 0.2t/d
5.3.1.3 Government capital cost versus Cost of Energy (COE) 107
x | P a g e
5.3.2 Discussion of results for comparison of government capital subsidy 108
versus cost of energy (COE)
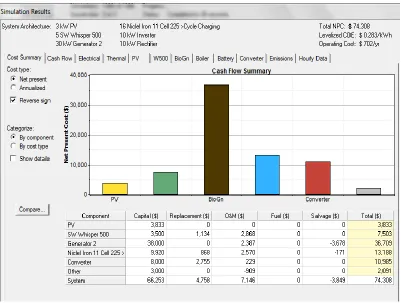
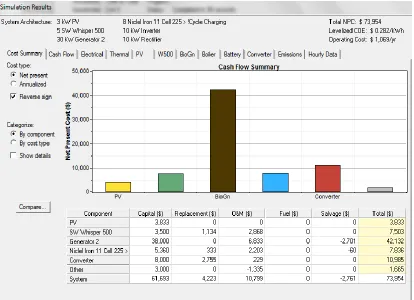
5.4 Cost Summary Analysis of Various Resources 109
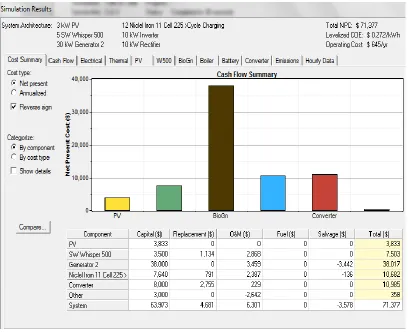
5.4.1 Discussion of results 111
5.4.1.1 Interpretation of results 112
5.5 Analysis of Battery life 116
5.5.1 Discussions for life cycle of the Nickel iron battery 118
5.6 Analysis of Monthly Electrical Production 119
5.6.1 Interpretation of results 122
5.7 Sensitivity Analysis results 123
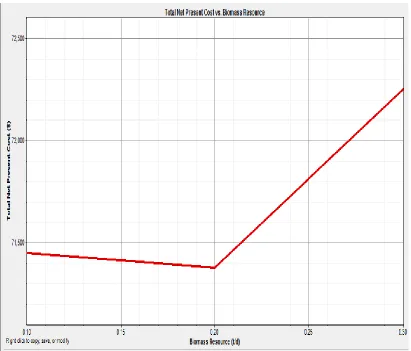
5.7.1 Comparison of Total Net Present Cost (NPC) for various 124
biomass resources with change in wind speed
5.7.1.1 Discussion of results 126
5.7.3 Comparison of Cost of Energy for various biomass resources 127
with change in the speed of wind direction
xi | P a g e
CHAPTER-6 CONCLUSIONS AND FUTURE SCOPE OF WORK 132
6.1 Conclusions 132
6.2 Future Scope of Work 133
6.3 Recommendations 134
List of References 135
Appendix A - Project Specification 140
Appendix B - Resources Considered for the HOMER 141
B.1 Solar resource 141
B.2 Wind resource 142
B.3 Biomass resource 143
Appendix C - Optimization Results 144
C.1 Full Capital Costs 0% variability for day to day with 144 0% random variability for Time-steps.
(Biomass resource = 0.2t/d)
C.2 Full Capital Costs 0% variability for day to day 145
with 0% random variability for Time-steps.
(Biomass resource = 0.3t/d)
C.3 Full Capital Costs 5% variability for day to day 146
with 10% random variability for Time-steps.
xii | P a g e
C.4 Full Capital Costs 5% variability for day to day 147
with 10% random variability for Time-steps.
(Biomass resource =0.2t/d)
C.5 Full Capital Costs 5% variability for day to day 148
with 10% random variability for Time-steps.
(Biomass resource =0.3t/d)
C.6 Half subsidized Capital Costs 0% variability for day to day 149
with 0% random variability for Time-steps.
(Biomass resource = 0.2t/d)
C.7 Half subsidized Capital Costs 0% variability for day to day 150
with 0% random variability for Time-steps.
(Biomass resource = 0.3t/d)
C.8 Half subsidized Capital Costs 5% variability for day to day 151
with 10% random variability for Time-steps.
(Biomass resource =0.1t/d)
C.9 Half subsidized Capital Costs 5% variability for day to day 152
with 10% random variability for Time-steps.
(Biomass resource =0.2t/d)
C.10 Half subsidized Capital Costs 5% variability for day to day 153
with 10% random variability for Time-steps.
(Biomass resource =0.3t/d)
C.11 66% subsidized Capital Costs 0% variability for day to day 154
with 0% random variability for Time-steps.
xiii | P a g e
C.12 66% subsidized Capital Costs 0% variability for day to day 155
with 0% random variability for Time-steps.
(Biomass resource= 0.3t/d)
C.13 66% subsidized Capital Costs 5% variability for day to day 156
with 10% random variability for Time-steps.
(Biomass resource= 0.1t/d)
C.14 66% subsidized Capital Costs 5% variability for day to day 157
with 10% random variability for Time-steps.
(Biomass resource= 0.2t/d)
C.15 66% subsidized Capital Costs 5% variability for day to day 158
with 10% random variability for Time-steps.
(Biomass resource= 0.3t/d)
C.16 Fully Government subsidized Capital Costs 0% variability 159
for day to day with 0% random variability for Time-steps.
(Biomass resource= 0.2t/d)
C.17 Fully Government subsidized Capital Costs 0% variability 160
for day to day with 0% random variability for Time-steps.
(Biomass resource = 0.3t/d)
C.18 Fully Government subsidized Capital Costs 5% variability 161
for day to day with 10% random variability for Time-steps.
(Biomass resource = 0.1t/d)
C.19 Fully Government subsidized Capital Costs 5% variability 162
for day to day with 10% random variability for Time-steps.
xiv | P a g e
C.20 Fully Government subsidized Capital Costs 5% variability 163
for day to day with 10% random variability for Time-steps.
(Biomass resource = 0.3t/d)
Appendix D - PLC programming using Zelio Software 164
D.1 SR3B262BD CPU Module 164
D.2 Configurations used in the programming 166
D.3 Zelio logic program 168
xv | P a g e
LIST OF FIGURES
1.2.1 Growth of Micro-grids 27
1.2.2 Installed Capacity of Power Utilities in Top Ten Indian States 28
1.2.3.1 Comparison of Electricity by Various Energy Sources 30
1.2.3.1.1 Power Generation Sources 31
1.2.3.2 Existing Transmission Lines in India 32
1.2.3.3 Cost of Power Supply (Paisa/kWh) 34
1.3 Carbon emission gases released by various energy sources 35
1.3.2 Status of electrification in India 37
1.3.4 Sources of Distributed Generation 39
2.2 General Layout of Micro-grid 45
2.2.1 Cost of grid connections between the existing grids related 46
to the distance
2.4 Micro-grid capacity for different regions 51
3.2 Proposed DC Micro-grid outline 70
3.3.3 Equipment considered for the HOMER interface 75
3.3.4.1 Load input 77
3.3.4.2 Photovoltaic solar input 78
3.3.4.3 Wind system input 79
3.3.4.4 Generator input 80
3.3.4.5 Batteries input 81
3.3.4.6 Converter input 82
4.1 Customer node inverter and load arrangement for DC micro-grid 85
xvi | P a g e
4.1.1b Flow chart for load sharing of energy between the customers 88
during the day time
4.1.1c Flow chart for load sharing of energy between the customers 89
during the night time
4.2.2 Physical Inputs used in the PLC 90
4.2.3 Digital outputs for each customer 92
4.2.5a Daily, weekly and yearly programmer 94
4.2.5b Daily, weekly and yearly programmer 95
5.2b Optimization results for full Capital Costs 99
0% variability for day to day with 0% random
variability for Time-steps. (Biomass resource = 0.1t/d)
5.2c Optimization results for half subsidized Capital Costs 100
0% variability for day to day with 0% random variability
for Time-steps. (Biomass resource = 0.1t/d)
5.2d Optimization results for 66% subsidized Capital Costs 101
for day to day with 0% variability and 0% random variability
for Time-steps. (Biomass resource= 0.1t/d)
5.2e Optimization results for fully Government subsidized 102
Capital Costs 0% variability for day to day with 0%
random variability for Time-steps. (Biomass resource = 0.1t/d)
5.3.1.1 Comparison of Government Capital Subsidy versus COE 105
for 0.1t/d biomass resource
5.3.1.2 Comparison of Government Capital Subsidy versus COE 106
xvii | P a g e
5.3.1.3 Comparison of Government Capital Subsidy versus COE 107
for 0.3t/d biomass resource
5.4a Cost summary for the all resources by considering the 109
bio-mass resource as 0.1t/d
5.4b Cost summary for the all resources by considering the 110
bio-mass resource as 0.2t/d
5.4c Cost summary for the all resources by considering the 111
bio-mass resource as 0.3t/d
5.4.1.1a Total Net Present Cost ($) versus Biomass resources (t/d) 113
5.4.1.1b Cost of Energy ($/kWh) versus Biomass resources (t/d) 114
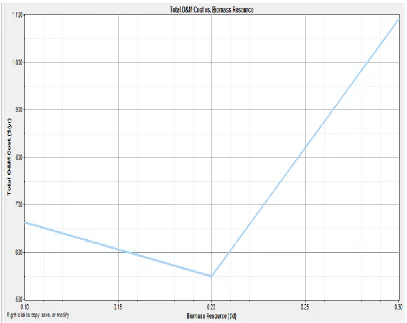
5.4.1.1c Total O&M Cost ($/yr) versus Biomass resources (t/d) 115
5.5a Nickel Iron Battery Life for the biomass resource 0.1t/d 116
5.5b Nickel Iron Battery Life for the biomass resource 0.2t/d 117
5.5c Nickel Iron Battery Life for the biomass resource 0.3t/d 118
5.5.1 Comparison of battery life for various biomass resources 119
5.6a Monthly Electric Production by considering the resources 120
as wind turbine and generator
5.6b Monthly Electric Production by considering the all sources 121
5.6c Monthly Electric Production by considering PV array 122
and generator as sources
5.7.1a Total Net Present Cost ($) versus Wind speed (m/s) 124
5.7.1b Total Net Present Cost ($) versus Wind speed (m/s) 125
5.7.1c Total Net Present Cost ($) versus Wind speed (m/s) 126
5.7.3a Cost of Energy versus Wind speed for biomass resource 0.1t/d 128
5.7.3b Cost of Energy versus Wind speed for biomass resource 0.2t/d 129
xviii | P a g e
B.1 Solar resource input 141
B.2 Wind resource input 142
B.3 Biomass resource input 143
C.1 Optimization results for Full Capital Costs 144
0% variability for day to day with 0% random variability
for Time-steps. (Biomass resource = 0.2t/d)
C.2 Optimization results for Full Capital Costs 145
0% variability for day to day with 0% random variability
for Time-steps. (Biomass resource = 0.3t/d)
C.3 Optimization results for Full Capital Costs 146
5% variability for day to day with 10% random variability
for Time-steps. (Biomass resource = 0.1t/d)
C.4 Optimization results for Full Capital Costs 147
5% variability for day to day with 10% random variability
for Time-steps. (Biomass resource = 0.2t/d)
C.5 Optimization results for full Capital Costs 148
5% variability for day to day with 10% random variability
for Time-steps. (Biomass resource = 0.3t/d)
C.6 Optimization results for half subsidized Capital Costs 149
0% variability for day to day with 0% random variability
for Time-steps. (Biomass resource = 0.2t/d)
C.7 Optimization results for half subsidized Capital Costs 150
0% variability for day to day with 0% random variability
xix | P a g e
C.8 Optimization result for half subsidized Capital Costs 151
5% variability for day to day with 10% random variability
for Time-steps. (Biomass resource = 0.1t/d)
C.9 Optimization result for half subsidized Capital Costs 152
5% variability for day to day with 10% random variability
for Time-steps. (Biomass resource = 0.2t/d)
C.10 Optimization result for half subsidized Capital Costs 153
5% variability for day to day with 10% random variability
for Time-steps. (Biomass resource = 0.3t/d)
C.11 Optimization result for 66% subsidized Capital Costs 154
0% variability for day to day with 0% random variability
for Time-steps. (Biomass resource= 0.2t/d)
C.12 Optimization result for 66% subsidized Capital Costs 155
0% variability for day to day with 0% random variability
for Time-steps. (Biomass resource= 0.3t/d)
C.13 66% subsidized Capital Costs 5% variability for 156
day to day with 10% random variability for Time-steps.
(Biomass resource= 0.1t/d)
C.14 66% subsidized Capital Costs 5% variability for 157
day to day with 10% random variability for Time-steps.
(Biomass resource= 0.2t/d)
C.15 66% subsidized Capital Costs 5% variability for 158
day to day with 10% random variability for Time-steps.
xx | P a g e
C.16 Optimization result for fully Government subsidized 159
Capital Costs 0% variability for day to day with 0%
random variability for Time-steps. (Biomass resource = 0.2t/d)
C.17 Optimization result for fully Government subsidized 160
Capital Costs 0% variability for day to day with 0%
random variability for Time-steps. (Biomass resource = 0.3t/d)
C.18 Optimization result for Fully Government subsidized 161
Capital Costs 5% variability for day to day with 10% random variability
for Time-steps. (Biomass resource = 0.1t/d)
C.19 Optimization result for Fully Government subsidized 162
Capital Costs 5% variability for day to day with 10% random variability
for Time-steps. (Biomass resource = 0.2t/d)
C.20 Optimization result for Fully Government subsidized 163
Capital Costs 5% variability for day to day with 10% random variability
for Time-steps. (Biomass resource = 0.3t/d)
D.1 SR3B262BD CPU Module 164
D.2a Configurations used in the programming 166
D.2b Configurations used in the programming 167
D.3a Zelio logic for the load sharing of energy between the customers 168
D.3b Zelio logic for the load sharing of energy between the customers 169
xxi | P a g e
LIST OF TABLES
1.3.2 Source of lightning for Indian households 27
2.3.1.1 Wind power potential across nine states of India 37
2.3.1.3 Generation of power capacity (MW) through grid connected
renewable energy sources 39
3.3.2a Typical load schedule considered during the day time 61
3.3.2b Coincidental night schedule 62
3.3.3 Details of the capital, replacement and O&M costs 64
considered in the proposed scheme
4.2.3 Load limit for each customer in a day
5.3.1.1 Results showing various costs for the biomass resource 0.1t/d 102
5.3.1.2 Results showing various costs for the biomass resource 0.2t/d 104
5.3.1.3 Results showing various costs for the biomass resource 0.3t/d 105
5.4.1.1 Cost summary for various biomass resources 113
5.6.1 Comparison of excess electricity produced by considering the 121
various resources
5.7.2 Total Net Present Cost versus Wind Speed versus wind speed 125
for different biomass resources
5.7.4 Comparison of Cost of Energy versus wind speed for different 129
xxii | P a g e
NOMENCLATURE AND ACRONYMS
AC ALTERNATING CURRENT
CB CIRCUIT BREAKER
CEA CENTRAL ELECTRICITY AUTHORITY
COE COST OF ENERGY
DC DIRECT CURRENT
DG DISTRIBUTED GENERATION
DDG DISTRIBUTED DECENTRALIZED DISTRIBUTION
GDP GROSS DOMESTIC PRODUCT
GW GIGA WATTS
HV HIGH VOLTAGE
HFAC HIGH GREQUENCY ALTERNATING CURRENT
IEA INDIAN ELECTRICITY AUTHORITY
IEGC INDIA’S ELECTRICITY GRID CODE
JNNSM JAWAHARLAL NEHRU NATURAL SOLAR MISSION
KV KILO VOLTS
KWh KILO WATT HOUR
LV LOW VOLTAGE
LPG LIQUIFIED PETROLEUM GAS
MCCB MOLDED CASE CIRCUIT BREAKER
MG’S MICRO-GRIDS
MNRE MINISTRY OF NEW AND RENEWABLE ENERGY
xxiii | P a g e
O&M OPERATIONAL AND MAINTAINENANCE COST
PV PHOTO VOLTAIC ARRAYS
PLC PROGRAMABLE LOGIC CONTROLLER
RE RENEWABLE ENERGY
RGGVY RAJIV GANDHI GRAMEEN VIDYUTIKARAN YOJANA
SEB STATE ELECTRICITY BOARD
UNDP UNITED NATIONAL DEVELOPMENT PROGRAME
- 24 - | P a g e
CHAPTER-1
INTRODUCTION
1.1
Outline of the study
1.1.1 Chapter 1 Overview
This chapter provides the general outlook of the project by detailing its background, stating
the main study objectives and outlining the problem statement. The use of micro-grids as
alternatives for rural electrification is also introduced in this chapter.
1.1.2 Project Introduction
Rural electrification is one of the best alternatives for empowering the underprivileged
population in India as well as in other parts of the world. The main aim of the project is to
examine how micro-grids’ use in rural India may be successful through the implementation
of the proposed modeling system. Specifically, the modeling system and strategy will be
scrutinized to ascertain whether the proposed Indian stand-alone village project is viable
and has its voltage stable micro-grid based (LV is defined as less than 1KV DC).
1.1.3 Chapter 2 Overview
Chapter 2 is the literature review section of the report. This chapter covers the following
areas:
Introduction to micro-grids.
Current status of rural electrification in India and the use of micro-grids.
Benefits of micro-grid systems for rural households.
Performance related issues of micro-grid systems.
Voltage control techniques commonly used in existing micro-grid systems.
Justification for the project.
25 | P a g e 1.1.4 Chapter 3 Overview
Chapter 3 discusses the design of the chosen micro-grid system and illustrates how it will
work in order to ensure that there is voltage stability and efficiency of power supply to rural
areas. Moreover, the main HOMER Energy Software testing tool has also been discussed in
the chapter with particular emphasis to three main processes such as simulation,
optimization and sensitivity analysis.
1.1.5 Chapter 4 Overview
Chapter 4 gives the information on how to share the load energy equally between the
customers during the day time and night time by making use of the flow chart. And finally
it outlines the implementation of the flow chart logic in PLC by using ZELIO software.
1.1.6 Chapter 5 Overview
Chapter 5 discusses the optimization results obtained by the HOMER energy modelling and
presents the best optimal solution. It gives the information about the comparison of cost of
energy versus government capital subsidy for the various biomass resources. This chapter
discusses the various capital costs, monthly average electrical production and battery life
involved in the proposed micro-grid design. Finally it concludes with sensitivity analysis
on various parameters for the optimal system.
1.1.7 Chapter 6 Overview
Chapter 6 discusses the conclusions derived from the project and outlines the
26 | P a g e
1.2
Introduction and background of the Study
Today a large number of individuals who live in provincial and agricultural regions either
have no electrical power at all, and have to depend principally on fossil fuel internal
combustion engines to power generators lightning. It is estimated that around 400 million
people have no electricity (IEA, 2012), and will not have access to electrical power
resources in the near future. This precludes improvements in living standards and business
opportunities as without a stable and reliable electrical power source, connectivity to the
global information network is not possible. Similarly without electrical power,
mechanization for water supply and other agricultural business opportunities, medical
resources other modern resources such as refrigeration are not possible.
Where fossil fuel internal combustion engine driven remote generation is use to supply
electrical power, it is becoming increasingly expensive to supply lighting and other
mechanical aids to improve provincial life-style. In many parts of the developing works,
micro-grid electrical supplies are now emerging. But due to the nature of these limited
power supplies that are often driven from renewable energy sources, there is very wide
fluctuation in the transmission of the electrical energy. Control issues on micro-grids
include over low-voltage, under voltage, and equitable shared access to the available
variable energy sources.
In India where micro-grid development is being implemented to supply electrical power to
remote communities with no access to the current three phase HV network; this can
become quite a problem, as competition for electrical energy sources by the small number
of clients. MG’s networks are equipped for producing sufficient energy to better the life
ambitions of a small number of connected clients. In such small communities, if access to
the available energy is not equitable, then this can create ill-will that breaks down the
27 | P a g e 1.2.1 Emerging of Micro-grids
The use of MG’s is progressively becoming the most effective method of generating
renewable energy in remote parts of the world where the use of conventional grids may not
be feasible (Camblong et al., 2009). The global energy sector has exhibited tremendous
growth in the 21st century. However, this growth is yet to be felt in many regions of the
globe that are in the category of rural areas. As a result, the energy demand has equally
grown despite the available energy resources remain almost the same. However, electricity
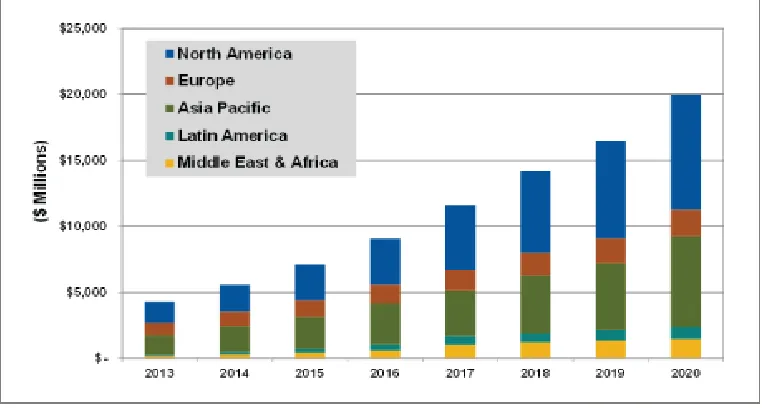
[image:27.612.121.502.248.454.2]remains one of the most important commodities for both commercial and household use.
Figure 1.2.1 Growth of Micro-grids
Source:(http://ensia.com/features/the-emerging-power-of-microgrids/)
From the figure1.2.1, it can be seen that micro-grids have been constantly increasing more
in North-America region followed by Europe, Asia Pacific, Latin America and Africa.
However, the developing nations like India continue grappling with a problem of sufficient
power distribution among its population. India, the country in focus of this project, has
been one of the most affected states in terms of power deficiency in its vast rural and even
urban population. Without enough power generation in the country, economic growth is
likely to be affected. Therefore, the availability of electricity is one of the most important
28 | P a g e 1.2.2 India’s Electricity Production Capacity
It is indicated that by 2012, India had a capacity of producing about 210 GW of electric
power. This is over 150 times of the capacity a company was able to produce back in the
mid-90s (Chaurey & Kandpal, 2010). The country can, therefore, be said to have made
important strides in the production of power to match its ever growing population, as well
as commercial production demands. In fact, there has been a gradual increase in the
production of electric power with the period ranging from 2011 to 2012 alone recording an
8% increase in generation of power through installed capacity. The government of India
together with other energy sector enterprises has joined hands to boost the country’s generating capacity. However, the country’s generating capacity may still have to be
further boosted to match current demands.
Figure1.2.2 Installed capacity of power utilities in top ten Indian States
Source:(India Census, 2011).
There are many factors associated with the growing demand of electric power in the
country. First, India is among the world’s fastest growing economies. It is also worthy of mention that the country’s population only comes second to that of China. The demand
generated by an ever expanding industrial sector as well as the number of households
stands to outdo the supply of power in the country. As a result of an outstripped supply of
power in the country, the reliability and quality of power raise a lot of concerns. This
means that the country’s power supply is currently overloaded resulting in frequent outages
29 | P a g e 1.2.3 Power shortages and outages
In India, the shortage of power during peak hours has been estimated to be about 11%. The
country’s frequent power shortages have been attributed to poor repair and maintenance
work within the national grid system. The Central Electricity Authority estimates daily
outage levels of about 30,000 Mega Watts (MW). As a result, the country’s power
consumption per capital still ranks lowly at 940 kilo watt-hour (kWh) (CEA, 2014).
Nevertheless, the demand for electricity in the country has continued to plummet even as
inefficiencies still exist in the country’s power generation and distribution system.
Moreover, power distribution companies in India still owe about 2 trillion rupees to
financial institutions, which has made it difficult for them to access additional financing
needed for expansion and rehabilitation of the aging national grid system (CEA, 2014). As
a result, the country’s electricity supply continues to be unreliable given the number of
unplanned shutdowns during peak hours when actual demand levels exceed installed
capacity.
Inefficiencies in the country’s power distribution system have also resulted in increased
tariffs. The costs of connection as well as the monthly power bills continue to rise in the
country effectively locking out low income earning households mostly living in rural areas.
Due to this, the transmission and distribution of power in the country have been affected in
most parts of the country.
This subsection looks at how under performance in the three components may have led to
30 | P a g e 1.2.3.1 Generation of Power
Firstly, the generation of power in the country has been facing numerous challenges with
frequent shortages of fuel. Fuel plays a crucial role for the generation of power in the
country, but the instabilities in the global oil production and supply markets have been
affected the stock levels in the country. The price of fuel also remains unstable given the
changing supply levels. Due to the challenges associated with costs, the private sector of
the country agreed for distributing the power by the use of fuel.
Figure 1.2.3.1 Comparison of electricity by the various energy sources
Source: (Author, Data obtained from CEA Annual Report 2012)
In 2011 – 2012, private sector participants contributed to about 58% of all electric
power produced in the country. Further, within the last five years, private sector in
India has contributed to about 48% of all power generated in the country. Therefore, the
role of the private sector cannot be underscored.
The government must continue to engage the private sector and even encourage more
participants on board to boost electric power generation capacity in the country. As per
the common practice globally, India relies on four main power generation sources to
feed its national grid.
31 | P a g e 1.2.3.1.1 Power Generation Sources
Considering the three main sources, thermal power generation sources account for
about two-thirds of all electric power produced (CEA Annual Report 2012) in the
country today which is about 57% (137,386 MW). This is followed by hydroelectric
sources of power generation that contribute about 39,291MW of electricity (19%). The
other categories include renewable source, which contribute about 12% (24,998 MW)
of electric power and lastly, nuclear power generation contributing about 2.3% of total
power supply (4780 MW).
Figure 1.2.3.1.1 Power generation sources
Source: (Author, with data from Monthly Reports CEA December 2012)
The thermal sources have large capacity for generating the electricity followed by
hydropower, renewable energy source and finally ended up with nuclear power as shown in
the figure 1.2.3.1.1. However, the country’s generation still remains unreliable if the level
of supply is anything to go by. For instance, if there is an additional capacity installed
within the country’s power generation process, it might effect on the demand side of the
load. This in turn affects the transmission of the generated power. Questions of
transmission efficiency still continue to be raised in the country’s energy sector.
Transmission is evidently on the supply side rather than on the demand side of power
generation.
57%
1% 9%
19% 2%
12%
32 | P a g e 1.2.3.2 Transmission
Without an effective transmission plan, the installed capacity may not be effectively
utilized as the country intends to boost its power production. There have been a lot of
challenges within the energy sector that hindered the engagement of other private sector
participants to invest in the absorption of all power sources to the national grid.
Secondly, a huge proportion of the country’s thermal power is generated throgtb ugh
coal plants. Coincidentally, India has a vast amount of coal deposits still unexploited.
However, it is alarming to note that the country’s coal industry has not matched up the
demand for coal in the thermal plants due to issues of inefficiencies (Lhendup, 2008).
In addition, there are policy issues as well as infrastructural development issues
attached to the frequent shortages.
Figure 1.2.3.2 Existing Transmission lines in India
Source: (Author, with data from Monthly Reports CEA December 2012)
Aside from overreliance on coal, this commodity is largely bulky and highly
non-renewable. Consequently, it raises the question of sustainability for future generations
as well as other environmental management issues. Generally, the country’s transmission process has been monopolized. The country’s Central Transmission Utility
and State Transmission Utility are the only participants charged with planning,
development and implementation of supply networks. Therefore, private sector has
33 | P a g e
However, the country is beginning to relax its laws to involve the private sector in
transmission of power. This has ensured the increase in competition and efficiency.
Currently, the Electricity Act of 2003 and the India’s Electricity Grid Code (IEGC)
regulate the power transmission component. However, there is a need for the
realignment of regulation and strengthening of institutions so that the company’s
transmission capacity can be equally boosted. The last and important component is a
distribution. Distribution of power is the most recognizable feature of all. It ensures that
the end consumer is reached by the national grid. For the government and other
investors in this sector, effective distribution also affects the overall revenue levels to
be attained. The nature of distribution also underscores the different needs of
consumers (commercial, residential or industrial).
1.2.3.3 Distribution
The commercial viabilities of the existing distribution utilities are mostly owned by the
Government. Within the last five years, the unit costs of distribution have increased by
over 20%. However, this apparent increase was not commensurate with an equal
increase in the costs of electricity supply. The result is the ever widening gap between
the costs of supply and those of electricity tariffs in the country. Therefore, investing in
the country’s distribution network is a financial risk.
Second, the government continues to register substantial losses within its distribution
infrastructure. Losses occur to due to destruction and theft of distribution utilities.
Replacing such utilities amidst rising costs of purchase has resulted in increased
expenditure. Considering that the tariffs charged to consumers do not change more
often, the revenue accrued from distribution has been significantly reduced. As a result,
there is little investment done to ensure increased efficiency, quality and accessibility of
electric power. At the same time, India continues to grapple with an ageing electricity
34 | P a g e Figure 1.2.3.3 Cost of power supply (Paisa/kWh)
Source: (Author, with data from Monthly Reports CEA December 2012)
The dilapidation of the country’s electricity distribution utilities was exposed in July
2012 when the country experienced a blackout that affected its 670 million consumers.
This unexpected power failure obviously resulted in massive losses not only for the
distribution firms, but also for the commercial and industrial consumers. As a result of
power supply instability in the country, the government has been looking for other
alternatives in the renewable source category. The country’s major cities continue to
overstretch the demand for electric power. At the same time, rural households also
depend on electricity to develop into future urban areas. However, the failures
discussed above do not assure rural India that they are going to have stable supplies in
future. This project finds a best alternative solution for reducing the power problem in
35 | P a g e
1.3 The problem
Having reviewed the background of this study, it is evident that India faces the challenges
related to generation, transmission and distribution of electric power to its populous
regions. India mainly produces the electricity by the use of fossil fuels. But this has
negative impact on environment by increasing the global warming on the earth. Coal has
the maximum amount of effect on the environment by releasing the carbon emission gases
into the atmosphere followed by natural gas as shown in the figure 1.3.1.
Figure 1.3 Carbon emission gases released by various resources
Source: (Farhan Beg, 2013)
Therefore, renewable energy sources play a crucial role for saving the environment
globally. As the government and private sector participants in the energy sector look for
solutions, there is a need for the rural population to adopt sustainable energy production
and distribution methods. This study identifies the use of MG’s as an alternative to the
sustenance of the country’s rural household demand for electric power. A key challenge
lies in the implementation of MG’s use in remote areas where extension of the national grid
36 | P a g e 1.3.1 Use of Micro-grids
Micro-grids are intended to decentralize the generation and transmission of power to such
isolated areas. However, it is important to investigate how this project may be implemented
for the benefit of rural populations in the country. The specific interest to this study is the
control of voltage for the MG’s to ensure there are a maximum utilization as well as
improved safety. The use of MG’s in the country will certainly help to reduce the number
of people who are not still connected to the national grid. Even though India has a rapidly
growing population, its power supply capacity still remains low.
1.3.2 Electrification Rates
For the country to attain the growth objectives and match nations like China, sustainable
actions must be taken to alleviate the country from its energy problem. In comparison to
China, which has 99.4% coverage, about 66% of India’s population has meaningful access
to the national electricity grid. This poor coverage is further compounded on by the fact
that a majority of the country’s population (7 out of 10) live in rural areas. As of 2010, only half of India’s rural population had access to electricity. Therefore, the gap between the
demand and supply for electric power is wider for the rural populations more than the
urban ones.
The main reason for the low electrification rates in India is that the traditional approach of
the grid-extension is not possible. Thereby causing the poor load factors, dispersed demand
and the main disrupted power supply in the country. Therefore the option of implementing
the national grid to the rural areas is not an optimal solution. In most of the rural parts of
India, the access of electricity is not equally provided to all the customers and even some of
the house-holds were remain un-electrified. From this it is noted that the proportion of
37 | P a g e Figure 1.3.2 Status of electrification in India
Source: (WEO 2009; http://www.iea.org/weo/electricity.asp)
It is surprising to see that India is ranked among the least developed nations in the world in
terms of its electrification rates per population as shown in the figure 1.3.3. The main
reasons why India is un-developed despite of its high GDP is because of huge segment of
population which consists of poor, rural and dwelling households.
Most of the house-holds in rural parts of the India utilize the source of lighting by the use
of kerosene, fossil fuels, solar and the other oils. This creates a problem to the people when
there is no availability of these resources.
Generally, only about 55.3% of the country’s rural population has access to electricity
compared to the electrification rates of about 92.7% in urban areas. More-over, 1.2 million
38 | P a g e
Table 1.3.2 Source of lighting for Indian House-holds Item
No.
House list Item Percentage
Total Rural Urban
P Households by main source of lighting
P.1 Total number of households 100% 100% 100%
P.2 Electricity 67.2% 55.3% 92.7%
P.3 Kerosene 31.4% 43.2% 6.5%
P.4 Solar 0.4% 0.5% 0.2%
P.5 Other oil 0.2% 0.2% 0.1%
P.6 Any other 0.2% 0.2% 0.2%
P.7 No lighting 0.5% 0.5% 0.3%
Source: (http://www.censusindia.gov.in/2011census)
From the table 1.3.2, the disparity in source of lighting for rural and urban populations in
India is alarming. And the percentage of source of lighting to rural areas is less when
compared with urban areas. Therefore, the low connectivity rates of the rural areas may be
attributed for the further development to increase their rates.
1.3.3 Rural Settlements
Two major characteristics of most rural areas include dispersed settlements and
unfavorable terrains. Sparsely populated areas mostly arise because of rural-urban
migration trends. Therefore, it may be commercially untenable to expand the existing
supply network to reach the rural areas. In addition, the rough terrain in most of these areas
provides massive challenges for installation of distribution of power line in a larger scale
(Illindala, Siddiqui, Venkataramanan&Marnay, 2007). Even when such lines and
transmitter are installed, the costs of maintenance may be unbearable considering the
demand for power in such regions. Consequently, connecting the rural population to the
39 | P a g e 1.3.4 Decentralized Power Systems
The ideal model of electricity generation and supply in rural areas, therefore, relies on
decentralization. There is a need for strategically located generation units with localized
distribution networks for the rural regions. In this way, easy access to electricity is
guaranteed to every household. The costs of installation and maintenance for decentralized
models are also likely to be lower; MG’s provide a viable solution of the country’s
electricity generation and distribution problem.
As opposed to centralized power systems identifiable to the country’s existing national
grid, MG’s enable the distributed generation. The aims of MG’s are to enable the
generation of electricity close to the area of utilization. In the case of rural India, MG’s are
to be located in rural villages to enhance accessibility.
A micro-grid largely utilizes the available renewable energy sources for the sake of
generation. For instance, the solar panels mounted on rooftops may facilitate a distributed
generation to one or more households. In other words, they ensure the production of
electric power at the same location where the renewable energy has been harnessed.
Figure 1.3.4 Sources for Distributed Generation
40 | P a g e
To transmit the power effectively, a micro-grid must combine the operating functions,
cluster of loads and resources using the controllable unit. Referring to the figure 1.3.5,
resources used are in the form of renewable or non-renewable forms. However, most MG’s
utilize the renewable forms of energy more than the non-renewable sources. To the utility,
MG’s which are connected with controllable loads produces the effective supply to the
transmission network. MG’s utilizes the energy fuel categories such as wind turbines, direct
combustion engines and solar thermals which provide the electricity as per the demands of
the local consumers.
Micro-grids provide the source of livelihood which improves reliability, reduces feeder
loses and enhance sustainability through waste utilization of the energy. Therefore,
distributed systems are essential because of their ability to switch from national grid
41 | P a g e
1.4 Research Objectives
The main objectives of the research are as follows
To analyze AC/DC topologies and their control of energy dispatch operation
To test whether LV residential loads can be supplied with DC and deriving their load models
Developing operation control strategies for equitable energy dispatch between load
users and investigate protection systems applicable for LV dc micro grid systems
Model in Homer energy software with various hybrid sustainable energy supply
sources, and the available output over annual period. This is to investigate energy
availability versus energy demand
To design and model a LV dc system which is used for future development of rural
area
To provide an equitable power sharing methods and how this can match voltage
regulation
As the time permits
Comparing AC micro grids and its protection requirements
Investigate alternative customer voltage regulator based solutions
Micro-grids provide the more challenges to the solar panels in the rural populations despite
the fact that they can generate more reliable and sustainable power for the households in
rural population. MG’s must be closely monitored to ensure that the rural populations enjoy
the benefits of localized power distribution. As a result, the main aim objective of the
project is to investigate how voltage control can be effectively done to make ensure that
42 | P a g e
1.5 Chapter Summary
Today, many households in rural areas still lack access to electricity. India still relies on an
outdated national grid system. As a result, about 40% of generating power is lost during the
transmission. This loss rate is one of the highest in the world. Consequently, many
households in rural areas are not able to receive an adequate power supply. In addition,
such inefficiencies have resulted in high costs of maintenance, transmission and
distribution. Therefore, it remains economically unviable to supply most rural areas with
electricity from the national grid. Extending the national grid to more rural areas will
currently cost about Rs57/kWh/km. This is due to the fact that expanded connections will
require additional generation of power which further compounds the cost problem.
Coal is the main raw material used in the country’s thermal generation plants. The
additional use of coal will contribute to extreme degradation of the environment through
excessive emissions of carbon from the coal generation plants. Given that India already
contributes the huge amounts of greenhouse gas emissions into the atmosphere, the
expansion of national grid may not be sustainable. However, sustainable sources of power
must be explored if rural households are to be uplifted. Electric power will aid the
expansion of irrigation systems, small and micro enterprises and other commercial
activities that all contribute to national economic growth.
In such a way, the use of MG’s does provide the best alternative for lighting the villages
and boosting the economic levels of rural areas. MG’s will also ensure that the country
reduces carbon emissions through use of ecologically friendly power generation sources
like wind and solar energy. In theory, India’s potential to generate solar energy is pegged at
5000trillion kWh/year (Venkataramanan & Marnay, 2008). Most of the country's rural
areas have the abundant sunlight throughout the year to support a solar powered micro-grid
system. The use of solar photovoltaic energy should therefore remain a priority for all
stakeholders in the country energy sector. However, there are many implementation and
43 | P a g e
CHAPTER-2
LITERATURE REVIEW
2.1 Introduction
The background of this study has revealed a deplorable state of India’s electric power
generation, transmission and distribution. Importantly, it has highlighted the need for
decentralized power systems for rural populations that have previously lacked access to
affordable and reliable electricity. With an improvement in technology, the energy sector
has benefited from opportunities to design, test and implement efficient generation and
supply systems.
The use of MG’s has also been advanced through improved control, monitoring and billing
systems. Essentially, the potential MG’s hold in the modern world is tremendous. Their use
has been specifically encouraged among the remote and underdeveloped regions that have
not been, presently connected to reliable and sustainable sources of electricity.
Micro-grids have been proposed to help and uplift the socioeconomic status of the
low-income earning population who live in rural parts of India. This chapter reviews all
literature relating to the operation, implementation and customization of micro-grid power
systems for rural area settings. It also outlines the benefits of decentralized power
generation and distribution systems in rural areas as well as the role of renewable energy
sources in India.
Further, both opportunities and challenges in the implementation and use of such systems
are implored. Subsequently, the information obtained from similar projects and cases will
be used to strengthen the viability of this project. To begin, it is important to understand
44 | P a g e
2.2 Micro-grids
Carbon arc technology was the first business provision on the planet which was utilized by
utilizing electricity for lighting. This light was made by an arc between two carbon tips
which brings about giving a brilliant white light from excitation of the ionized gas pathway
of the electrical arc current. The carbon tips needs to be adjusted, the correct arc gap
maintained, and the tips periodically replaced. This technology was created in nineteenth
century and similarly electrical engineering produced batteries and other electrical sources
of energy. Dynamos were utilized for delivering power through distribution networks that
developed, and these were supplied originally by both DC or AC voltage and current
sources.
The first lighting network was implemented by Thomas Edison in the year 1878. He used
DC to supply the power to power both lights and electrical motors. He created the first
technology for a complete low-voltage DC network in the year 1882 to supply around 1200
lights in the Pearl Street, New York; serving an area about 2.6 km2. This was in fact the first micro-grid.
Micro-grid generally refers to the source of single electrical distribution system which is
interconnected through small number of distributed generators that can be power-driven by
making use of renewable energy sources with different load clusters. MG’s takes the
concept of decentralized generation for the supply of electricity. Moreover this can produce
relatively low voltage power from the localized generation systems. The sources of
generation for such decentralized systems include photovoltaics (PV), micro-hydro and
biomass systems which generates enough power supply to a limited number of customers.
Generally, MG’s are meant to function independently from the normal national grid
systems. They mainly utilize locally available resources to generate, distribute and manage
local power supply and demand (Lilienthal, 2013). There are numerous forms of MG’s,
45 | P a g e Figure 2.2 General layout of Micro-grid
Source: (www.googleimages/Microgrids)
Just like conventional grid systems, micro-grids are able to serve the power to the
households, commercial institutions and community utilities. These MG’s are built to
enhance reliability and affordability of the electric power as the central grid may sometimes
be costly, inaccessible or un-reliable.
Micro-grids can be categorized into five main areas, according to the regions or institutions
they are meant to serve. They include remote systems, commercial centers and both
institutional and military communities. However, there exists a different category in
relation to the size of such decentralized energy distribution systems. First, there are
large-grid connected ones that may serve military barracks or educational centers. The second
category includes small-grid connected MG’s that may have a form of backup generators
that complement national grid supplies. In addition, there are small remote MG’s that may
serve local populations like villages. Lastly, the large one remote may serve the isolated
46 | P a g e 2.2.1 Grid connections
In the rural parts of India, the grid connections provide the best approach for the sake of
electrification to the majority of rural house-holds. The latest government RGGVY is
focusing in expanding the existing grid to reach all the villages for the sake of rural
electrification by the end of the year 2012 (James Cust, Anoop Singh and Karsten Neuhoff,
2007). Report studies shows that the average cost of supply is around Rs.3/kWh which
proves to be significantly higher for the rural electrification. Also the cost of delivery to
rural areas is three times the generation cost which is alarming.
The cost of the grid connection increases rapidly as the distance between the grid and the
area increases. The cost will generally increase by Rs.1/kWh per kilometer of expansion to
the villages. (James Cust, Anoop Singh and Karsten Neuhoff, 2007)
Figure 2.2.1 Cost of grid electrification between the existing grids related to the distance
Source: (James Cust, Anoop Singh and Karsten Neuhoff, 2007)
The grid tariffs for the poor house-holds ranges from Rs.0-10/month while for the domestic
customers it ranges from Rs.0-130/month. These tariffs will lie in the range of cost of
supply and are based on the redistributive policies and financial relief which will be
notified by SEB. Hence the grid connections represent the cheapest electrification option
for rural house-holds considering the per unit cost terms (James Cust, Anoop Singh and
Karsten Neuhoff, 2007).
25
20
Deshmukh and Bilolikar 2006 Chakrabarti 2002
Average grid tariff (Powerline 2007) Ashok 2006
UREDA tariff doc Hansen and Bower 2003
15
10
5
0
Connectivity (km from exisiting grid infrastrucuture)
0 5
Grid available (Off‐grid)
10 (Remote)
47 | P a g e
2.3 Renewable Energy Scenario in India
2.3.1 Role of Renewable energy (RE)
India is the sixth largest country in the world for generation of electricity [28] through the
energy sources like thermal, hydro, nuclear and the rest by making use of renewable
sources. However, renewable energy sources are preferred over the fossil fuels as they are
eco-friendly to the nature. The main RE sources used in India are wind energy, solar
energy, biomass and hydro energy. The total capacity generated by using RE sources [29]
is about 30 GW, in which wind contributes (18.3GW), hydro (3.4GW), biomass (1.2GW)
and solar (1GW).
Unlike renewable energy sources, there are non-renewable sources available for the
generation of electricity. They include Oil, Coal, Gas and Hydro-power which are also
responsible for the country’s generation of electricity. But there is an increase in
environmental concern by making use of coal as they release the carbon emission gases in
to the atmosphere such that there will be increase in the level of global warming. In order to
reduce these emissions, MG’s uses the available sources of renewable energy for producing
the electricity without any harmful effects to the global environment.
Though India has vast number of renewable energy sources, still there is no proper supply
of electricity to half of the rural parts in the states. Hence MG’s plays a crucial role for
developing the growth of the country and more over increasing the economic benefits to the
rural parts of the India. However, in this project DC micro-grid utilizes the RE sources such
as wind energy, solar energy and biomass energy for the implementation of MG system to
48 | P a g e 2.3.1.1 Wind Energy in India
Wind power energy is the most common available renewable energy generation technology
in the developing world. This program was initiated in the year 1983-84 (Farhan Beg,
2013) for the generation of power to the majority of the people in India. Most of the wind
power energy arrangement will be grid connected. These cannot be connected through
off-grid stand-alone generation as there will be variations in the supply generation. In 2009,
India has installed the power capacity of 1,338MW out of the total capacity of 10,925MW
through wind generation (Indian Renewable Energy Status Report Background for DIREC
2010). However, the installed capacity has risen up to 12,009MW in the month of June
2010 which disclosed the 70% of total installed renewable energy capacity.
Table 2.3.1.1 Wind Power Potential across nine states in India
State Wind Power Potential(MW)
Andhra Pradesh 8,968(MW)
Gujarat 10,645(MW)
Karnataka 11,531(MW)
Kerala 1,171(MW)
Madhya Pradesh 1,019(MW)
Maharashtra 4,584(MW)
Orissa 255(MW)
Rajasthan 4,858(MW)
Tamil Nadu 5,530(MW)
Total 48,561(MW)
Source: (Indian Renewable Energy Status Report Background for DIREC 2010).
The C-WET, a state run organization has estimated the highest wind potential across the
nine states which are shown in the Table2.3.1.1. This assumption was based on the
percentage of availability of land area and each megawatt of wind capacity requires 12 ha
of land. Therefore, the total wind potential available in India is 48,561MW with Karnataka,
Gujarat, and Andhra Pradesh has the highest available wind potential followed by other
49 | P a g e 2.3.1.2 Solar Energy in India
India is located between the Tropic of Cancer and the Equator; due to this the annual
average temperature ranges from 25 degree Celsius to 30 degree Celsius (Peter Meisen,
2006).The country has 300 sunny days per year which receives the average hourly radiation
of 200MW/km2. This clearly shows that India has the vast amount of solar potential which is used for producing the electricity. The India Energy Portal has estimated that the 12.5%
of land can be used for the installation of solar energy. However, the country has
underutilized the solar resource due to high capital costs.
Majority of the installed Solar PV projects were accounted for 0.5% of grid-connected
renewable energy additions during the year 2009-2010. In the month of June 2010, India
has installed the solar capacity of 15.2MW which is based on PV technology, while 20% of
the installed capacity is being used for off-grid applications. .According to the phase 1 of
JNNSM, India planned to install 500MW of grid connected solar power by the end of the
year 2013 (Indian Renewable Energy Status Report Background for DIREC 2010).
However, the National Action Plan was ready to launch the National Solar Mission to
generate 1,000MW of power by the same year 2013.
2.3.1.3 Biomass Energy in India
Bio-energy is the traditional source of household energy in India which contributes 14% of
global energy supply. India has most of the non-conventional energy sources such as wood
and cow-dung which are used for the energy supply. As there is no access of electricity in
rural areas, people use wood and cow-dung as fuel for the purpose of cooking and water
heating. Biomass energy is obtained from the organic material which is used as the
conversion process for producing the power, heat and fuel. These biomass resources
produces the power through grid-connected bio-mass power plants, off-grid distributed
biomass power applications and finally by using sugar mill industries. It is estimated that
the biomass resources produces 500 million tons per year, out of which 120-150 million
tons is used for the generation of power (Indian Renewable Energy Status Report
50 | P a g e
Recently India have established 2000 gasifiers with a capacity of 22 MW through which
the rural households have been electrified with biomass gasifier based generators. MNRE
has estimated that the amount of biomass resources available for power generation is about
189 million tones, which roughly produces 25 GW of power through installed capacity.
The generations of power capacity through various renewable energy resources are
presented in the table 2.3.1.3.
Table 2.3.1.3 Generation of Power Capacity (MW) through Grid-connected renewable energy sources
Renewable energy program 2010-11 Cumulative Deployment up to 31.12.10
Target Achievements up to 31.10.2010
Wind Energy 2,000MW 1259.03MW 13065.78MW
Small Hydro Power 300 MW 203.92MW 2939.33MW
Biomass Power 455MW 143.50MW 997.10MW
Bagasse Cogeneration 216 MW 1562.03MW
Waste to power (Urban and
Industrial)
17MW 7.50MW 19.00MW
- 53.46MW
So