0022-538X/10/$12.00 doi:10.1128/JVI.00694-10
Copyright © 2010, American Society for Microbiology. All Rights Reserved.
Viral Mutation Rates
䌤
Rafael Sanjua
´n,
1* Miguel R. Nebot,
2Nicola Chirico,
3Louis M. Mansky,
4and Robert Belshaw
5 Institut Cavanilles de Biodiversitat i Biologia Evolutiva, Departament de Genetica, and Unidad Mixta de Investigacio´n enGeno´mica y Salud, Universitat de Vale`ncia, C/Catedra´tico Agustín Escardino 9, Paterna 46980, Vale`ncia, Spain1; Instituto de Física Corpuscular, Universitat de Vale`ncia and CSIC, C/Catedra´tico Agustín Escardino 9,
Paterna 46980, Vale`ncia, Spain2; Department of Structural and Functional Biology, Via JH Dunant 3, University of Insubria, 21100 Varese, Italy3; Institute for Molecular Virology, Academic Health Center,
University of Minnesota, Minneapolis, Minnesota 554554; and Department of Zoology, South Parks Road, University of Oxford, Oxford OX1 3PS, United Kingdom5
Received 31 March 2010/Accepted 12 July 2010
Accurate estimates of virus mutation rates are important to understand the evolution of the viruses and to combat them. However, methods of estimation are varied and often complex. Here, we critically review over 40 original studies and establish criteria to facilitate comparative analyses. The mutation rates of 23 viruses are presented as substitutions per nucleotide per cell infection (s/n/c) and corrected for selection bias where
necessary, using a new statistical method. The resulting rates range from 10ⴚ8to10ⴚ6s/n/c for DNA viruses
and from 10ⴚ6to 10ⴚ4s/n/c for RNA viruses. Similar to what has been shown previously for DNA viruses, there
appears to be a negative correlation between mutation rate and genome size among RNA viruses, but this result requires further experimental testing. Contrary to some suggestions, the mutation rate of retroviruses is not lower than that of other RNA viruses. We also show that nucleotide substitutions are on average four times more common than insertions/deletions (indels). Finally, we provide estimates of the mutation rate per nucleotide per strand copying, which tends to be lower than that per cell infection because some viruses undergo several rounds of copying per cell, particularly double-stranded DNA viruses. A regularly updated virus mutation rate data set will be available at www.uv.es/rsanjuan/virmut.
The mutation rate is a critical parameter for understanding viral evolution and has important practical implications. For instance, the estimate of the mutation rate of HIV-1 demon-strated that any single mutation conferring drug resistance should occur within a single day and that simultaneous treat-ment with multiple drugs was therefore necessary (72). Also, in theory, viruses with high mutation rates could be combated by the administration of mutagens (1, 5, 21, 44, 53, 83). This strategy, called lethal mutagenesis, has proved effective in cell cultures or animal models against several RNA viruses, includ-ing enteroviruses (11, 39, 44), aphtoviruses (83), vesiculovi-ruses (44), hantavivesiculovi-ruses (10), arenavivesiculovi-ruses (40), and lentivi-ruses (15, 53), and appears to at least partly contribute to the effectiveness of the combined ribavirin-interferon treatment against hepatitis C virus (HCV) (13). The viral mutation rate also plays a role in the assessment of possible vaccination strategies (16), and it has been shown to influence the stability of live attenuated polio vaccines (91). Finally, at both the epidemiological and evolutionary levels, the mutation rate is one of the factors that can determine the risk of emergent infectious disease, i.e., pathogens crossing the species barrier (46).
Slight changes of the mutation rate can also determine whether or not some virus infections are cleared by the host immune system and can produce dramatic differences in viral fitness and virulence (75, 90), clearly stressing the need to have
accurate estimates. However, our knowledge of viral mutation rates is somewhat incomplete, partly due to the inherent dif-ficulty of measuring a rare and random event but also due to several sources of bias, inaccuracy, and terminological confu-sion. One goal of our work is to provide an update of published mutation rate estimates, since the last authoritative reviews on viral mutation rates were published more than a decade ago (29, 30). We therefore present a comprehensive review of mutation rate estimates from over 40 original studies and 23 different viruses representing all the main virus types. A sec-ond, and perhaps more ambitious, goal of our study is to consolidate the published literature by dealing with what we regard as the two main problems in the field: the use of dif-ferent units of measurement and the bias caused by selection. The problem of units is linked to the different modes of replication in viruses. Under “stamping machine” or linear replication, multiple copies are made sequentially from the same template and the resulting progeny strands do not be-come templates until the progeny virions infect another cell. In contrast, under binary replication, progeny strands immedi-ately become templates and hence the number of molecules doubles in each cycle of strand copying, increasing geometri-cally. This basic distinction leads to two different definitions of the mutation rate: per strand copying or per cell infection. If replication is stamping machine-like, there is only one cycle of strand copying per infected cell and hence the two units are equivalent. However, binary replication means that the virus completes several cycles of strand copying per cell. The actual replication mode of most viruses is probably intermediate be-tween these two idealized cases, and although it is known to be closer to linear in some viruses (9, 19) and closer to binary in
* Corresponding author. Mailing address: Institut Cavanilles de Biodiversitat y Biologia Evolutiva, Universitat de Vale`ncia, C/Cat-edra´tico Agustín Escardino 9, Paterna 46980, Vale`ncia, Spain. Phone: 34 963 543 270. Fax: 34 963 543 670. E-mail: [email protected].
䌤Published ahead of print on 21 July 2010.
9733
on November 8, 2019 by guest
http://jvi.asm.org/
others (26, 55), it is often unknown. This leads to uncertainties in mutation rate estimates. For instance, in the case of polio-virus 1, the estimated rate per strand copying can vary by 10-fold depending on whether stamping machine or binary replication is assumed (27). Typically this difference in the unit of measurement has been overlooked in comparative studies. Here, we express published estimates in the same unit.
The other issue that we address is selection. In general, deleterious mutations tend to be eliminated and hence are less likely to be sampled than neutral ones, introducing a bias in mutation rate estimates. To avoid this problem, selective neu-trality is sometimes enforced by the experimenter, such that the number of mutations increases linearly with time (58, 88). The opposite strategy is to focus on lethal mutations, which have necessarily appeared during the last cell infection cycle, thus establishing a direct and time-independent relationship between the observed mutation frequency and the underlying mutation rate (13, 37). In between these two special cases, an explicit correction for selection is needed. Even if the effect of each individual mutation on viral fitness is unknown, the effect of selection can be statistically accounted for as long as the number of mutations sampled for estimating mutation rates is large. We do this here using empirical information about the distribution of mutational fitness effects previously obtained for several viruses (6, 23, 73, 80). Importantly, the basic prop-erties of this distribution appear to be well conserved (78), and hence the proposed method should be applicable to a wide variety of viruses.
Using the resulting mutation rate data, we retest some pre-viously accepted general patterns, suggest new ones, infer the mode of replication of some viruses, and compare the rates of mutation to substitutions with those to insertions/deletions (in-dels).
METHODS
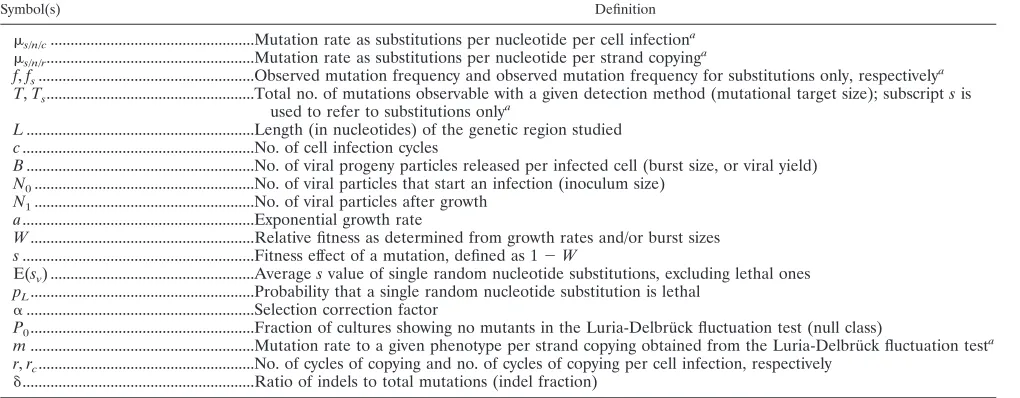
Definitions and symbols used are summarized in Table 1.
Measuring mutation frequencies and mutational target sizes.A seemingly
simple approach to measuring the mutation frequency (f) is to PCR amplify the
nucleic acid of a virus which has been propagated from a genetically homoge-neous inoculum for a short time, obtain molecular clones, and sequence them. The set of all mutations that can be sampled using this method (mutational target
size) isTs⫽3Lfor nucleotide substitutions andTi⫽Lfor indels, whereLis
sequence length. Selection bias needs to be accounted for or corrected as de-scribed below. One problem with this method is that some apparent mutations will actually be errors introduced by the PCR/sequencing procedure and this will
lead to overestimation off. The error rate of the method therefore should be
calibrated. Alternatively, it is possible to isolate viral clones by picking single plaques, amplify the nucleic acid by PCR, and sequence directly (i.e., without molecular cloning). The way we should then account for selection depends on whether the latter method or the molecular clone sequencing method is used.
Instead of relying solely on sequencing, one can first screen for mutations conferring a specific phenotype. This is often done using a selective agent such as an antiviral, a monoclonal antibody, or a nonpermissive host cell.
Neverthe-less, mutants still need to be sequenced to determineT. Notice that lethal
mutations cannot be scored and do not contribute toT. A potential problem of
this approach is that if some mutations are particularly unlikely,Tcan be
underestimated, leading to an overestimation of the mutation rate. Sometimes experiments use neutral reporter genes, typically a transgene, such as, for
in-stance, thelacZ␣-complementation sequence. Null mutations in the reporter
lead to an observable phenotype. Most indels should produce the null phenotype
and henceTi⬇L, but only a fraction of nucleotide substitutions will (Ts⬍3L).
One way to solve this problem is to focus on nonsense substitutions which produce premature stop codons and thus should lead to the null phenotype on
most occasions. In this particular case,Tscan be estimated as the total number
of possible substitutions leading to a premature stop codon in the reporter gene, i.e., the nonsense mutation target size (13).
Calculation of the mutation rate per cell infection.Although the details of the calculations can differ slightly depending on the particular study (see Appendix,
“Calculation of mutation rates per nucleotide per cell infection”), in generalfhas
to be divided byTand by the number of cell infection cycles,c. For exponentially
growing viruses,
c⫽log共N1/N0兲
logB (1)
whereN0andN1are the initial and final virus titers, respectively, andBis the
burst size (or viral yield), which can be determined by routine techniques (7). If
all mutations were neutral, they would freely accumulate during theccycles.
However, many mutations will be lost due to selection, and thus a correction
factor which accounts for selection bias (␣) is needed. The mutation rate to
TABLE 1. Definitions of variables used for estimating mutation rates
Symbol(s) Definition
s/n/c...Mutation rate as substitutions per nucleotide per cell infectiona
s/n/r...Mutation rate as substitutions per nucleotide per strand copying
a
f,fs...Observed mutation frequency and observed mutation frequency for substitutions only, respectivelya T,Ts...Total no. of mutations observable with a given detection method (mutational target size); subscriptsis
used to refer to substitutions onlya
L...Length (in nucleotides) of the genetic region studied
c...No. of cell infection cycles
B...No. of viral progeny particles released per infected cell (burst size, or viral yield)
N0...No. of viral particles that start an infection (inoculum size)
N1...No. of viral particles after growth
a...Exponential growth rate
W...Relative fitness as determined from growth rates and/or burst sizes
s...Fitness effect of a mutation, defined as 1⫺W
E(sv) ...Averagesvalue of single random nucleotide substitutions, excluding lethal ones pL...Probability that a single random nucleotide substitution is lethal
␣...Selection correction factor
P0...Fraction of cultures showing no mutants in the Luria-Delbru¨ck fluctuation test (null class)
m...Mutation rate to a given phenotype per strand copying obtained from the Luria-Delbru¨ck fluctuation testa r,rc...No. of cycles of copying and no. of cycles of copying per cell infection, respectively
␦...Ratio of indels to total mutations (indel fraction) a
A subscriptiis used analogously to refer to indels.
on November 8, 2019 by guest
http://jvi.asm.org/
[image:2.585.43.553.81.280.2]substitutions per nucleotide per cell infection (s/n/c) can be therefore calcu-lated as
s/n/c⫽
3fs
Tsc␣
(2)
where the subscriptsrefers to substitutions. Multiplication by 3 is done because
there are three possible substitutions per site. Analogously, for indels, the mu-tation rate per nucleotide per cell infection (i/n/c) can be obtained as
i/n/c⫽ fi Tic␣
(3)
where the subscriptirefers to indels. Finally, we define the indel fraction as
␦⫽ i/n/c
i/n/c⫹s/n/c
(4) Correction of selection bias.In this section we focus on nucleotide substitu-tions (experiments where indels were scored satisfied neutrality in general). As a
first approach, lower- and upper-limit estimates ofs/n/ccan be obtained by
assuming strict neutrality and lethality, respectively. If all mutations were neutral,
the frequency of substitutions,fs, would increase linearly with time, but removal
of mutations by selection will make this increase slower than linear. Hence, the assumption of neutrality gives us the following lower-limit estimate:
min关s/n/c兴⫽
3fs
Tsc
(5)
In contrast, if all mutations were lethal,fswould remain constant through time
and thus would not depend onc(it would consist solely of mutants appearing
during the last cell infection cycle). However, as long as some mutants produce
progeny,fswill increase withc. Hence, the assumption of lethality gives us the
following upper-limit estimate:
max关s/n/c兴⫽
3fs
Ts
(6) Notice, however, that the logic of equation 6 holds only if mutation sampling is not affected by selection (nonselective sampling), because otherwise, strongly deleterious and lethal mutations are not observable. This problem occurs, for instance, in plaque sequencing experiments.
By comparing equations 5 and 6 we conclude that, obviously, lowcvalues
are preferable because they narrow the estimation interval (i.e., experiments should be carried out over a short time period). To obtain a more accurate
estimate ofs/n/c, we have to calculate the selection correction factor␣as
defined in equation 3, which can be thought of as the reduction in mutation
frequencyfsdue to selection. Equivalently,␣ ⫽(min[s/n/c])/s/n/c, i.e., the
ratio between the mutation rate estimate that we would obtain assuming strict
neutrality and its actual value. Importantly,␣is independent of the
magni-tude of the mutation rate. Notice that␣ ⫽1 for neutral mutations, whereas
␣ ⫽1/cfor lethal mutations, and that these two special cases give us the
highest and lowest possible values of␣.
We can estimate␣from empirical information about the statistical distribution
of the fitness effects of random single-nucleotide substitutions, which has been obtained in previous work using site-directed mutagenesis (6, 23, 73, 80). We did so numerically by simulating the effects of mutation and selection. The use of this statistical approach is justified if the mutational target used in the original experiment is representative of mutations occurring elsewhere in the genome,
which implies thatTshas to be large. We modeled mutational fitness effects,s,
using an exponential distribution (truncated ats⫽1) plus a class of lethal
mutations occurring with probabilitypL. This model can be written as
冦
P共s兲⫽共1⫺pL兲e⫺s
1⫺e⫺if 0⬍s⬍1
P共s兲⫽pLifs⫽1
P共s兲⫽0 otherwise
(7)
The exponential distribution has a single parameterwhich equals the reciprocal
of its mean. Hence, knowing the average effect of nonlethal mutations E(sv)⫽
1/and the lethal fractionpL, it is possible to predict␣as a function of time
[notice that since the exponential distribution is truncated ats⫽1, E(sv) is
indeed different from 1/, but this deviation can be ignored for thevalues used
here]. Previous work has shown that the exponential plus lethal model allows us to describe with reasonable accuracy the empirical distribution of mutational
fitness effects and that realistic parameter values are E(sv)⫽0.10 to 0.13 and
pL⫽0.2 to 0.4 (78). Two-parameter distributions such as the gamma, the beta,
or the log normal are generally more accurate than the exponential, but for the purposes of this study, the exponential should be satisfactory.
We have to pay attention to the way in which fitness is defined. In the above-mentioned studies (6, 23, 73, 78, 80), mutational fitness effects were obtained directly from growth rate ratios as
si⫽1⫺ai/a0 (8)
whereais the exponential growth rate and subscriptsiand 0 refer to the mutant
and the reference virus, respectively. In order to convert these values to fitness effects per cell infection (our unit of interest here), we need to apply the following transformation:
s⬘i⫽1 ⫺ B1⫺si⫺
1
B⫺1 (9)
The reason for this transformation is as follows. By definition, the reference virus
increases its numbers by a factor ofBafter one cell infection cycle. Under
exponential growth, the population size equalsNt⫽N0eatand the time required
for the reference virus to complete one cell infection is thus (logB)/a0. After
this time, the population size of mutantiwill have increased by a factor of
eai(logB)/a0 ⫽ Bai/a0. Therefore, its relative fitness per cell infection is
Wi⬘ ⫽ 1 ⫺ si⬘ ⫽ 共Bai/a0 ⫺ 1兲/共B ⫺ 1兲 ⫽ 共B1⫺si ⫺ 1兲/
共B ⫺ 1兲, where the⫺1 term subtracts the infecting virus.
After simulating fitness effects using the exponential plus lethal model and converting them to per cell infection units, selection was applied by picking
individuals for the next cell infection cycle with probabilityWi⬘. Generations were
assumed to be nonoverlapping, and at each cycle,␣was calculated before and
after the selection step. The former corresponds to what would be expected if mutation sampling was not affected by selection bias (nonselective sampling), whereas the latter better reflects the situation in which mutation sampling is
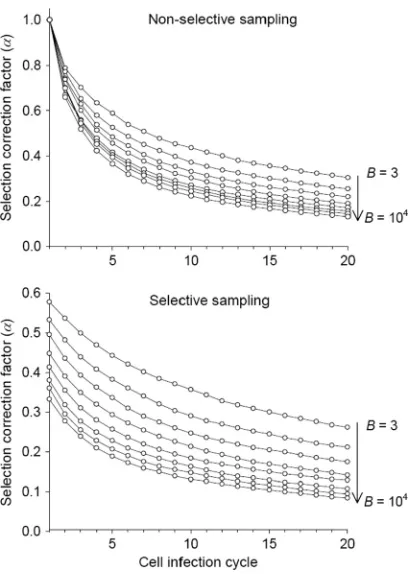
conditioned by selection (selective sampling). The resulting␣values are shown
in Fig. 1 for E(sv)⫽0.12,pL⫽0.3, and a wide range ofBvalues. The use of
values of E(sv) ranging from 0.10 to 0.13and ofpLranging from 0.2 to 0.4 had
little effect on␣in all cases (not shown). To calculate␣in the mutation rate
estimates appearing on Table 2, specificBvalues were obtained from the
liter-ature, as detailed in Appendix, “Calculation of mutation rates per nucleotide per
cell infection.” In all cases, the size of the simulated virus population wasN⫽
104
, which is sufficiently high for us to ignore the effects of genetic drift. For simplicity, mutations were assumed to have independent fitness effects (no epistasis), and back mutations were ignored, which seems reasonable in the short term, when forward mutations will greatly outnumber them. Finally, in one study, there were two successive selection regimens (34), and we calculated the overall
correction factor as the weighted average of the two␣values.
The simulations described above were performed with Wolfram Mathematica 7.0 and Microsoft Excel 2003. Mathematica notebooks and Excel spreadsheets
for obtaining predictions offsand␣as a function of time (c) for any given
combination of E(sv),pL,B, andNare available upon request.
Calculation of the mutation rate per strand copying.In principle, the
calcu-lation is the same as fors/n/c, replacingcby the number of copying cycles,r(also
accounting for selection). However, to obtainrfrom initial and final viral titers,
it is necessary to know the replication mode, a condition that is not satisfied in most cases. A specific method for estimating mutation rates per strand copying
which avoids this problem is the Luria-Delbru¨ck fluctuation test (55, 56). Its
application to viruses has been described elsewhere (12, 36, 55, 81, 85, 86). Briefly, the method consists of seeding from the same source a large number of parallel cultures using a small inoculum, harvesting them, and selecting for a specific phenotype. Although the distribution of the number of mutants per culture depends on the mode of replication and selection, the fraction of cultures
showing no selectable mutants (P0) does not. Since mutations are rare and
random, their number per culture should follow a Poisson distribution, for which
the null class occurs with probabilityP0 ⫽ e⫺
m共N1⫺N0兲, wheremis the rate of
mutation to the phenotype per strand copying andN1⫺N0is the absolute
amount of growth. Sincemis insensitive to selection, no correction of selection
bias is needed. However,mcan be sensitive to differences in plating efficiency or
to phenotypic mixing. The rate of mutation to substitutions per strand copying was calculated as
s/n/r⫽3m/Ts (10)
wherem⫽ ⫺(logP0)/(N1⫺N0). We obtained noi/n/rvalues (i.e., for indels)
because all mutations leading to the selectable phenotype were substitutions. An alternative to the null-class method is to use the entire distribution of the number
on November 8, 2019 by guest
http://jvi.asm.org/
of mutants per culture following theFmethod described by Drake (26). How-ever, this method requires that mutations are neutral and the replication mode is binary, so we did not use it.
RESULTS AND DISCUSSION
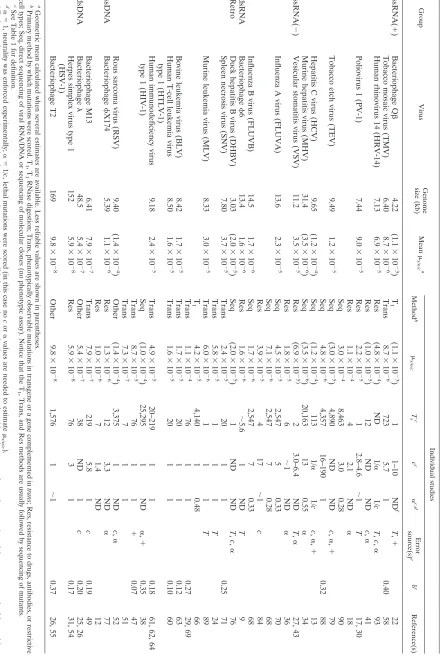
Mutation rates per cell infection.Table 2 shows mutation
rates, defined as the probability of a nucleotide substitution per
nucleotide per cell infection (s/n/c) obtained from equation 2.
For each of 37 studies, we provide the value of s/n/c and
information about the mutational target size (Tsfor
substitu-tions), the number of cell infection cycles (c), and the selection
correction factor (␣) (details of the calculations are in
“Calcu-lation of mutation rates per nucleotide per cell infection” in Appendix). The majority of these studies were originally de-signed to control for selection, such that all mutations were
neutral (␣ ⫽1) or lethal (c␣ ⫽1). In 6 of these 37 studies
selection was not controlled for, so we corrected for its effect.
The reliability of the mutation rate estimates increases asTs
increases, since mutation sampling becomes more
representa-tive. It also increases ascdecreases, because there is less time
for selection to act, and it increases if␣is known. Estimates
based on a lowTs, a largec, or an undetermined␣or suffering
from other problems are shown within parentheses and should be taken with caution. Also, it is clearly desirable that several independent estimates are available for each virus, and so we present average values where possible (since mutation rates vary by orders of magnitude, we used geometric means; i.e., we averaged in log scale). Finally, although the mutation rates in Table 2 refer to nucleotide substitutions, in some cases the mutation rate to indels has been measured and so we show
their contribution to the total rate (␦).
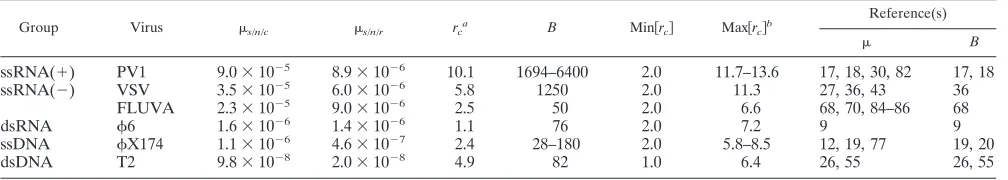
Mutation rates per strand copying and inference of
replica-tion modes.Mutation rates defined as the probability of a
nucle-otide substitution per nuclenucle-otide per strand copying (s/n/r) are
shown in Table 3. The availability of these estimates is limited because of the lack of information about the replication modes of many viruses. The values shown were derived using the
Luria-Delbru¨ck fluctuation test null-class method (equation
10; details of each calculation can be found in “Calculation of mutation rates per nucleotide per strand copying” in Appen-dix). Consistently, the mutation rates per strand copying are lower than those per cell infection. For some viruses, the two kinds of estimate are available and we can thus calculate the
number of copying cycles per infected cell asrc⫽ s/n/c/s/n/r
(Table 4). Further, by comparing the observedrcvalue with its
minimum and maximum possible values, we can infer the likely mode of replication. A replication event requires one cycle of strand copying in double-stranded DNA (dsDNA) viruses, and
hence min[rc]⫽1, which corresponds to the purely stamping
machine (linear) replication mode. Single-stranded RNA (ssRNA) viruses produce an intermediate strand of opposite polarity, most dsRNA viruses produce a single positive-sense strand which is later copied to reform dsRNA, and ssDNA
viruses are first copied to form dsDNA. Therefore, min[rc]⫽2
for all these virus types. This implies that, strictly speaking, fully linear replication is not possible in these viruses. By def-inition, the number of copying cycles per infected cell is
max-imal under binary replication and equals max[rc]⫽logB/log 2.
This holds for dsDNA viruses but for ssRNA, dsRNA, and
ssDNA viruses we must use max[rc] ⫽logB/log 2 ⫹1 since
there is an additional strand copying from a single strand. Previous work has shown that the mode of replication is close
to linear in bacteriophagesX174 (19) and6 (9), binary in
bacteriophage T2 (55), and probably binary in bacteriophage
during its lytic phase (26). Comparison ofrcwith max[rc] and
min[rc] (Table 4) confirms these results and also leads us to
suggest that replication is close to linear for influenza A virus (FLUVA), intermediate for vesicular stomatitis virus (VSV),
and close to binary for poliovirus 1 (PV-1). ForX174 and
VSV, we repeated this analysis but used only mutation rates per cell infection and per strand copying obtained from the same study (i.e., not comparing across studies). This gives
results consistent with those shown in Table 4 (rc⫽ 1.0 for
X174 and rc ⫽ 3.0 for VSV). Finally, in retroviruses, the
genomic positive-sense RNA is reverse transcribed to obtain
ssDNA, which is copied to form dsDNA, and hencerc⫽2 for
virus-mediated replication. This is followed by integration into the host chromosome, transcription, and possibly a variable
number of host cell replications, implying thatrcⱖ3. However,
[image:4.585.61.266.66.353.2]since proofreading and repair systems are present in these
FIG. 1. Selection-correction factor␣ as a function of time, mea-sured in cell infection cycles, for different values of the burst size (or viral yield)B.␣is mathematically defined in Methods (equation 2 and text). It allows us to quantify the loss in mutation frequency (fs) due to
selection and thus to account for selection bias in mutation rate esti-mates. The expected value of␣depends on whether mutation sam-pling is done in the absence of selection (top), as would be the case for a molecular clone sequencing experiment, or in the presence of selec-tion (bottom), as, for instance, in direct plaque sequencing. The ex-pected␣is plotted for eightBvalues: 3, 10, 30, 100, 300, 103, 3⫻103, and 104. Fitness effects of random single-nucleotide substitutions (de-fined in equation 8) were assumed to follow an exponential distribu-tion with mean E(sv)⫽0.12 plus a class of lethal mutations occurring with probabilitypL⫽0.3 (equation 7).
on November 8, 2019 by guest
http://jvi.asm.org/
TABLE 2. Virus mutation rates expressed as substitutions per nucleotide per cell infection ( s/n/c ) Group Virus Genome size (kb) Mean s/n/c a Individual studies Method b s/n/c T s c c c ␣ c , d Error source(s) e ␦c Reference(s) ssRNA( ⫹ ) Bacteriophage Q  4.22 (1.1 ⫻ 10 ⫺ 3 ) T 1 (1.1 ⫻ 10 ⫺ 3 ) 1 1–10 ND f T , ⫹ 22 Tobacco mosaic virus (TMV) 6.40 8.7 ⫻ 10 ⫺ 6 Trans 8.7 ⫻ 10 ⫺ 6 723 5.7 1 0.40 58 Human rhinovirus 14 (HRV-14) 7.13 6.9 ⫻ 10 ⫺ 5 Res (4.8 ⫻ 10 ⫺ 4 ) ND 1/ ␣ 1/ cT , c , ␣ 93 Res (1.0 ⫻ 10 ⫺ 5 ) 12 ND ND c , ␣ 41 Poliovirus 1 (PV-1) 7.44 9.0 ⫻ 10 ⫺ 5 Res 2.2 ⫻ 10 ⫺ 5 1 2.8–4.6 ⬃ 1 T 17, 30 Res 1.1 ⫻ 10 ⫺ 4 4 2.1 ND ␣ 18 Seq 3.0 ⫻ 10 ⫺ 4 8,463 3.0 0.28 90 Tobacco etch virus (TEV) 9.49 1.2 ⫻ 10 ⫺ 5 Seq (3.0 ⫻ 10 ⫺ 5 ) 4,890 ND ND c , ␣ , ⫹ 79 Seq 4.8 ⫻ 10 ⫺ 6 4,357 16–190 1 0.32 88 Hepatitis C virus (HCV) 9.65 (1.2 ⫻ 10 ⫺ 4 ) Seq (1.2 ⫻ 10 ⫺ 4 ) 113 1/ ␣ 1/ cc , ␣ , ⫹ 13 Murine hepatitis virus (MHV) 31.4 (3.5 ⫻ 10 ⫺ 6 ) Seq (3.5 ⫻ 10 ⫺ 6 ) 20,163 13 0.55 ␣ 34 ssRNA( ⫺ ) Vesicular stomatitis virus (VSV) 11.2 3.5 ⫻ 10 ⫺ 5 Res (6.9 ⫻ 10 ⫺ 5) 2 3.0–6.4 ND T , ␣ 27, 43 Res 1.8 ⫻ 10 ⫺ 5 6 ⬃ 1N D ␣ 36 Influenza A virus (FLUVA) 13.6 2.3 ⫻ 10 ⫺ 5 Seq 4.5 ⫻ 10 ⫺ 5 2,547 5 0.33 70 Seq 7.1 ⫻ 10 ⫺ 6 2,547 7 0.28 68 Res 3.9 ⫻ 10 ⫺ 5 41 7 ⬃ 1 c 84 Influenza B virus (FLUVB) 14.5 1.7 ⫻ 10 ⫺ 6 Seq 1.7 ⫻ 10 ⫺ 6 2,547 7 0.33 68 dsRNA Bacteriophage 6 13.4 1.6 ⫻ 10 ⫺ 6 Res 1.6 ⫻ 10 ⫺ 6 ⬃ 5.6 1 ND T 9 Retro Duck hepatitis B virus (DHBV) 3.03 (2.0 ⫻ 10 ⫺ 5 ) Seq (2.0 ⫻ 10 ⫺ 5 ) 1N D N D T , c , ␣ 76 Spleen necrosis virus (SNV) 7.80 3.7 ⫻ 10 ⫺ 5 Trans 2.4 ⫻ 10 ⫺ 5 20 1 1 0.25 71 Trans 5.8 ⫻ 10 ⫺ 5 11 1 T 24 Murine leukemia virus (MLV) 8.33 3.0 ⫻ 10 ⫺ 5 Trans 6.0 ⫻ 10 ⫺ 6 11 1 T 89 T 1 4.2 ⫻ 10 ⫺ 5 4,140 1 0.48 66 Trans 1.1 ⫻ 10 ⫺ 4 76 1 1 0.27 29, 69 Bovine leukemia virus (BLV) 8.42 1.7 ⫻ 10 ⫺ 5 Trans 1.7 ⫻ 10 ⫺ 5 20 1 1 0.12 63 Human T-cell leukemia virus type 1 (HTLV-1) 8.50 1.6 ⫻ 10 ⫺ 5 Trans 1.6 ⫻ 10 ⫺ 5 20 1 1 0.10 60 Human immunodeficiency virus 9.18 2.4 ⫻ 10 ⫺ 5 Trans 4.9 ⫻ 10 ⫺ 5 20–219 1 1 0.18 61, 62, 64 type 1 (HIV-1) Seq (1.0 ⫻ 10 ⫺ 4 ) 25,295 1 ND ␣ , ⫹ 0.35 38 Trans 8.7 ⫻ 10 ⫺ 5 76 1 1 ⫹ 0.07 47 Trans 7.3 ⫻ 10 ⫺ 7 71 1 5 1 Rous sarcoma virus (RSV) 9.40 (1.4 ⫻ 10 ⫺ 4 ) Other (1.4 ⫻ 10 ⫺ 4 ) 3,375 1 ND c , ␣ 52 ssDNA Bacteriophage X174 5.39 1.1 ⫻ 10 ⫺ 6 Res 1.3 ⫻ 10 ⫺ 6 12 3.3 ND ␣ 77 Res 1.0 ⫻ 10 ⫺ 6 7 1.4 ND 12 Bacteriophage M13 6.41 7.9 ⫻ 10 ⫺ 7 Trans 7.9 ⫻ 10 ⫺ 7 219 5.8 1 c 0.19 49 dsDNA Bacteriophage 48.5 5.4 ⫻ 10 ⫺ 7 Other 5.4 ⫻ 10 ⫺ 7 38 ND 1 c 0.20 25, 26 Herpes simplex virus type 1 (HSV-1) 152 5.9 ⫻ 10 ⫺ 8 Res 5.9 ⫻ 10 ⫺ 8 76 3 1 0.17 31, 54 Bacteriophage T2 169 9.8 ⫻ 10 ⫺ 8 Other 9.8 ⫻ 10 ⫺ 8 1,576 1 ⬃ 1 0.37 26, 55 a Geometric mean calculated when several estimates are available. Less reliable values are shown in parentheses. b Primary method by which mutations were scored. T 1,T 1 RNase digestion; Trans, phenotypically observable mutations in transgene or a gene complemented in trans ; Res, resistance to drugs, antibodies, or restrictive cell types; Seq, direct sequencing of viral RNA/DNA or sequencing of molecular clones (no phenotypic assay). Notice that the T 1, Trans, and Res methods are usually followed by sequencing of mutants. c See Table 1 for definition. d ␣⫽ 1, neutrality was enforced experimentally; ␣⫽ 1/ c , lethal mutations were scored (in this case no c or ␣ values are needed to estimate s/n/c ). e T , short, unknown, or nonrepresentative mutational target; c , unknown number of cell infection cycles; ␣ , selection was present and could not be corrected; ⫹ , a large portion of the mutants may be false positives due to sequencing errors, mutations occurring during transfection, or a poor mutation detection method. f ND, not determined.
on November 8, 2019 by guest
http://jvi.asm.org/
[image:5.585.77.517.71.728.2]additional host-mediated copying processes (50, 87), they probably contribute little to the overall mutation rate.
Analysis of general mutation rate patterns.One of the most
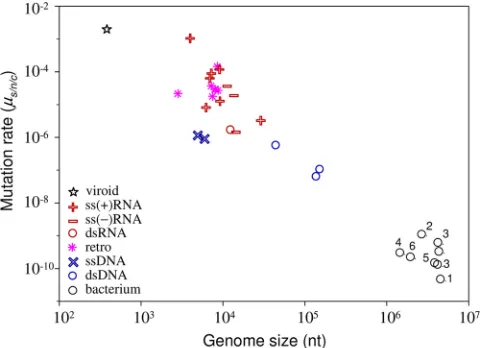
general results concerning mutation rates is Drake’s rule (26), which states that the mutation rate per genome per strand copying is roughly constant across DNA-based microorgan-isms, including DNA viruses. There is therefore an inverse relationship between genome size and the mutation rate per nucleotide. However, this rule has not previously been tested using mutation rates expressed per cell infection. This test is necessary because DNA viruses with large genomes show the lowest mutation rates per strand copying but also tend to use binary replication. Binary replication produces more mutations per cell, and this might compensate for the lower rate per strand copying. However, the plot of mutation rates per cell infection against genome size (Fig. 2) indicates that Drake’s rule is robust to the choice of units.
Another general observation is that RNA viruses have a higher mutation rate than DNA viruses (29, 45). However, based on observations that some ssDNA viruses can evolve rapidly, it was recently suggested that they may have mutation rates close to those of RNA viruses (32). We find that the
lowests/n/cestimate among RNA viruses is 1.6 ⫻10⫺6and
the highest among DNA viruses is 1.1⫻10⫺6. Hence, although
our data show no overlap between viral RNA and DNA mu-tation rates, the separation may be less than is often thought. Indeed, the transition between DNA and RNA viruses appears to be relatively smooth in Fig. 2 and can be partially explained by differences in genome size.
Another question is whether the negative correlation be-tween mutation rate and genome size observed for DNA-based microorganisms is also true for RNA viruses. The main
diffi-culty in testing this is that the range of genome sizes among RNA viruses is only around 1 order of magnitude and the mutation rate estimates have large errors. Despite this limita-tion, we found a significantly negative correlation between mutation rate and genome size among the combined
ssRNA(⫹), ssRNA(⫺), and dsRNA viruses (n ⫽11;
Spear-man correlation, ⫽ ⫺0.618 andP⫽0.043; Pearson
correla-tion using log10scales,r⫽ ⫺0.718 andP⫽0.013). However,
the mutation rate estimates for the viruses with the smallest
and largest genomes (bacteriophage Qand murine hepatitis
virus [MHV]), which are key for testing this correlation, have problems such as small mutational targets or difficulties in accounting for selection bias (see Appendix, “Calculation of mutation rates per nucleotide per cell infection”). Moreover, the statistical significance of the correlation is lost when the less reliable estimates (shown in parentheses in Table 2) are
removed (n ⫽ 8; ⫽ ⫺0.429, P ⫽0.289; r ⫽ ⫺0.583, P ⫽
0.129). Also, inclusion of retroviruses slightly weakens the
cor-relation (n ⫽ 18; ⫽ ⫺0.418,P ⫽ 0.084; r ⫽ ⫺0.550,P ⫽
0.018). Therefore, the current data are consistent with there being a negative relationship between mutation rate and ge-nome size among RNA viruses, but they do not strongly sup-port it.
In previous reviews, it has been proposed that the mutation rates of retroviruses tend to be lower than those of other RNA viruses (29, 59), despite HIV-1 being perhaps the prototypic fast-evolving RNA virus (4, 92). However, there is no evidence for a lower mutation rate in retroviruses (geometric mean
s/n/c⫽3.0⫻10⫺5) than in RNA viruses (s/n/c⫽2.2⫻10⫺5).
Therefore, there is currently no reason to attribute differences between the evolutionary rate of retroviruses and other RNA viruses to differences in mutation rates. It is also worth
men-TABLE 3. Virus mutation rates expressed as substitutions per nucleotide per strand copying (s/n/r)a
Group Virus s/n/r Ts Reference(s)
ssRNA(⫹) PV-1 8.9⫻10⫺6 1 82
ssRNA(⫺) VSV 6.0⫻10⫺6 6 36
FLUVA 9.0⫻10⫺6 2–5 85, 86
Measles virus (MV)b 4.4⫻10⫺5 ⬃7.5 81
dsRNA 6 1.4⫻10⫺6 ⬃5.6 9
ssDNA X174c 2.1⫻10⫺7 ⬃6.4 19
1.0⫻10⫺6 7 12
dsDNA 7.9⫻10⫺8 38 25, 26
T2 2.0⫻10⫺8 1,576 26, 55
a
All estimates were obtained using the fluctuation test, except for, where the rate per cycle of copying was calculated assuming binary replication (26).
b
Genome size, 15.9 kb. c
Geometric mean, 4.6⫻10⫺7
[image:6.585.42.541.80.183.2].
TABLE 4. Inference of replication modes from the two mutation rate units
Group Virus s/n/c s/n/r rc
a
B Min关rc兴 Max关rc兴
b Reference(s)
B
ssRNA(⫹) PV1 9.0⫻10⫺5 8.9⫻10⫺6 10.1 1694–6400 2.0 11.7–13.6 17, 18, 30, 82 17, 18
ssRNA(⫺) VSV 3.5⫻10⫺5 6.0⫻10⫺6 5.8 1250 2.0 11.3 27, 36, 43 36
FLUVA 2.3⫻10⫺5 9.0⫻10⫺6 2.5 50 2.0 6.6 68, 70, 84–86 68
dsRNA 6 1.6⫻10⫺6 1.4⫻10⫺6 1.1 76 2.0 7.2 9 9
ssDNA X174 1.1⫻10⫺6 4.6⫻10⫺7 2.4 28–180 2.0 5.8–8.5 12, 19, 77 19, 20
dsDNA T2 9.8⫻10⫺8 2.0⫻10⫺8 4.9 82 1.0 6.4 26, 55 26, 55
a
Ratio ofs/n/ctos/n/r.
b
LogB/log 2 for dsDNA viruses and logB/log 2⫹1 for all other viruses.
on November 8, 2019 by guest
http://jvi.asm.org/
[image:6.585.43.547.618.708.2]tioning that the high rate of evolution of HIV-1 is not ex-tremely different from that of other RNA viruses such as, for instance, FLUVA or foot-and-mouth disease virus (48).
Concerning the fraction of indels compared to total
muta-tions, we observe␦ ⫽0.10 to 0.40 (Table 2) with a mean of 0.24
and a median of 0.20. This is very similar to the estimated␦ ⫽
0.21 for a single viroid (37) and is also consistent with the value obtained for several DNA microbes (28). Although it has been suggested that indels are particularly frequent in some RNA viruses (58, 71), our review of the literature confirms that nucleotide substitutions are the most frequent type of sponta-neous mutations, being roughly four times more frequent than indels.
Conclusions and outstanding questions.Whether mutation
rates should be expressed per infected cell or per strand copy-ing depends on the questions becopy-ing addressed and the estima-tion method. In general, we see several advantages to using cell infection units. First, it is a natural definition of a viral gener-ation, making comparative analyses across different types of virus or between viruses and other organisms more meaning-ful. Second, most theoretical models in viral population dy-namics use this unit. For instance, this figure, together with the rate of infection of new cells, is used to calculate the proba-bility of specific mutations occurring within an infected indi-vidual (72) or to predict the outcome of lethal mutagenesis treatments (5). Third, it is more inclusive than the per strand copying rate, since it accounts for other sources of mutation, such as host-mediated editing and copying, or spontaneous damage of the viral nucleic acid. Fourth, it facilitates a clear conceptual separation between the error rate of a viral poly-merase and the mutation rate experienced by the virus. On the
other hand, although counting cell infection cycles might be easy for animal and bacterial lytic viruses, it is more difficult for persistent viruses, plant viruses, and viruses that integrate in the host genome (e.g., retroviruses and prophages). Also, the complete cell infection cycle includes the extracellular stage, but the duration of this stage can be extremely variable and often indeterminate.
As we have shown, selection can bias mutation rate esti-mates. Ideally, mutations in the target under study should be strictly neutral or lethal, such that the conversion from muta-tion frequencies to mutamuta-tion rates is straightforward (equa-tions 5 and 6). The method based on lethality, for instance, can be implemented by looking at substitutions that produce pre-mature stop codons, provided that no genetic complementa-tion or suppression of stop codons occurs (13), but mutacomplementa-tions introduced during PCR amplification need to be taken into account. Another possibility is to use drug dependence, a form of drug resistance in which the ability to grow in the absence of the drug is lost. These mutants can be identified by isolating drug-resistant mutants and assaying them for growth in the absence of the drug. We have also addressed the problem of correcting selection bias when lethality or neutrality is not guaranteed. The selection correction method proposed here can be used in general for converting mutation frequencies into mutation rates, but the calculation of the correction factor
␣depends on whether the sampling method is selection free
(Fig. 1). For instance, in molecular clone sequencing experi-ments, the efficiency with which mutants are PCR amplified, cloned, and sequenced will not depend on their fitness, and hence mutation sampling is nonselective. In contrast, in exper-iments where plaques are sequenced directly (i.e., without mo-lecular cloning), highly deleterious or lethal mutations will not be observable, and hence mutation sampling is selective. Our
choice of parameters for computing ␣ is based on previous
experimental work with a rhabdovirus (80), a potyvirus (6), a levivirus (23), a microvirus (23), and an inovirus (73). Impor-tantly, mutational fitness effects are well conserved across
these viruses [E(sv)⫽0.10 to 0.13,pL⫽0.2 to 0.4] (78), and,
given the diversity of this group, we can be relatively confident
that the model is realistic for most ssRNA(⫹), ssRNA(⫺), and
ssDNA viruses infecting animals, plants, or bacteria. In
con-trast, they are probably not accurate for large ssRNA(⫹)
vi-ruses (e.g., coronavivi-ruses) and dsDNA vivi-ruses, and the validity for retroviruses remains to be determined.
[image:7.585.43.284.69.243.2]There are several outstanding questions regarding the main evolutionary determinants of virus mutation. For instance, bio-chemical restrictions might not be sufficient to explain the error-prone nature of RNA virus replication, since fidelity can be increased through single amino acid replacements in the RNA polymerase (74). Also, to investigate the differences be-tween DNA virus and RNA virus mutation rates, more esti-mates for small DNA viruses are needed, particularly for eu-karyotic ssDNA viruses, which are the DNA viruses known to evolve fastest as measured by the number of substitutions that become fixed per year (46). The role played by error-prone host DNA polymerases in determining the mutation rate of DNA viruses is another interesting research avenue. For RNA viruses, it is still unclear whether there is a negative relation-ship between mutation rate and genome size analogous to Drake’s rule. As we have shown, the current data suggest a
FIG. 2. Relationship between mutation rate and genome size, with major virus groups indicated. Values for viroids and bacteria, the two adjacent levels of biological complexity, are also plotted. The mutation rate is expressed as the number of substitutions per nucleotide per generation, defined as a cell infection in viruses (s/n/c). We obtained
bacterial mutation rates from a previous study (57) and divided them by 1.46 to convert the total rate into a substitution rate, as previously suggested (27). 1,Bacillus; 2,Deinococcus; 3, enterobacteria; 4,
Helico-bacter; 5,Mycobacterium; 6,Sulfolobus. The star indicates the solitary
rate for a viroid (37), a subviral infectious agent constituted by small noncoding RNA. This rate is in substitutions per strand copying, since viroids do not have the equivalent of a generation.
on November 8, 2019 by guest
http://jvi.asm.org/
correlation, but we need more estimates for the largest and smallest RNA viruses to better test this hypothesis. The pos-sibility that the largest RNA viruses, namely, coronaviruses,
show low mutation rates is supported by evidence of 3⬘
exo-nuclease proofreading activity in their replicases (65). Further, the RNA genome with the highest mutation rate, a hammer-head viroid (37), is 1 order of magnitude smaller than the smallest RNA virus genomes. However, while all viroids have very small genomes, variability studies suggest that they do not all show extremely high mutation rates (33, 35). Finally, it is also unclear whether genome properties other than size, such as genome polarity or structure, can influence the viral muta-tion rate. dsRNA is less exposed to chemical damage than
ssRNA, and ssRNA(⫺) viruses pack their genetic material
densely with nucleoproteins, which might confer protection against mutation.
Finally, we suggest that future mutation rate studies should fulfill the following criteria: the number of cell infection cycles should be as low as possible, the mutational target should be large, and mutations should be neutral or lethal or a correction should be made for selection bias. Adhering to these criteria will help us to get a clearer picture of virus mutation patterns.
APPENDIX
Calculation of mutation rates per nucleotide per cell
infec-tion. (i) Bacteriophage Q.An A3G mutant with the
mu-tation at position 40 from the 3⬘end of the genome was
ob-tained by site-directed mutagenesis, plaque purified, and propagated with a high multiplicity of infection (MOI), such that each passage corresponded to a single infection cycle (22). The fraction of revertants to the wild type was measured after
each passage, up to 10 passages, by T1RNase fingerprinting. A
system of linear equations was used to estimate the fraction of revertant phage produced per passage, accounting for the se-lective disadvantage of the mutant. This gave a most likely
value offs/c⫽ 3.5⫻ 10⫺4 revertants per passage (2). Since
Ts⫽1, equation 2 givess/n/c⫽3⫻3.5⫻10⫺4⫽1.1⫻10⫺3.
Transitions are more likely than transversions. Therefore, this
might be an overestimation. Also, a mutation rate of 1.1 ⫻
10⫺3 s/n/c corresponds to more than four mutations per
ge-nome, which would probably impose an excessive mutational load for the virus. For this reason, this estimate was used initially by Drake (27) but was discarded later (29, 30).
(ii) TMV.Tobacco plants constitutively expressing the TMV
movement protein (MP) were inoculated with tobacco mosaic virus (TMV) (58). Since the viral MP gene was complemented intrans, selection on this gene was absent or weak (␣ ⬇1). Viruses were extracted at 3 days postinoculation, and individ-ual particles were isolated by infecting MP transgenic plants, which form local necrotic lesions. These individual clones were assayed for loss of function of the essential MP gene by inoc-ulating plants not expressing the MP transgene, and null
mu-tants were sequenced. The relevant parameters aref⫽0.038,
c⫽5.7, andL⫽804. Twenty-four out of 35 mutations were
indels. Assuming that all indels inactivated the gene and using
equation 3,i/n/c⫽0.038⫻24/35/5.7/804⫽5.7⫻10⫺6. For
substitutions, the fraction of total mutations that produce the null phenotype was unknown, and nonsense mutations were not observed. The authors used a correction factor of 4.78
derived from DNA-based microbes. According to this and
us-ing equation 2,s/n/c⫽0.038⫻4.78⫻11/35/5.7/804⫽1.2⫻
10⫺5. Alternatively, one can use the fraction of lethal
substi-tutions estimated in other viruses,pL⫽0.2 to 0.4. Using this to
estimate the fraction of substitutions that inactivate the TMV
MP protein and takingpL⫽0.3,Ts⫽3⫻804⫻0.3⫽723, we
find thats/n/c⫽3⫻0.038⫻11/35/5.7/723⫽8.7⫻10⫺6. The
two approaches yield similar results (we use the latter). The
corresponding indel fraction is␦ ⫽0.40.
(iii) Human rhinovirus 14.(a) A drug dependence mutation
was identified and introduced in a cDNA clone (93). Viruses recovered from this cDNA clone were grown and plated in the presence and absence of the drug to estimate the fraction of
revertants to drug sensitivity,f⫽1.6 ⫻10⫺4, and it was
as-sumed that all revertants were to the wild type (T⫽Ts⫽1)
(30). Since the mutant was drug dependent, it had to be grown in the presence of the drug, and thus revertants to the wild type
were lethal; i.e.,c␣ ⫽1. Therefore,s/n/c⫽3⫻1.6⫻10⫺4⫽
4.8⫻10⫺4. However, reversion to drug sensitivity could be due
to mutations other than reversion to the wild type (T⬎1), and
therefore this probably represents an upper-limit estimate.
(b) A drug resistance frequency of f ⫽ 4.0 ⫻ 10⫺5 was
obtained, and it was determined thatT⫽Ts⫽12, butcand
the fitness effects of the mutations were unknown (41). Using
equation 6, max[s/n/c] ⫽3⫻ 4.0⫻ 10⫺5/12⫽ 1.0⫻ 10⫺5.
Notice, however, that despite being an upper limit, this second estimate is much lower than the previous one.
(iv) Poliovirus 1.(a) A plaque-purified thermosensitive
mu-tant (C5310U) was plated at 33°C and 39°C to obtain the frequency of revertants to the wild type (17). This mutation
was approximately neutral at 33°C (␣ ⬇1), and only the
C-to-U reversion restored growth at 39°C (T ⫽ Ts ⫽ 1). The
average revertant frequency in three isolated plaques wasfs⫽
3.1 ⫻ 10⫺5 and c ⫽ 2.8 (30). Hence,
s/n/c ⫽ 3 ⫻ 3.1 ⫻
10⫺5/2.8⫽3.3⫻10⫺5. In a second experiment, the isolated
plaques were passaged once in liquid culture, and the observed
revertant frequency wasfs⫽ 2.3⫻ 10⫺5. In the first
experi-ment, the total number of viruses was 1.1⫻109, and therefore,
using equation 1 withN0⫽1, we obtainB⫽(1.1⫻109)1/2.8⫽
1,694. In the second experiment, a 10⫺5dilution was applied to
inoculate the liquid culture, and the average number of viruses
after growth was 8.4⫻109. Hence, the amplification factor was
(8.4⫻109)/(1.1⫻109)⫻105⫽7.6⫻105, which corresponds
to log (7.6⫻105)/log 1,694⫽1.8 additional infection cycles.
Hence, s/n/c ⫽ 3⫻ 2.3 ⫻ 10⫺5/(2.8⫹ 1.8) ⫽ 1.5 ⫻ 10⫺5.
Taking the geometric mean of the estimates from the two
experiments,s/n/c⫽2.2⫻10⫺5.
(b) The frequency of guanidine-resistant mutants appearing from a guanidine-dependent mutant was measured by plating the virus in the presence and absence of the drug (18).
Ap-proximately 2.0⫻106cells were inoculated with ca. 200 PFU,
yielding an average titer of 3.2⫻109PFU/ml in a total volume
of 4 ml after completion of the cytopathic effect (18, 27).
Hence, the burst size isB⫽ (3.2⫻109⫻ 4)/(2.0⫻106) ⫽
6,400, and using equation 1 we obtainc ⫽ log (4⫻ 3.2 ⫻
109/200)/log 6,400⫽2.1. Drake and Holland (30) gave a
sim-ilar value (c⫽2.5). Sequencing showed that the loss of
gua-nidine dependence could be conferred by each of the three
possible nucleotide substitutions at position G4804 or an A3
G substitution at position 4802 (T⫽ Ts⫽4). In two
on November 8, 2019 by guest
http://jvi.asm.org/
ments,fs⫽1.1⫻10⫺4andf
s⫽5.4⫻10⫺
4. Pooling all data,
fs ⫽ 3.2⫻ 10⫺4. Considering that mutations were probably
neutral, i.e., ␣ ⬇ 1 (although this was not demonstrated),
s/n/c⫽3⫻3.2⫻10⫺4/2.1/4⫽1.1⫻10⫺4.
(c) Viruses from transfection of cDNA transcripts were
pas-saged three times at an MOI of 1.0 (c⬇3.0), and individual
plaques were isolated (90). The 5⬘noncoding region and capsid
gene (L⫽2,821) were sequenced directly from reverse
tran-scription-PCR (RT-PCR) products (i.e., without molecular cloning). Thirteen mutations were observed in 18 plaque-de-rived viruses. For the wild-type virus, 13 mutations were found after sequencing 50,700 nucleotides in total. Hence, using
equation 5, we obtain min[s/n/c]⫽13/50,700/3⫽8.5⫻10⫺5.
No max[s/n/c] can be obtained since sampling was selective
(i.e., the assumption that all mutations are lethal is incompat-ible with plaque sequencing). The selection correction factor with selective sampling and assuming the same burst size as
above (B⫽1,694) is␣ ⫽0.28 forpL⫽0.3 and E(sv)⫽0.12.
Thus, the corrected estimate iss/n/c⫽min[s/n/c]/␣ ⫽8.5⫻
10⫺5/0.28⫽3.0⫻10⫺4.
(v) Tobacco etch virus (TEV). (a) Viruses isolated from
single necrotic lesions inChenopodium quinoa were used to
infect tobacco plants, and virions were extracted following the appearance of symptoms (79). A region encompassing genome positions 7808 to 9437 was amplified by high-fidelity RT-PCR,
and 83 molecular clones were sequenced (Ts⫽4,890). Four
substitutions were observed. Using equation 6, max[s/n/c] ⫽
3⫻4/83/4,890⫽3.0⫻10⫺5. Another reason to consider this
estimate as an upper limit is that the observed rate was close to the rate of RT-PCR errors.
(b) Tobacco plants constitutively expressing the TEV poly-merase gene NIb were inoculated with TEV (88). Since the
viral NIb gene was complemented intrans, selection on this
gene was probably absent or weak (␣ ⬇1). Samples from 20
plants were taken at different time points ranging from 5 to 60 days postinoculation and used for RT-PCR, cloning, and se-quencing. In total, 42 mutations (36 substitutions and 6 indels)
were identified in 472 NIb clones (L⫽1,536). Since the viral
genomic RNA is translated as a polyprotein, indels that modify the reading frame or nonsense mutations in the NIb gene prevent the correct expression of downstream genes (here, the capsid gene). As a first approach, we can focus on these pre-sumably lethal mutations. Of the 36 substitutions, two pro-duced premature stop codons. The number of possible such
mutations in the NIb gene isTs⫽251. Hence,s/n/c⫽2/251/
472 ⫽ 1.7⫻ 10⫺5. For indels,
i/n/c ⫽ 6/1,536/472⫽ 8.2 ⫻
10⫺6, and thus␦ ⫽0.32. Immediately after a stop codon
mu-tant appears in a cell, it can be replicated, transcribed, and packaged normally by the nonmutant proteins present in the cell, but the mutant should be unable to initiate a second infection cycle. Hence, the estimate is in per cell infection units. However, suppression of stop codons or complementa-tion between viruses at a high MOI could allow a subset of mutants to complete several infection cycles, leading to an overestimation of the mutation rate. RT-PCR errors constitute another source of overestimation. As an alternative approach, we can focus on presumably neutral mutations, which are all
except nonsense mutations and indels because NIb wastrans
complemented (Ts⫽1,536⫻3⫺251⫽4,357). The viral yield
per cell wasB⫽1,555 as determinedin vitrousing transfected
protoplasts, and it was estimated thatc⫽3.16 per day; hence,
cvaried from 16 to 190 (5 to 60 days). According to a
regres-sion analysis of the number of mutations on the number of cell
infection cycles done in the original publication,s/n/c⫽4.8⫻
10⫺6. The latter value is used. Taking into account that the first
approach was expected to produce an overestimation, the two estimates are reasonably consistent.
(vi) Hepatitis C virus.Over 15,000 molecular clones of the
E1-E2 and NS5A regions (L⫽472 andL⫽743, respectively)
obtained from patient serum samples were sequenced. The observed number of nonsense mutations was divided by the number of possible nonsense substitutions in these genes,
which wasTs⫽113 on average (13), yielding s/n/c⫽ 1.2⫻
10⫺4. As above, this estimate assumes that all observed
non-sense mutations are truly lethal and should be taken as an upper-limit value because we cannot exclude the suppression of stop codons, complementation, or RT-PCR errors.
(vii) Murine hepatitis virus.Viruses were recovered from a
cDNA clone by transfection, seeded into fresh cells, passaged once in standard liquid culture at an MOI of approximately 0.01, plaque purified, and passaged twice plaque to plaque (34). Six plaques were picked, amplified by infecting liquid cultures, and used for direct sequencing (i.e., without molecu-lar cloning). It was estimated that one infection cycle was equivalent to 8 h of growth and, based on this, that the total
number of cell infection cycles wasc⫽13. For the wild-type virus,
three mutations were found after sequencing 120,978 nucleotides
in total. Hence, using equation 5, we obtain min[s/n/c] ⫽
3/120,978/13⫽1.9 ⫻10⫺6, whereas no max[
s/n/c] can be
ob-tained because mutation sampling was selective. To provide a more accurate estimate, we can use the selection correction method. Plaque-to-plaque passages constituted approximately
two-thirds of the total passage time (c1 ⫽ 13 ⫻ 2/3 ⫽ 8.7),
although the exact fraction was not provided. Selection is typically relaxed under this passage regimen, and assuming that all
muta-tions except lethal ones accumulated neutrally, we haves/n/c⫽
min[s/n/c]/(1⫺pL). This defines a correction factor␣1⫽1⫺pL
for this phase. For the standard liquid culture phase (c2⫽4.3
cycles), the correction factor with selective sampling assuming
thatB⫽600 to 700 (42),pL⫽0.3, and E(sv)⫽0.12 is␣2⬇0.26.
Using the weighted average to combine␣1and␣2, we obtain␣ ⫽
(0.7 ⫻ 8.7 ⫹ 0.26 ⫻ 4.3)/(8.7⫹ 4.3) ⫽ 0.55. Therefore, the
corrected estimate of the mutation rate iss/n/c⫽1.9 ⫻10⫺6/
0.55⫽3.5⫻10⫺6. Notice, however, that our parameterization of
the distribution of mutational fitness effects was based on viruses with genome sizes smaller than those of coronaviruses and thus might not be appropriate here. Also, there is some uncertainty in the number of cell infection cycles elapsed. For these reasons, the estimate should be taken with caution.
(viii) Vesicular stomatitis virus.(a) The frequency of
resis-tance to a monoclonal antibody was measured by plating clonal viral pools or viruses resuspended from plaques in the pres-ence of the antibody (43). Mutations were assumed to be
neutral. Virus titers averaged 4.2⫻1011PFU/ml and 3.7⫻107
PFU/ml for clonal pools and resuspended plaques, respectively
(27). Plating 0.1 ml of these stocks yieldedf⫽1.7⫻10⫺4and
f ⫽ 2.3⫻ 10⫺4, respectively. Sequencing showed that there
were two possible G 3 A transitions conferring resistance
(T⫽Ts⫽2). Under conditions that restrict viral diffusion,B⫽
166 for this cell type (14), and B⫽ 1,250 in liquid medium
on November 8, 2019 by guest
http://jvi.asm.org/
under standard conditions (36). Hence, the formation of a
plaque would require approximately log (3.7⫻107⫻0.1)/log
166⫽ 3.0 cell infection cycles, and an additional log (4.2 ⫻
1011⫻0.1)/log 1,250⫽ 3.4 cycles would have taken place in
clonal pools. Accordingly,s/n/c⫽3⫻2.3⫻10⫺4/3/2⫽1.2⫻
10⫺4and
s/n/c⫽3⫻1.7⫻10⫺
4/(3⫹3.4)/2⫽4.0⫻10⫺5for
the resuspended plaques and the clonal pools, respectively,
giving a geometric mean ofs/n/c⫽6.9⫻10⫺5. Since the only
mutations scored were transitions, which are more likely than transversions, and since neutrality was not guaranteed, this value might be an overestimation.
(b) The average monoclonal antibody resistance frequency obtained from many small cultures undergoing one cell
infec-tion cycle or fewer was determined (36), giving f/c⫽ 3.5 ⫻
10⫺5. It was assumed thatT⫽T
s⫽6 from references cited in
reference 36. These substitutions were probably close to
neu-tral (␣ ⬇1), although this was not directly shown. Under this
assumption,s/n/c⫽3⫻3.5⫻10⫺5/6⫽1.8⫻10⫺5. The data
from this experiment can also be used to estimate the mutation rate per strand copying using the fluctuation test null-class method (see below).
(ix) Influenza virus A. (a) A single viral plaque was
iso-lated and repiso-lated to isolate new plaques (70). The
consen-sus sequence of gene NS (L⫽849,Ts⫽ 849⫻3⫽2,547)
was obtained for the parental and derived plaques after two amplification passages by direct sequencing of the purified
RNA: 3fs/Ts⫽7.6⫻10⫺5, andc⫽5. Hence, from equation
5, min[s/n/c] ⫽ 7.6 ⫻ 10⫺5/5 ⫽ 1.5 ⫻ 10⫺5, whereas no
max[s/n/c] can be obtained because mutation sampling was selective. The estimated selection correction factor using
the exponential plus lethal class model with E(sv) ⫽ 0.12,
pL⫽0.3,c⫽5, selective sampling, andB⬇50 as estimated
in another work (68) is␣ ⫽0.33. Thus,s/n/c⫽1.5⫻10⫺5/
0.33⫽4.5 ⫻10⫺5.
(b) The same method as in the study described above (70)
was used, giving 3fs/Ts⫽1.4⫻10⫺5andc⫽7 (48 h
postin-oculation with a generation time of 7 h, as estimated from one-step growth curves; note that the estimated burst size is
B⫽ 50 as shown in Fig. 2 of the original publication) (68).
Hence, min[s/n/c]⫽2.0⫻10⫺6. The estimated selection
cor-rection factor using the exponential plus lethal class model
with E(sv)⫽0.12,pL⫽0.3,c⫽7, selective sampling, andB⫽
50 is␣ ⫽0.28. Thus,s/n/c⫽2.0⫻10⫺6/0.28⫽7.1⫻10⫺6.
(c) Single plaques were isolated after 3 days of growth in cell cultures and used to infect the allantoic cavities of chicken eggs (84). Viruses were harvested after 2 days and plated in the presence and absence of amantadine to score resistant viruses.
From 10 independent experiments, the averagefvalues were
4.2⫻10⫺4and 1.8⫻ 10⫺3for H1N1 and H2N2 genotypes,
respectively. Amantadine resistance was conferred by four
dif-ferent nucleotide substitutions (T⫽Ts⫽4), which were
prob-ably neutral (␣ ⬇1). In the original publication, the mutation
rate per strand copying was estimated by assuming binary rep-lication, but this assumption does not seem to be justified. According to other authors (68) the virus completes a cell
infection cycle in ca. 7 h. Thus, after 5 days of growth,c⫽17.
Thus,s/n/c⫽3⫻4.2⫻10⫺4/17/4⫽1.9⫻10⫺5for H1N1 and
s/n/c⫽7.9⫻10⫺5for H2N2, with the geometric mean being
3.9⫻10⫺5.
(x) Influenza virus B. This estimate for influenza virus B
comes from one same study as FLUVA estimate b (68). Here,
3fs/Ts⫽4.0⫻10⫺6andc⫽7. Hence, min[
s/n/c]⫽5.7⫻10⫺
7
and max[s/n/c]⫽4.0⫻10⫺6. Using the exponential plus lethal
class model to correct for selection bias as in FLUVA estimate
b, we obtain␣ ⫽0.33 ands/n/c⫽1.7⫻10⫺6.
(xi) Bacteriophage6.An amber mutant was grown in
am-ber suppressor cells and plated onto normal (nonpermissive) cells to score revertants (9). The analysis of the number of
revertants arising from single bursts (c⫽1) yielded 296
mu-tants in 1,306,864 bursts and B ⫽ 76. Thus, f/c ⫽ 296/
1,306,864/76⫽3.0⫻10⫺6. However,T was not determined.
Discarding indels, there are eight possible single mutations changing an amber stop codon to a non-stop codon. However, some might be lethal and hence not observable. For a fraction
of lethal substitutions ofpL⫽0.2 to 0.4,T⫽Ts⫽4.8 to 6.4.
Assuming no selection against viable revertants and taking
Ts ⫽ 5.6, s/n/c ⫽ 3 ⫻ 3.0 ⫻ 10⫺6/5.6 ⫽ 1.6 ⫻ 10⫺6. The
undeterminedTsvalue could lead to a maximal
underestima-tion of 5.6-fold and a maximal overestimaunderestima-tion of 1.4-fold.
Al-though the E(sv) values of the reversions were unknown, this
should not introduce bias here becausec⫽1. Data from this
experiment can also be used to obtain an estimate of the mutation rate per strand copying free of selection bias using the fluctuation test null-class method (see below).
(xii) Duck hepatitis B virus.The frequency of revertants of
a single deleterious nucleotide substitution (G1198A) was studied in viruses obtained from cells transfected with a cDNA clone (76). Ducklings were inoculated with the recovered
vi-ruses and the wild type at a 104:1 excess of mutants. At 25 days
postinoculation, the ratio of revertants to wild type was ob-tained by molecular clone sequencing (revertants and the wild type were distinguishable by a neutral molecular marker at another site). This ratio was 0.6, and, correcting for the initial
excess of mutants, the revertant frequency wasfs⫽6.0⫻10⫺5.
Thisfsvalue should equal the initial frequency of revertants in
the inocula plus the frequency of new revertants that appeared during replication of the mutant before the latter was
outcom-peted. It was estimated that, at day 25, fswas 4- to 23-fold
higher than the initialfs. Hence, the initialfsranged from 0.3⫻
10⫺5to 1.5⫻10⫺5. Multiplying by three to get the mutation
frequency to any of the three nucleotides and taking the
geo-metric mean of the interval bounds,c⫻ s/n/c⫽2.0⫻10⫺5.
Since the inoculum came directly from transfected cells, we can assume that the inoculated viruses had undergone
approxi-mately one cell infection cycle and thus that s/n/c ⫽ 2.0 ⫻
10⫺5. The methods used to obtain this estimate are indirect,
and thus the value should be taken with caution.
(xiii) Spleen necrosis virus (SNV). (a) A retroviral vector
containing thelacZ␣-complementation gene region as a
neu-tral mutational target was used to score null mutations appear-ing durappear-ing a sappear-ingle infection cycle (71). Out of 16,867 clones, 37
carried null mutations in the lacZ␣-complementation gene
region based on the white/blue assay of transformed
Esche-richia colicolonies. Sequencing showed that 11 were nucleo-tide substitutions (including two nonsense mutations), 24 were
indels (5 frameshifts), and 2 were 15-base G3A
hypermuta-tions. The coding region thelacZregion is 258 bases long (280
bases including the promoter region), but the mutational tar-get is smaller because many mutations will not lead to the null