University of Southern Queensland
Development and Characterisation of a Modified Smartphone Camera
for Determining UVA Aerosol Optical Depth
A Dissertation submitted by
Damien Igoe, BAppSci, BSc (Hons), BSpecEd, DipEd, MEd, MSc
For the award of Doctor of Philosophy
Supervisor: Professor Alfio Parisi
Associate Supervisor: Associate Professor Brad Carter
I
Abstract
This research evaluates a specifically-written, calibrated and validated Android app installed on an inexpensive smartphone with bandpass and neutral density filters attached for measuring and quantifying direct solar UVA irradiances and aerosol optical depth. Currently, the equipment normally used to perform these observations is specialised, expensive and is available at a relatively small number of sites. The continuing proliferation of and the increasing number and type of sensors included in smartphones makes feasible the use of specifically designed apps as a cost effective supplementary means of monitoring direct ultraviolet A solar irradiance and air quality for research, education and community outreach purposes.
Most aerosols from both human and natural sources attenuate the UV wavebands; this has far reaching implications for UV irradiance studies and by extension, important public awareness metrics such as the UV index (UVI). Combined, closer observations and subsequent studies of aerosol optical depth and UVA irradiance are critical given that in recent studies, UVA irradiances have been found to be a major agent in skin cancer, photoaging and eye conditions. Therefore, this research involved the development, calibration and validation of a specifically written Android app on a smartphone in separate environments and across different seasons.
III
Certification of Dissertation
I certify that the ideas, experimental and field work results, analyses, software and conclusions reported in this dissertation are entirely my own effort, except where otherwise acknowledged. I also certify that the work is original and has not been previously submitted for any other award, except where otherwise acknowledged.
____________________________ __________ Signature of Damien Igoe
Endorsement
____________________________ __________ Signature of Professor Alfio Parisi, Principal Supervisor
____________________________ __________
IV
Acknowledgements
First and foremost, I wish to extend my utmost gratitude and genuine admiration for my Principal Supervisor, Professor Alfio Parisi, and my Associate Supervisor, Associate Professor Brad Carter – Their knowledge, patience, wisdom and kindness have been unparalleled, how they dealt with me as their student would be the subject of another thesis.
Many thanks are also extended to Dr. Leigh Brookshaw, whose expertise in and passion for Android programming assisted greatly. Also, gratitude is extended to Oliver Kinder, of the Faculty of Sciences workshop, whose expertise and dedication are appreciated.
The participants of the question and answer website, StackOverflow.com have kindly assisted me in understanding the structure and techniques of Android programming.
Thanks are also extended to owners of the private residences in Emerald and Plainland, Queensland for allowing me to conduct observations in their backyards. A special thanks goes to their pet dogs for keeping me company throughout the 3 hour experiments.
V
Contents
Abstract ... I Certification of Dissertation ... III Acknowledgements ... IV List of Figures ... VIII List of Tables ... XIII
1. Introduction ... 1
1.1 Rationale ... 2
1.2 Hypothesis ... 4
1.3 Objectives ... 5
1.4 Dissertation Outline ... 7
2. Solar UV ... 8
2.1 What is Ultraviolet Radiation? ... 9
2.2 Ultraviolet Radiation in the Atmosphere ... 10
2.3 Effects of Ultraviolet Radiation on the Biosphere ... 13
2.4 Effects of Ultraviolet Radiation on Human Health ... 14
2.4.1 Vitamin D Synthesis ... 15
2.4.2 Skin Cancers ... 17
2.4.3 Photoaging ... 19
2.4.4 Eye Conditions ... 20
2.4.5 Immune Response ... 21
2.5 Chapter Discussion ... 22
3. Aerosols ... 23
3.1 Attenuation of Radiation due to Aerosols ... 24
3.1.1 Visible ... 27
3.1.2 Ultraviolet ... 28
VI
3.3 Aerosols over Australia ... 31
3.4 Chapter Discussion ... 32
4. Measurement ... 33
4.1 Current Measurement Techniques ... 34
4.2 Image Sensors ... 37
4.2.1 Noise Summary ... 40
4.3 Chapter Discussion ... 41
5. Experimental Results ... 42
5.1 Standard Equipment Used ... 43
5.2 Smartphone Selection ... 46
5.2.1 Lens Attenuation ... 47
5.2.2 Lens Fluorescence ... 49
5.2.3 Noise Tests ... 49
5.3 Feasibility Tests ... 50
5.3.1 Methodology ... 50
5.3.2 Results ... 53
5.4 Calibration Field Tests ... 56
5.4.1 Methodology ... 56
5.4.2 Results ... 60
5.4.3 Signal to Noise Ratio ... 81
5.5 Discussion ... 82
5.6 Chapter Summary ... 85
6. Android Automation ... 87
6.1 Android Schematics ... 88
6.2 Android Requirements to Calculate Direct Irradiance and AOD ... 90
VII
6.4 Calibration and Validation test results ... 99
6.4.1 Locations ... 99
6.4.2 Potential sources of error ... 99
6.4.3 Recalibration results ... 100
6.4.4 Validation results ... 103
6.5 Chapter Discussion ... 107
7. Conclusions ... 108
7.1 Conclusions ... 109
7.2 Future Research ... 113
VIII
List of Figures
Figure 1: The gamma ray to microwave portion of the electromagnetic spectrum, with emphasis on the ultraviolet (UV) wavebands (Soehnge et al. 1997)... 9 Figure 2: Example of solar UV spectrum data collected by a Bentham DmC300 spectroradiometer on a clear day for a solar zenith angle of 11.2°. The troughs in the data are due to atmospheric Fraunhofer absorption. ... 10 Figure 3: Labelled sections of the ozone absorption cross section spectrum for the UV, visible and infrared wavebands (Orphal, 2003). ... 11 Figure 4: Action spectrum for the synthesis of previtamin-D3 in human skin (CIE, 2006). The response from wavelengths greater than 330 nm are far lower than what is shown. ... 16 Figure 5: Action spectra for erythema (solid line) and fish melanoma (dashed line) (CIE, 1998; Setlow et al. 1993). ... 18 Figure 6: Relative UV absorption and transmission into the human eye
X Figure 23: Calibration regression between the Microtops derived ln(I) and the Huawei U8180 derived cosine grey for observations made at 340 nm. ... 65 Figure 24: Calibration regression between the Microtops derived ln(I) and the LG Optimus derived cosine grey for observations made at 340 nm. ... 66 Figure 25: Calibration regression between the Microtops derived ln(I) and the LG Optimus derived cosine grey for observations made at 380 nm. Error bars too small to be seen. ... 67 Figure 26: Calibration regression between the Microtops derived ln(I) and all smartphones derived cosine grey for observations made at 340 nm. ... 68 Figure 27: Calibration regression between the Microtops derived ln(I) and all smartphones derived cosine grey for observations made at 380 nm. ... 69 Figure 28: Calibration regression between the Microtops derived ln(I) and all smartphones derived cosine grey observations... 70 Figure 29: ln(I) comparison for the Samsung Galaxy 5 observed at 340 nm. The one-to-one equivalence line is in bold. ... 72 Figure 30: ln(I) comparison for the Huawei U8180 observed at 340 nm. The
one-to-one equivalence line is in bold... 72 Figure 31: ln(I) comparison for the LG Optimus observed at 340 nm. The
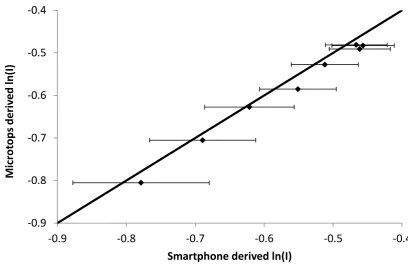
one-to-one equivalence line is in bold (Igoe et al. 2013c). ... 73 Figure 32: ln(I) comparison for all observations at 340 nm. The one-to-one equivalence line is in bold. ... 73 Figure 33: ln(I) comparison for the Samsung Galaxy 5 observed at 380 nm. The one-to-one equivalence line is in bold. ... 74 Figure 34: ln(I) comparison for the LG Optimus observed at 380 nm. The
one-to-one equivalence line is in bold (Igoe et al. 2013c). ... 75 Figure 35: ln(I) comparison for the combined smartphone observations at 380 nm.
XIII
List of Tables
2
1.1 Rationale
The measurement of the optical effects of atmospheric aerosols is critical in solar UV (290 nm to 400 nm) studies, particularly when measured from the surface, as variations in the amount and types of aerosols present a major source of uncertainty in the modelling of the solar UV. Most aerosols, whether originating from natural or artificial sources attenuate UV wavelengths to varying degrees (Mitchell et al. 2010; Radhi et al. 2010; Leitzell 2008; Kokhanovsky 2008; Kalashnikova et al. 2007; Rosales et al. 2006; Parisi et al. 2004; Meloni et al. 2003; Mitchell and Forgan 2003; Dubovik et al. 2002; Lenoble et al. 2002; Torres et al. 2002; Morys et al. 2001; Wenny et al. 2001; Horvath 1993). Changes in UV radiation are of major concern for human health, agriculture, ecosystems and terrestrial and aquatic vegetation and so requires an improved understanding (Anton et al. 2009; Ialongo et al. 2008; Kokhanovsky 2008; Paulos et al. 2007; Kalashnikova et al. 2005; Parisi et al. 2004; Meloni et al. 2003; Dubovik et al. 2002; Lenoble et al. 2002; Torres et al. 2002; Wenny et al. 2001; Bigelow et al. 1998).
3 The most common methods to measure aerosol optical depth are satellite observations and specialised ground based equipment, including sunphotometers and sky radiometers (Mitchell et al. 2010; Radhi et al. 2010; Ialongo et al. 2008; Parisi et al. 2004; Queface et al. 2003; Morys et al. 2001). This ground-based equipment is often expensive, heavy and large, hence inaccessible to the wider community and schools (Morys et al. 2001). One of the most portable means of measurement is the hand held Microtops sunphotometer (Morys et al. 2001). However, the cost of the sunphotometer places this out of reach of schools and the general public.
Complementary metal oxide semiconductor (CMOS) image sensors have been in ‘off the shelf’ applications for many years (Hoffman et al. 2005). In recent years, there have been improvements in smartphone camera design, particularly with backside illumination (BSI) and back thinning (PhysOrg 2011; Scott 2011;). Backside illumination is where image sensor pixel circuitry is placed ‘behind’ the silicon photodiode (Scott 2011). The silicon photodiode is then ground down or ‘back thinned’ allowing increased sensitivity to shorter wavelengths, including UV (PhysOrg 2011; Scott 2011).
4 hence understanding of scientific applications (Westly 2009; Paulos et al. 2007). Smartphones are thus the technology of choice for this study due to their growing ubiquity and ease-of-use of the integrated communications and image sensing technologies (Westly 2009; Avvenuti and Vecchio 2008; Paulos et al. 2007).
1.2 Hypothesis
This dissertation aims to test the hypothesis that smartphone cameras coupled with narrow-band UV filters can be used to quantify the total UVA direct irradiance and the UV aerosol optical depth.
5
1.3 Objectives
This study focuses on delivering low-cost, easy-to-use solar UVA measurements using smartphones, to enable widespread UVA aerosol optical depth monitoring. UV aerosol optical depth (AOD) is a measure of the relative attenuation of incident solar UV irradiances (Bodhaine et al. 1999).
Smartphones will be developed as AOD sensing devices by:
Testing and evaluating the smartphone image sensor’s ability to detect UVA radiation. This follows on from an investigation by Tetley and Young (2008) that determined that it is possible for standard mass-market image sensors to detect UV radiation.
Characterising the image sensor’s intensity (grayscale) response to increasing direct irradiance at discrete UVA wavelengths, using both artificial (monochromator) and natural (solar) UV sources.
Calibrating the image sensor intensity response with respect to direct UVA irradiance, with the use of a sunphotometer for solar measuements.
Validating the calibrated image sensor intensity response to ensure the correct mathematical relationship exists between this and the incident irradiation.
Calibration and validation of UVA aerosol optical depth at 340 nm and 380 nm.
6 The research offers a means to further improve the accuracy of UV models, through the potential of a wider network of AOD measurements, with the use of prolific smartphones. The availability of this capability on a smartphone system makes aerosol optical depth measurements accessible to the wider community, particularly schools.
The overall objectives for this research are:
1. Determining the feasibility and extent that a smartphone camera can detect useful UV readings throughout the UVA waveband, particularly the focus wavelengths for AOD measurements of 340 nm and 380 nm.
2. Developing and testing of a system using the smartphone’s sensor array alongside the Android platform to obtain reliable and useful UVA aerosol optical depth.
7
1.4 Dissertation Outline
Chapter 2 provides an overview of the properties of UV radiation, atmospheric attenuation and its effects on the biosphere and on human health. Chapter 3 details an overview of how aerosols, both anthropogenic and natural, attenuate incoming solar radiation in the visible and ultraviolet wavelengths.
Chapter 4 gives a description of current standard aerosol and UV measurement equipment, calibration requirements and techniques. These are compared and contrasted with smartphone image sensors. Finally, an analysis of image sensor noise is presented.
Laboratory tests, including smartphone image sensor characterisation and lens and filter transmission in the UV waveband are detailed in Chapter 5. Also in this chapter are field calibration and verification tests of UVA direct irradiance and UVA aerosol optical depth from selected smartphones in comparison with a sunphotometer.
Android algorithm development and testing are presented in Chapter 6. This
9
2.1 What is Ultraviolet Radiation?
Ultraviolet (UV) radiations are wavelengths of light starting from the boundary of ionizing and non-ionizing radiation at 100 nm to the boundary with the visible spectrum at 400 nm (Jegou et al. 2011; Parisi et al. 2004; Soehnge et al. 1997). UV radiation is non-ionizing radiation with shorter wavelengths and greater energy per photon than visible and infra-red light (Soehnge et al. 1997). The UV waveband is divided further, as shown in Figure 1, the specific waveband of interest in this research is UVA (320 nm – 400 nm).
Figure 1: The gamma ray to microwave portion of the electromagnetic spectrum, with emphasis on the ultraviolet (UV) wavebands (Soehnge et al. 1997).
10
2.2 Ultraviolet Radiation in the Atmosphere
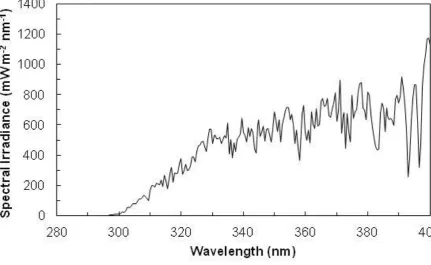
[image:25.595.134.566.400.665.2]All wavebands of ultraviolet radiation emanate from the sun, but not all reach the Earth’s surface. Solar UV wavelengths up to approximately 295 nm (UVC and some UVB) are absorbed by the atmosphere’s diatomic oxygen (O2) and ozone (O3), as can be seen in a sample clear sky solar UV spectrum at a solar zenith angle of 11.2° (Figure 2). The dips in the curve are due to Fraunhofer absorption (Jegou et al. 2011; Young, 2009; Parisi et al. 2004). Despite UVB being heavily absorbed by ozone and being strongly scattered by atmospheric molecules, a small proportion still reaches the Earth’s surface (Jegou et al. 2011; Seinfeld and Pandis, 2006; Parisi et al. 2004). UVA radiation accounts for approximately 90-95% of UV radiation reaching the Earth’s surface (Jegou et al. 2011; Parisi et al. 2004; Wang et al. 2001).
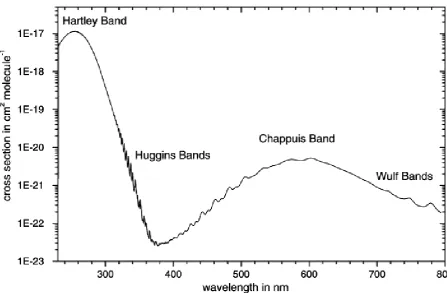
11 Ozone absorption is divided into 4 phases that approximately correspond to the UVB (Hartley), UVA (Huggins), visible (Chappuis) and infrared (Wulf) wavebands (Orphal, 2003). The least absorption occurs near 380 nm and throughout most of the UVA waveband, resulting in UVA being relatively insensitive to ozone layer fluctuations (Figure 3).
[image:26.595.114.562.251.544.2]
12 The actual amount of UV radiation reaching the Earth’s surface is highly dependent on a number of factors including:
The latitude and altitude of the observation point which affect the intensity of UV radiation (Jegou et al. 2011; Siani et al. 2010; Young, 2009; Siani et al. 2008; Kamran and Khan, 2007; Kimlin, 2008; Parisi et al. 2004: Diffey, 2002; Diffey, 1991).
The solar zenith angle (SZA) is dependent on the date and time of the day observations are made. The greater the SZA, the greater the air mass or path length through the atmosphere the radiation must traverse. Increasing the path length increases scattering and absorption of UV radiation (Jegou et al. 2011; Siani et al. 2010; Young, 2009; Kimlin, 2008; Siani et al. 2008; Parisi et al. 2004; Diffey, 2002; Diffey, 1991).
Absorption and scattering due to aerosols and clouds, affecting the measured intensity of UV, particularly as the aerosol and gaseous component is not visible to the naked eye (Jegou et al. 2011; Young, 2009; Kimlin, 2008; Parisi et al. 2004: Meloni et al. 2003; Diffey, 2002; Diffey, 1991).
Molecular or Rayleigh scattering due to the chemical constituents of the atmosphere, primarily nitrogen and oxygen gas (Jegou et al. 2011; Young, 2009; Kimlin, 2008; Parisi et al. 2004: Meloni et al. 2003; Diffey, 2002; Diffey, 1991).
13 Earth-sun distance, as the Earth is closest to the sun during the Southern Hemisphere summer, UV irradances can be up to 15% higher than those experienced in a similar Northern Hemisphere location (Gies et al. 2004; Gies, 2003).
2.3 Effects of Ultraviolet Radiation on the Biosphere
Ultraviolet radiation is a critical component in the stability of biogeochemical cycles and ecosystems (Zlater et al. 2012; Ballare et al. 2011; Zepp et al. 2011; Hader et al. 2007). Most research with these interactions focuses on the ozone induced fluctuations in UVB radiation reaching the Earth’s surface, which plants are sensitive to due to being immobile (Ballare et al 2011; Reddy et al. 2010). A critical factor is that plant cell proteins and DNA strongly absorb UVB resulting in photoexcitation and potential damage in these structures (Lidon et al. 2012; Zlater et al. 2012; Ballare et al. 2011; Piri et al. 2011; Reddy et al. 2010; Diffey, 1991). Plant species respond differently, some benefit from greater UV exposure, whereas some are unaffected, depending on any inherent UVB protection adaptation; however, many species are negatively affected, including food crops (Lidon et al. 2012; Piri et al. 2011; Reddy et al. 2010; Kakani et al. 2003; Webb, 1998; Diffey, 1991).
14 development and reproduction, all critical particularly for agricultural yield (Reddy et al. 2010; Kakani et al. 2003).
Research has indicated that increased UVB radiation results in a strong negative influence on aquatic species and ecosystems, particularly at the base level producers, such as phytoplankton (Hader et al. 2011; Diffey, 1991). Phytoplankton reacts to increased UVB radiation by moving downward in the water column, this results in less photosynthesis as deeper water is darker (Diffey, 1991). In this way, animals are indirectly affected by disruptions in the food chain (Ballare et al. 2011; Hader et al. 2011). Fish in shallow aquaculture environments have also exhibited skin lesions and cataracts from prolonged UV exposure (Webb, 1998).
Animal species are also directly affected by prolonged and changing UV exposure (Hader et al. 2011). There are several parallels between UV exposure effects on many mammalian species and humans (Webb, 1998). Domestic animals have exhibited squamous cell carcinomas on the eyes and unpigmented nostrils, lips and ears due to prolonged UV radiation exposure (Cullen et al. 2002; Webb, 1998). UV radiation immune deficiencies, cataracts and bone metabolism have been found to occur in many species of animals, particularly mammals (Hockwin et al. 1999; Webb, 1998).
2.4 Effects of Ultraviolet Radiation on Human Health
15 than UVB constitutes the vast majority of UV radiation humans are exposed to (Zhang et al. 2012; Agar et al. 2004; Berneburg et al. 2000; Krutmann, 2000).
UVA can penetrate deeper into the skin than UVB and can also pass through most non-tinted glass windows and cotton clothing (depending on the tightness of the weave), whereas generally, these objects are opaque to UVB (Jegou et al. 2011; Agar et al. 2004; Parisi et al. 2004; Wang et al. 2001). The skin and eyes are the two organs that are exposed to UV radiation, a known carcinogen and linked with premature skin aging and immune system suppression and sun-related eye diseases; however, it is needed to maintain good health (Hung et al. 2012; Jegou et al. 2011; Young, 2009; Kimlin, 2008; Rigel, 2008; Webb, 1998). Melanin production in the upper layers of the skin affords some minor level of photoprotection, but not to prolonged exposure (Yaar and Gilchrest, 2007; Berneburg et al. 2000).
2.4.1 Vitamin D Synthesis
Human exposure to UVB is necessary for the synthesis of cutaneous vitamin D. As such, vitamin D synthesis is highly dependent on solar zenith angle, ozone levels and diurnal, seasonal and geographical variability (McKenzie et al. 2009; Siani et al. 2009; Kimlin, 2008; Grant and Holick, 2005; Parisi et al. 2004). It is recommended that during the Australian summer, depending on skin type, 2-14 minutes, 3-4 times a week to 15% of the body will provide adequate vitamin D; however, as erythema can occur within 8 minutes, this process should occur well before or after solar noon (Samarek et al. 2006).
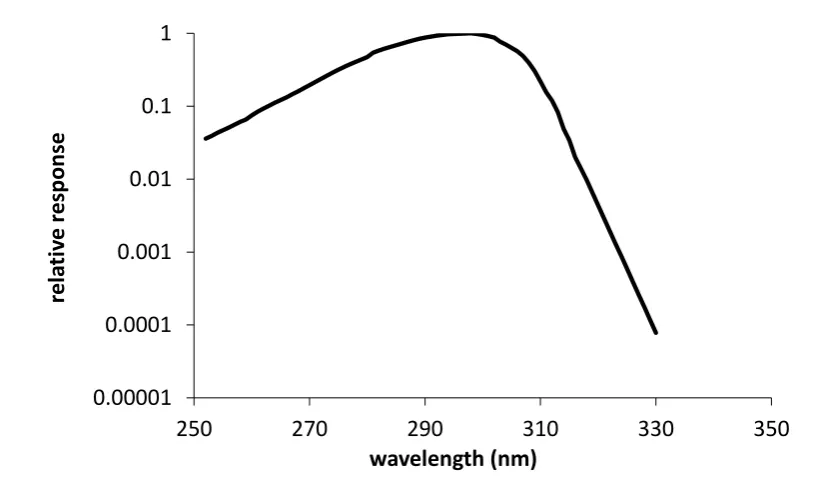
16 a slow heat isomerisation to become vitamin D (Kimlin, 2008; Webb, 1998). The CIE action spectrum for the synthesis of previtamin-D3 in human skin is presented in Figure 4, showing minimal to nil response in the UVA waveband.
Figure 4: Action spectrum for the synthesis of previtamin-D3 in human skin
(CIE, 2006). The response from wavelengths greater than 330 nm are far lower than what is shown.
One of the main roles of vitamin D is the regulation of calcium absorption (Luk et al. 2012; Kimlin, 2008; Samanek et al. 2006; Webb, 1998). Studies have indicated that vitamin D has a role in the prevention of several types of cancer (Grant, 2008). Deficiencies in vitamin D have been linked with serious conditions such as rickets, bone mass loss, osteoporosis, multiple sclerosis, hypertension, insulin dependent diabetes, schizophrenia, breast cancer, prostate cancer, non-Hodgkin’s lymphoma and colorectal cancer (Kimlin, 2008; Samanek et al. 2006). Some studies reviewed by Luk et al. (2012), suggest that human reproduction may also be affected by vitamin D deficiency.
0.00001 0.0001 0.001 0.01 0.1 1
250 270 290 310 330 350
17
2.4.2 Skin Cancers
Care is required so as to not expose the skin to excessive UV radiation, as erythema (sunburn) has been found to be less dependent on conditions critical for vitamin D synthesis (McKenzie et al. 2009). Prolonged exposure to UV radiation is linked with three main types of skin cancer, the non-melanoma (NMSC) basal and squamous cell carcinomas and malignant melanoma (Cancer Council Australia, 2012; McKenzie et al. 2009; Samanek et al. 2006; Webb, 1998).
The prevalent notion that UVB is the main cause of skin cancer has been revised, as recent studies have found the UVA, which contributes about 95% of total ultraviolet exposure can penetrate further into the skin than UVB (Fartasch et al. 2012; Zhang et al. 2012; Rigel, 2008; Agar et al. 2004; Moan et al. 1999). UVB is absorbed by DNA, thus resulting in serious damage but penetrates poorly into the skin, whereas UVA reaches further into the skin and is absorbed by other chromophores, potentially generating damaging reactive species (Lund and Timmins, 2007).
18 Figure 5: Action spectra for erythema (solid line) and fish melanoma (dashed line) (CIE, 1998; Setlow et al. 1993).
The following statistics from the Cancer Council Australia (2012), SunSmart Victoria (2012) and Fransen et al. (2012) show the significant health problems caused by excessive exposure to UV radiation:
In general, skin cancers account for about 80% of newly diagnosed cancers, with over 1000 treated per day. About 1890 die each year of skin cancers. Australia has the highest incident rate of skin cancer in the world.
Non-melanoma skin cancer is the most common type of cancer diagnosed in Australia, with men twice as likely as women to suffer from them.
Melanoma are more common in men than women, but is ranked as the 3rd most common diagnosed cancer for both sexes, and is the 9th most common cause of cancer death.
0.0001 0.001 0.01 0.1 1
280 300 320 340 360 380 400
R
e
la
ti
ve
R
e
sp
on
se
19
2.4.3 Photoaging
Skin aging is the result of either intrinsic or extrinsic mechanisms, such as chronological aging and UV exposure respectively (Hung et al. 2012; Vierkotter and Krutmann, 2012; Yaar and Gilchrest, 2007; Rabe et al. 2006). Although there are many similarities between chronologically aged and photoaged skin, the latter sometimes referred to as ‘premature aging’, there are some fundamental differences in the processes (Rabe et al. 2006; Berneburg et al. 2000). Although lifestyle and skin type are major factors, prolonged exposure to UVA has been found to be the primary cause of photoaging (Vierkotter and Knutmann, 2012; Agar et al. 2004; Rabe et al. 2006; Berneburg et al. 2000; Knutmann, 2000). The action spectrum of photoaging has never been fully determined (Yaar and Gilchrest, 2007).
Laboratory experiments on nude mice and observations made with different groups of people in different environments reveal that prolonged exposure to UVA results in the degradation of elastin and collagen as well as oxidation of skin proteins and lipids, through the formation of reactive oxygen species, resulting in dermal enlargement (wrinkles), variable epidermal thickness, solar elastosis and pigment irregularities (Vierkotter and Knutmann, 2012; Hung et al. 2012; Yaar and Gilchrest, 2007; Rabe et al. 2006; Knutmann, 2000).
20
2.4.4 Eye Conditions
The parts of the eye that are exposed, hence are sensitive to light are the cornea, lens and retina, exposure to these are dependent on the incident angle of the light source (Oliva and Taylor, 2005; Sliney, 2005; Sliney, 2002). Not all wavelengths of incident light actually reaches the eye most of the time (Oliva and Taylor, 2005). Most ultraviolet radiation is absorbed by the cornea and lens. The absorption increases with age and the relative absorption of UV is in Figure 6 (Behar-Cohen et al. 2011; Oliva and Taylor, 2005; Sliney, 2002; Vajdic et al. 2002). The outer components of the eye, including the eyelid and conjunctiva are exposed to UV similar to that of the rest of the skin, potentially increasing the risk of skin cancers as described in section 2.4.2 (Friedlaender, 2005; Oliva and Taylor, 2005).
21 Most studies state that prolonged exposure to UVB results in serious conditions of the human eye, including cataracts, eyelid, conjunctiva and corneal lesions (Oliva and Taylor, 2005; Zigman, 2005). DNA damage through UVB dosage in these outer areas of the eye is likely to be similar to photo responses that can occur in the human skin (Samarek et al. 2006; Oliva and Taylor, 2005). However, as with skin cancer, DNA damage can be the result of prolonged indirect UVA exposure causing the formation of reactive oxygen species that can result in these conditions, including lens damage cannot be underestimated (Lund and Timmins, 2007; Zigman, 2005).
2.4.5 Immune Response
22
2.5 Chapter Discussion
24 The causes, extent and consequences of air pollution due to atmospheric aerosols are of fundamental interest (Mitchell et al. 2010; Radhi et al. 2010; Kalashnikova et al. 2007). Aerosols can be of natural or anthropogenic origin and can be organic or inorganic and can be generated from the surface or through gas to particle conversions (Kokhanovsky, 2008; Seinfeld and Pandis, 2006; Jacobson, 2002). Aerosols are typically around 100 nm in size, although not visible to the human eye, their effects can be seen with changes in visibility, climatic influences and their potential to cause health problems in humans (Kokhanovsky, 2008; Jacobson, 2002). This chapter discusses the optical properties and the global and local aerosol loading.
3.1 Attenuation of Radiation due to Aerosols
The optical properties of aerosols are dependent on their size, shape, concentration, chemical composition and internal structure (Kokhanovsky, 2008; Seinfeld and Pandis, 2006). The attenuation of radiation due to aerosols is highly variable and can be due to absorption and scattering (Kokhanovsky, 2008). Aerosol loading can decrease the erythemally weighted UV measured at the surface and therefore the UV Index (Wenny et al. 2001). Aerosol optical depth (AOD) is a dimensionless quantity that describes the attenuation of incident light due to aerosol particles (Kokhanovsky, 2008; Jacobson, 2002). The Beer Lambert Law is used to measure the direct normal irradiance at wavelength λ (Iλ) and is given by (Wenny et al. 2001; Bodhaine et al. 1999),
25 Where is the extraterrestrial irradiance at wavelength λ and is usually determined using the Langley Method (Meloni et al. 2003; Bigelow et al. 1998; Bodhaine et al. 1999; Harrison and Michalsky, 1994). The terms m, τλ, P and P0 represent air mass, total optical depth, station pressure and mean sea level pressure respectively, these will be described in more detail later in this section.
The Langley Method for measuring extraterrestrial irradiance assumes that the Beer-Lambert Law provides a negative linear relationship between the natural log of the direct normal irradiance ( ) and relative air mass (m), assuming that the atmospheric composition (-k) remains constant; namely (Adler-Golden and Slusser, 2007),
. [2]
The natural log of the extraterrestrial irradiance is determined when the linear plot is extrapolated to the vertical axis, (Adler-Golden and Slusser, 2007; Meloni et al. 2003). The extraterrestrial irradiance needs to be corrected for the mean Sun Earth distance factor [( ) ], calculated using the calendar day of observation (doy) (Porter et al. 2001),
26 The handheld Microtops II sunphotometer is an example of an instrument that is calibrated in this way, with the mean sun-Earth distance extraterrestrial irradiation programmed into the device for use as a ‘factory constant’ (Solar Light, n.d.; Morys et al. 2001).
In the case for instruments where the extraterrestrial irradiance is set, the direct normal irradiance needs to be corrected with the Earth-sun difference factor, derived from equation 3,
( ) { [ ( )]} . [4]
m is the relative air mass. The atmosphere can be assumed to be plane parallel for a
relative air mass (m) of less than 2 which corresponds with solar viewing at midday, with an error margin less than 0.1% (McIntosh, 2006). However, this assumption does not apply to all latitudes. This assumption results in a simplified air mass equation where the angle (θ) is the solar zenith angle (Wenny et al. 2001),
. [5]
27
. [6]
At the target wavelengths of this research (340 nm and 380 nm), ozone absorption is negligible, thus the term can be assumed to be zero.
is the ratio of the station air pressure with mean sea level air pressure (1013.25 hPa).
Rearranging equation 1 and including the assumptions above, to make the aerosol optical depth the subject yields (adapted from Morys et al. 2001),
[ ( ) ( ( ) )] . [7]
3.1.1 Visible
28 the visible spectrum can microlens, or focus the absorption when in contact with soot (Schnaiter et al. 2003).
3.1.2 Ultraviolet
29
3.2 Aerosol and Gaseous Species
Although it is beyond the scope of this research to be able to differentiate between different aerosol and gaseous species, the following is a summary of the optical properties of the most common aerosols and gaseous species: anthropogenic ozone, nitrogen dioxide, sulphur dioxide and particulate matter, from multiple sources adding to the complexity of measuring AOD (Kokhanovsky, 2008; Kazadzis et al. 2007).
Natural sources of aerosols and gaseous species include volcanic eruptions, sea spray and dust storms. Anthropogenic or manmade aerosol based air pollution primarily derives from industry, transport, agriculture and forest fires (Jacobson, 2002). The effects of air pollution are of concern to human health, particularly in urban areas (Igoe, 2011; Kokhanovsky, 2008; Seinfeld and Pandis, 2006; Jacobson, 2002). It is not uncommon for many different sources contributing different types of aerosols, which may result, with the influence of ambient UV radiation, in the formation of secondary aerosols (Kokhanovsky, 2008). A summary of the interaction between UV and some of the major types of aerosols is presented below.
Anthropogenic Ozone
30 Sulphur Dioxide
Sulphur dioxide is the other gaseous species that affects UVB wavebands, and is almost transparent in the visible (Siani et al. 2010; Seinfeld and Pandis, 2006; Fioletov et al. 1998). Sulphur dioxide is the most common anthropogenic sulphur based aerosol, and the most detected naturally emanating from volcanoes (Kokhnovsky, 2008; Seinfeld and Pandis, 2006; Fioletov et al. 1998).
Nitrogen Dioxide
Nitrogen dioxide is the most common and visible of the nitrogen oxide gaseous species and one of the main discolorants in photochemical smog (Siani et al. 2010; Seinfeld and Pandis, 2006; Wayne and Wayne, 2005). Nitrogen dioxide is unique in that it has absorbance features across the UV and visible wavebands, between 300 nm and 370 nm and 90% will dissociate into nitrogen oxide and oxygen. Dissociation drops off significantly between 370 nm and 420 nm (Kokhanovsky, 2008; Seinfeld and Pandis, 2006; Jacobson, 2002).
Particulate Matter
31
3.3 Aerosols over Australia
The Australian environment has relatively low anthropogenic aerosol loading for an industrialised nation, but is the southern hemisphere’s greatest source of mineral dust aerosol. The Lake Eyre Basin (Figure 7) is the main source of dust aerosols (Radhi et al. 2012). Sea salt and seasonal biomass burning aerosols are also prevalent (Radhi et al. 2012; Kalashnikova et al. 2005; Mitchell and Forgan, 2003). Australia has very high levels of UV radiation in the spring and summer due to the latitude of the continent and the relative low aerosol loading (Kalashnikova et al. 2005). Increased UV radiation also leads to the production of secondary aerosols (Radhi et al. 2012).
32 An increase in mineral dust aerosols were recorded after prolonged drought conditions (Radhi et al. 2012). Variability in different types of aerosol loading is primarily due to seasonality, meteorological conditions and the source location (Mitchell et al. 2010).
3.4 Chapter Discussion
34
4.1 Current Measurement Techniques
Measurements of aerosols are usually made using satellite and ground based instrumentation. These instruments are further divided into passive and active sensors. Passive methods provide values that represent the average aerosol properties across the light path or column, whereas active sensors measure the active aerosol profile using photon backscattering (Kokhanovsky, 2008; Diner et al. 2004). Passive and active sensors are often most effectively used in tandem as no one method would be able to fully encapsulate the complexity of aerosol systems (Ialongo et al. 2008; Diner et al. 2004).
There are numerous satellite aerosol observation programs, advantages of these are that they can be timely and provide a global picture of aerosol behaviour and movement and not require Langley calibration, as they provide values of the extraterrestrial irradiance (Kokhanovsky, 2008). Typical resolutions range from 40 km by 320 km for the Global Ozone Monitoring Experiment (GOME) to 13 km by 24 km for the Ozone Monitoring Instrument (OMI) (Lohberger et al. 2004). The large scale resolution of satellite imagery and the fact that land and sea surfaces provide differing responses are a major disadvantage for localised and detailed aerosol measurements (Kokhanovsky, 2008). As satellite data becomes more refined and the resolution size decreases, a more refined and accurate measure of AOD can be determined (Slusser et al. 2000).
35 whereas ground based is from a point source (Diner et al. 2004). Ground based data needs to have the extraterrestrial irradiance determined using the Langley Plot method described in equation 2 (Kokhanovsky, 2008; Adler-Golden and Slusser, 2007; Estelles et al. 2007; Cheymol et al. 2006; Mitchell and Forgan, 2003; Slusser et al. 2000; Harrison and Michalsky, 1994).
Dobson and Brewer spectrophotometers are the best known ground based aerosol measurement tools and are often the basis of calibrating other equipment (Cheymol et al. 2009; Ialongo et al. 2008; Gao et al. 2001; Morys et al. 2001; Kohler, 1999; Slusser et al. 1999). The Dobson spectrophotometer is a double prism monochromator and the later designed Brewer is a single grating spectrophotometer (Slusser et al. 1999). Despite being a standard for ozone and aerosol measurement, Dobson and Brewer spectrophotometers are largely inaccessible to most people, due to their size and cost (Morys et al. 2001; Kohler, 1999).
The CIMEL CE318 sunphotometer is a common instrument used in Australia’s CSIRO Aerosol Ground Station Network (AGSNet), which forms part of the international program AERONET (Mitchell et al. 2010; Radhi et al. 2010; Kokhanovsky, 2008; Mitchell and Forgan, 2003). Many AGSNet locations are within the Lake Eyre Basin, the major source of mineral dust in Australia (Mitchell et al. 2010; Mitchell and Forgan, 2003). The CIMEL CE318 sunphotometer is designed to be a solar powered, weather proof, automated means of measuring solar and sky irradiances (Cheymol et al. 2009; Kokhanovsky, 2008; Estelle et al. 2007).
36 Harrison and Michalsky, 1994). The instrument has an automated rotating shadow band (Harrison et al. 2004). The MFRSR is also used throughout AGSNet sites where it can be left to run automatically (Mitchell and Forgan, 2003; Slusser et al. 1999; Bigelow et al. 1998). Tests performed by di Sarra et al. (2002) and Gao et al. (2001) determined that the MFRSR has a high level of accuracy, comparable to Dobson and Brewer spectrophotometers. Both the CIMEL and MFRSR are examples of specialised instrumentation; however, they both are too large and expensive for anything other than specialised research locations and personnel (Kohler, 1999).
LIDAR (Light Ranging and Detection) is an example of an active monitoring system that is commonly used in aerosol studies (Tsaknakis et al. 2011; Kokhanovsky, 2008; Lohberger et al. 2004; di Sarra et al. 2002). Information about the vertical aerosol profile is obtained from backscattered photons (Tsaknakis et al. 2011; Kokhanovsky, 2008; Diner et al. 2004).
37 The costs and complexity of all traditional equipment mean that they are inaccessible to the general community and schools. However, mass market, accessible and inexpensive technology, including digital cameras and smartphones, have image sensors that could be used for observations to supplement existing technology and research programs (Igoe, 2011).
4.2 Image Sensors
The two main types of image sensors are charged coupled devices (CCD) and complementary metal oxide semiconductors (CMOS). These image sensors are commonly found in digital, smartphone and iPhone cameras and have been used for applications such as forensic investigations, archaeology, space-borne imaging and volcanic gas emission measurements (Kantzas et al. 2010; Olsen et al. 2010; Verhoeven and Schmitt, 2010; Minoglou et al. 2008; Bluth et al. 2007; Bogaerts et al. 2007; Har et al. 2004). Ground based sky cameras, used to measure the amounts and distribution of cloud, also use a CCD image sensor (Sabburg and Wong, 1999). Igoe et al. (2013a and 2013c) used CMOS based smartphones to measure and calculate UVA irradiance and AOD.
38 Figure 8: Basic architectural and functional differences between CCD and CMOS showing pixel structure of each type of image sensor (Medina, 2012).
CMOS image sensors have the advantage over the CCD filters of ‘commercial’imaging in requiring lower power, cost less to manufacture and possess greater on chip functionality (Jerram et al. 2010; Blue et al. 2009; Minoglou et al. 2008). CMOS image sensor architecture of an array of photodiodes and pixel circuitry is similar to digital memory components, effectively a ‘lab on a chip’ (Shen et al. 2011; Theuwissen, 2008).
39 the photodiode respectively (Figure 9) (Jerram et al. 2010; Blue et al. 2009; Minoglou et al. 2008).
Figure 9: Structure of backside illumination (BSI) showing the difference in how incidental light is received from the image sensor photodiode (Goldman, 2011).
40
4.2.1 Noise Summary
Each brand of smartphone possesses unique noise responses; this is primarily due to differences in manufacture (Alakarhu, 2007). Details of manufacture are unobtainable as they are considered to be propriety information. Most noise sources are temperature dependent (EMVA, 2010; Irie et al. 2008). Image sensor noise can be categorised in 3 ways (Irie et al. 2008):
1. Spatial noise
At low illumination, this is referred to as ‘dark current’ or dark signal non-uniformity (DSNU) (EMVA, 2010; Irie et al. 2008). DSNU is measured by taking the average signal of all pixels while covered at different temperatures (Irie et al. 2008). The magnitude of DSNU is typically low for smartphone image sensors (Alakarhu, 2007). At high illumination, photo response non-uniformity (PRNU) is the main source of noise (Irie et al. 2008). Spatial noise is mitigated by averaging several images with the same illuminance (Irie et al. 2008).
2. Temporal noise
41 3. Total noise
Total noise represents the combined spatial and temporal components, determined by the average standard deviation across all image columns (Irie et al. 2008). Each test performed in this study will take the average of multiple pixels taken of the solar image across different times to evaluate the total noise.
4.3 Chapter Discussion
43 The components for this research were divided into two parts:
Feasibility tests, where, under low intensity UVA light, observations were made to test if the smartphone image sensor’s response can be characterised when exposed to UVA radiation of known intensity (Igoe et al. 2013a). Calibration field tests, where, the smartphone image sensors were calibrated
using a Microtops E540 sunphotometer when viewing the sun, to determine aerosol optical depth (AOD) (Igoe et al. 2013c).
5.1 Standard Equipment Used
44 Figure 10: Irradiation monochromator used for producing a stable beam of approximately 10 nm FWHM for the feasibility studies.
Irradiances in the feasibility studies were detected using a double grating scanning UV spectroradiometer, (Model DMc150 Bentham Instruments Ltd. Reading, UK) (Figure 11). The spectroradiometer is calibrated to a UV standard lamp with calibration traceable to the NPL (National Physical Laboratory, Teddington, Middlesex, UK). The input optics were provided by a 10 mm diameter diffuser (model D7; Bentham Instruments, UK) connected by a 5 m long, 4 mm diameter optical fiber to the input slit of the monochromator of the spectroradiometer. The output beam of the irradiation monochromator covered the entire diffuser surface.
45 Figure 11: Spectroradiometer used for the irradiance measurements in the feasibility tests.
Field tests were calibrated and verified with the use of a Microtops II sunphotometer (model 540, Solar Light, USA) for measuring direct UV irradiances and aerosol optical depth (Figure 12). This instrument was calibrated by the manufacturer at the Mauna Loa Observatory, Hawaii (Morys et al. 2001).
46 Narrow bandpass filters were used in both the feasibility and calibration tests, specifically bandwidths centred on 320 nm, 340 nm, 360 nm and 380 nm (supplied by CVI Melles Griot, New Mexico, USA); the 340 nm and 380 nm narrow bandpass filters were used specifically for the calibration and verification tests. The 320 nm and 360 nm filters were used for comparison in lab tests. Each filter had a full width at half maximum of 5 nm and a 25 mm diameter.
Neutral density (ND) filters were also used extensively during the experiment to prevent pixel saturation. For both the feasibility and field calibration tests, a ND1% (XND0001, Asahi Spectra, Japan) neutral density filter was used. The 380 nm field calibration tests also used an additional ND2 filter (Bentham Intruments Inc. UK). The neutral density filters transmitted approximately 1% and 50% incident light respectively.
5.2 Smartphone Selection
Three smartphones were selected for testing, based on their cost, accessibility and useability (Igoe et al. 2013a). The Samsung Galaxy 5 (Samsung Electronics, Seoul, South Korea); Huawei U8180 (Huawei Technologies, Shenzhen, China) and the LG Optimus (LG Electronics, Seoul, South Korea) smartphones are examples of low cost and easy to obtain mass market imaging technology, accessible to anyone. All three smartphones have similar size and thickness of the outer lenses and have a CMOS (complementary metal oxide semiconductor) image sensor.
47 modification would unnecessarily complicate the procedure, especially as the compression can be factored into the data analysis.
Of these smartphone camera systems, the Samsung Galaxy 5 was the only phone that provided photographic information, particularly exposure time, required for characterising the UVA response. For this reason the Samsung Galaxy 5 was used as a representative phone for the feasibility tests (Igoe et al. 2013a).
5.2.1 Lens Attenuation
The 25 mm diameter outer lens of the Samsung Galaxy 5 smartphone was excised as a representative example typical for many smartphone cameras. UVA irradiances from the irradiation monochromator at 10 nm increments were passed through the excised lens. The lens-attenuated irradiance is compared with the incident irradiance from the monochromator in Figure 13.
Figure 13: Comparison of the spectral irradiance from the irradiation monochromator (solid lines) to the attenuated irradiance through the excised outer lens (dashed lines) (Igoe et al. 2013a).
0 100 200 300 400 500 600 700 800 900
330 340 350 360 370 380 390 400
Spe ct ra l i rr ad ia n ce (m W m
-2 nm -1 )
48 The UVA lens transmission is in Figure 14. The smartphone camera lens is a major source of attenuation of UV radiation, decreasing from 18.9% at 390 nm to 1.1% at 340 nm; however, there is still a distinguishable signal at 340 nm (Igoe et al. 2013a).
Figure 14: Percentage transmission curve through a smartphone excised outer lens (Igoe et al. 2013).
It was not possible to investigate the transmission of the inner lens and the image sensor filters without causing serious damage to the smartphone camera. For the purposes of this research the outer lens, alongside the inner lens and on-image sensor filters are considered to be components of the smartphone image sensor as a whole, as it is impractical to remove it in everyday use.
0 2 4 6 8 10 12 14 16 18 20
330 340 350 360 370 380 390 400
Tr
an
smiss
ion
(%)
49
5.2.2 Lens Fluorescence
A potential source of error is if the smartphone camera lens fluoresced. To test for fluorescence, the excised lens was subjected to 340 nm and 380 nm irradiances from the irradiation monochromator in a room with a constant temperature of 20°C, with the spectroradiometer detecting throughput spectral irradiances in 1 nm increments up to 500 nm. The tests revealed that the excised lens did not fluoresce. Peaks of 171.2 and 10.9 mWm-2nm-1 were measured for 380 nm and 340 nm narrow wavebands respectively, the response measured between 400 nm and 500 nm was only 0.043±0.009 mWm-2nm-1 which is insignificant (Igoe et al. 2013a).
5.2.3 Noise Tests
Dark current (or dark fixed pattern noise, DFPN) and thermal noise tests were performed on each of the smartphones. Raising the temperature by 20°C resulted in negligible fluctuations in the average image sensor digital number. Dark current tests were performed by taking photos when the lens was covered at temperatures of 17°C and 37°C. The grayscale digital numbers were obtained using the freeware program SciLab (Igoe et al. 2013a).
50 Table 1: Dark fixed pattern noise (DFPN) at 17°C and 37°C for the Samsung Galaxy 5, Huawei U8180 and LG Optimus, measured in grayscale digital numbers (DN).
Smartphone DFPN at 17°C (DN) DFPN at 37°C (DN)
Samsung Galaxy 5 1.7 1.9
Huawei U8180 1.8 2.0
LG Optimus 1.6 1.9
5.3 Feasibility Tests
5.3.1 Methodology
A main concern in this study is to not saturate, nor damage the smartphone camera sensor. However, the signal detected needs to also be above background digital noise levels to be useful (Gallo et al. 2012). Obtaining sufficient and useful digital values will allow an approximation of the sensor irradiance (Iλ) to be calculated using Debevec and Malik (1997)’s algorithm, linking digital values (Z) and exposure time (Δt),
51 Debevec and Malik (1997) state that the luminaire irradiance (e.g. from the monochromator) can be used for sensor irradiance. The exposure time (Δt) is retrieved from the photo’s digital EXIF data, this generally cannot be altered in a smartphone (Igoe et al. 2013a). The red, green and blue digital values (Z) can be retrieved from the photo’s pixel data using a program such as the freeware program SciLab (SciLab, 2012). The camera response function (f) is determined by graphing digital values (Z) against the natural logarithm of the product of sensor irradiance and exposure time ( ), incorporating the linear and non-linear image processes (Gallo et al. 2012; Debevec and Malik, 1997).
52 Table 2: The percentage transmissions of each and combinations of the lens and filter elements used in this part of the study (Igoe et al. 2013a).
Transmission (%) at Incident Wavelength
340 nm 360 nm 380 nm
Bandpass filter 35.1 29.2 3.41
ND1% 1.3 1.3 1.4
Bandpass + ND1% 0.46 0.38 0.048
Bandpass + ND1% + lens 0.0051 0.017 0.0065
53 Figure 15: Feasibility experimental setup. The UV radiation is from the irradiation monochromator and the smartphone is in position in front of the output optics.
5.3.2 Results
Figure 16 shows the result of the tests performed with irradiances from 340, 360 and 380 nm compared with the image sensor’s chromatic green response as defined by Malacara (2002) in equation 9,
[9]
(R, G and B represent the red, green and blue digital numbers respectively). Output slit of irradiation monochromator
Holder for filters
54 Figure 16: Raw smartphone camera response as a function of irradiance for 340 nm (squares), 360 nm (triangles) and 380 nm (diamonds) (Igoe et al. 2013a). Exposure time was not changed.
Several mathematical models to characterise the smartphone camera UVA response were considered. Debevec and Malik (1997)’s algorithm (equation 8) provided the strongest fit when modified by (Igoe et al. 2013a) to become,
( ) ( ) , [10]
This yields the full derivation from equation 8 as being,
[11]
0.00 0.05 0.10 0.15 0.20 0.25 0.30 0.35 0.40
0 5 10 15 20 25 30
g
55 This relationship can be seen in Figure 17, the data point is the average over 15 values and the error bars represent the standard error from 15 samples taken at each point. The correlation coefficient was 0.82 (Igoe et al. 2013a).
Figure 17: UVA characterisation of a Samsung Galaxy 5 (Igoe et al. 2013a). -10
-9 -8 -7 -6 -5 -4
-8 -7.5 -7 -6.5 -6 -5.5
f(g
)
56
5.4 Calibration Field Tests
5.4.1 Methodology
Field tests were conducted in two phases: the first was to develop a calibration between the smartphone camera image sensor’s response to direct UV in narrow wavebands with the direct UV irradiance recorded by the Solar Light Microtops II sunphotometer, then develop an algorithm to determine AOD from the image sensor response; the second was to verify that the algorithm from the first phase still applied for different or similar conditions. The same three smartphones as for the laboratory tests (Huawei 8180, Samsung Galaxy 5 and LG Optimus) were used for the field calibration and verification tests with the same settings. However, the Huawei 8180 failed during the first 380 nm calibration test with the full calibration and validation being done on the remaining two phones.
Locations
57 Calibration and verification
Calibration tests were performed at 20 minute intervals from 9 am to midday on visually clear days, when the sun’s disk was not obscured by clouds. Calibration tests were performed in both Emerald and Toowoomba during spring and summer. Each 20 minute observation was calibrated to the Microtops II sunphotometer (Solar Light) which takes direct irradiance measurements (Morys et al. 2001). This requires the smartphone cameras to take photos directly of the sun, something that they are not designed to do as the image sensor would be saturated at best and irreparably damaged at worst. Also, smartphone image sensors are not inherently designed to detect specific wavelengths, despite being sensitive to UV wavelengths (Tetley and Young, 2008).
58 Figure 18: Smartphone camera and filter setup. Bandpass filter is at A; ND2 neutral density filter (for 380 nm tests) at B; and ND1% neutral density filter at C. The smartphone is at D.
The smartphone setup in Figure 18 was then clamped onto a tripod for stability. Figure 19 shows the full setup, with the smartphone setup on top of the tripod at height 1 m above the ground. On one of the seats is the Microtops II sunphotometer used for calibration.
Figure 19: Field setup, including smartphone with filters on top of the tripod. The Microtops sunphotometer pictured was used to calibrate the smartphone camera’s image sensor data.
A B
C
59 At each 20 minute interval, a reading from the sunphotometer was taken, and the smartphone camera and tube assembly aligned to take 3 photos of the sun. This process was repeated to validate the original results. The ambient air temperature ranged from 16°C to 32°C and the air mass was between 1 and 2 for the observations. The zero-shadow method was employed to ensure that the image of the sun was at the centre of each image as can be seen in Figure 20.
Figure 20: A grayscale image of the sun, taken with a 340 nm filter covered Samsung Galaxy 5 smartphone camera (magnified image). (Igoe et al. 2013b).
60
5.4.2 Results
The results are presented in three stages:
1. Calibration of the smartphone signal with the direct irradiance detected by the Microtops II sunphotometer for each phone at each wavelength individually; a summary of 340 nm and 380 nm tests and finally, all the data from all tests together.
2. Comparisons of the derived ln(I) values from the Microtops and smartphones in a similar manner to stage 1.
3. Comparisons of the derived AOD, with validation data where appropriate.
Three data analyses were performed. One testing the viability of a single algorithm of all combined data, the next investigated wavelength based data and the final test determined if each phone responded differently to each of the target wavelengths.
5.4.2.1 Calibration
61 grey’ value, corrected for increased air mass. The natural log of both the measured irradiance and the corresponding cosine grey were then compared, as follows (Igoe et al. 2013c).
( ) ( ) [12]
where [13]
(R, G and B represent red, green and blue pixel values respectively).
As each calibration took on the form of a linear regression, equation 12 becomes (Igoe et al. 2013c),
( ) ( ) [14]
where m and c are the gradient and intercept for each regression respectively.
Calibration error calculations
62
[15]
where ( )
Thus using the calculus approach described by Hughes and Hase (2010), the error ( ) of the right hand side of equation 12 is,
[16]
The errors associated with the gradient and intercept in equation 14 are calculated according to algorithms developed by York et al. (2004), implemented in Microsoft Excel® for this research in order to incorporate the errors in each data point.
Samsung Galaxy 5
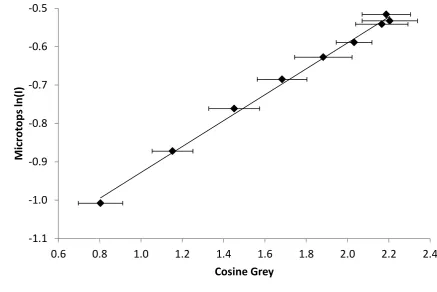
The calibration regression for the Samsung Galaxy 5 observations at 340 nm (Figure 21) was calculated as,
( ) [ ( )] [17]
63 Figure 21: Calibration regression between the Microtops derived ln(I) and the Samsung Galaxy 5 derived cosine grey for observations made at 340 nm.
The calibration regression for the Samsung Galaxy 5 observations at 380 nm (Figure 22) was calculated as,
( ) [ ( )] [18]
The regression correlation is very strong (R2 = 0.97). The errors calculated for the gradient and intercept are 0.0021 and 0.0001 respectively. Note, the error bars are too small to be seen in the graph.
-0.9 -0.8 -0.7 -0.6 -0.5 -0.4
0.8 1.0 1.2 1.4 1.6 1.8 2.0 2.2 2.4
M
icr
ot
op
s
ln
(I)
64 Figure 22: Calibration regression between the Microtops derived ln(I) and the Samsung Galaxy 5 derived cosine grey for observations made at 380 nm. Error bars are too small to be seen.
Huawei U8180
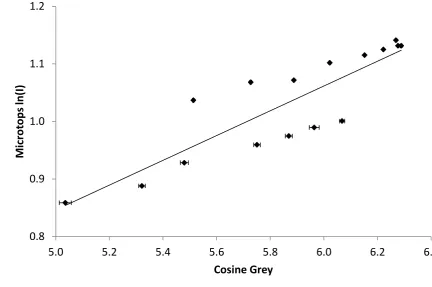
The calibration regression for the Huawei U8180 observations at 340 nm (Figure 23) was calculated as,
( ) [ ( )] [19]
The regression correlation is very strong (R2 = 0.99). The errors calculated for the gradient and intercept are 0.0092 and 0.0003 respectively. The Huawei failed to work for the 380 nm observations.
1.02 1.04 1.06 1.08 1.10 1.12 1.14 1.16
5.4 5.5 5.6 5.7 5.8 5.9 6.0 6.1 6.2 6.3 6.4
M
icr
ot
op
s
ln
(I)
65 Figure 23: Calibration regression between the Microtops derived ln(I) and the Huawei U8180 derived cosine grey for observations made at 340 nm.
LG Optimus
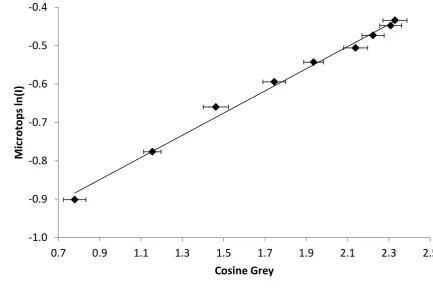
The calibration regression for the LG Optimus observations at 340 nm (Figure 24) was calculated as (Igoe et al. 2013c),
( ) [ ( )] [20]
The regression correlation is very strong (R2 = 0.996). The errors calculated for the gradient and intercept are 0.0124 and 0.0005 respectively.
-1.0 -0.9 -0.8 -0.7 -0.6 -0.5 -0.4
0.7 0.9 1.1 1.3 1.5 1.7 1.9 2.1 2.3 2.5
M
icr
ot
op
s
ln
(I)
[image:80.595.115.549.77.370.2]66 Figure 24: Calibration regression between the Microtops derived ln(I) and the LG Optimus derived cosine grey for observations made at 340 nm.
The calibration regression for the LG Optimus observations at 380 nm (Figure 25) was calculated as (Igoe et al. 2013c),
( ) [ ( )] [21]
The regression correlation is very strong (R2 = 0.97). The errors calculated for the gradient and intercept are 0.0003 and 0.000004 respectively. Note, the error bars are too small to be seen on the graph.
-1.1 -1.0 -0.9 -0.8 -0.7 -0.6 -0.5
0.6 0.8 1.0 1.2 1.4 1.6 1.8 2.0 2.2 2.4
M
icr
ot
op
s
ln
(I)
[image:81.595.115.553.76.368.2]67 Figure 25: Calibration regression between the Microtops derived ln(I) and the LG Optimus derived cosine grey for observations made at 380 nm. Error bars too small to be seen.
Combined 340 nm results
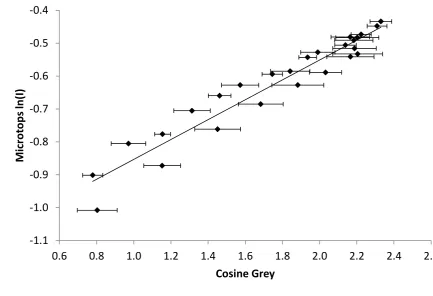
The calibration regression for all 340 nm combined observations (Figure 26) was calculated as,
( ) [ ( )] [22]
The regression correlation is very strong (R2 = 0.93). The errors calculated for the gradient and intercept are 0.0086 and 0.0002 respectively.
1.02 1.04 1.06 1.08 1.10 1.12 1.14 1.16
5.4 5.5 5.6 5.7 5.8 5.9 6.0 6.1 6.2 6.3 6.4
M
icr
ot
op
s
ln
(I)
[image:82.595.115.546.74.369.2]68 Figure 26: Calibration regression between the Microtops derived ln(I) and all smartphones derived cosine grey for observations made at 340 nm.
Combined 380 nm results
The calibration regression for all 380 nm combined observations (Figure 27) was calculated as,
( ) [ ( )] [23]
The regression correlation (R2) provides a coefficient of 0.76. The errors calculated for the gradient and intercept are 0.0006 and 0.00001 respectively.
-1.1 -1.0 -0.9 -0.8 -0.7 -0.6 -0.5 -0.4
0.6 0.8 1.0 1.2 1.4 1.6 1.8 2.0 2.2 2.4 2.6
M
icr
ot
op
s
ln
(I)
[image:83.595.114.548.74.370.2]69 Figure 27: Calibration regression between the Microtops derived ln(I) and all smartphones derived cosine grey for observations made at 380 nm.
All combined results
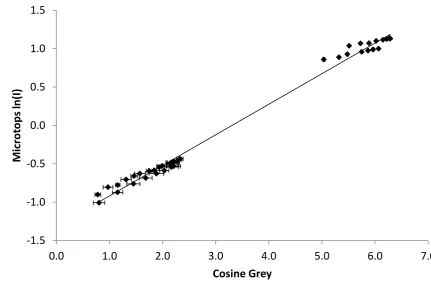
The calibration regression for all combined observations (Figure 28) was calculated as,
( ) [ ( )] [24]
The regression correlation is very strong (R2 = 0.99). The errors calculated for the gradient and intercept are 0.0009 and 0.00003 respectively.
0.8 0.9 1.0 1.1 1.2
5.0 5.2 5.4 5.6 5.8 6.0 6.2 6.4
M
icr
ot
op
s
ln
(I)
[image:84.595.114.547.78.365.2]70 Figure 28: Calibration regression between the Microtops derived ln(I) and all smartphones derived cosine grey observations.
5.4.2.2 Direct Irradiance comparisons
For error calculations, the smartphone calibration regression can be simplified to,
( ) [25]
where ( )
The error for the intercept (c) is significantly lower than the error for the gradient (m), hence, would not add significantly to the overall calculated error and is
-1.5 -1.0 -0.5 0.0 0.5 1.0 1.5
0.0 1.0 2.0 3.0 4.0 5.0 6.0 7.0
M
icr
ot
op
s
ln
(I)
[image:85.595.117.549.74.371.2]