R E S E A R C H A R T I C L E
Open Access
Abdominal adiposity and obstructive airway
disease: testing insulin resistance and sleep
disordered breathing mechanisms
Matthew T Haren
1,2,3*, Gary Misan
3, Tracey-Jayne Paterson
2,3, Richard E Ruffin
4, Janet F Grant
5,
Jonathan D Buckley
6, Peter RC Howe
6, Jonathan Newbury
2, Anne W Taylor
5and Robyn A McDermott
1Abstract
Background:This study examined associations of abdominal adiposity with lung function, asthma symptoms and current doctor-diagnosed asthma and mediation by insulin resistance (IR) and sleep disordered breathing (SDB). Methods:A random sample of 2500 households was drawn from the community of Whyalla, South Australia (The Whyalla Intergenerational Study of Health, WISH February 2008 - July 2009). Seven-hundred twenty-two randomly selected adults (≥18 years) completed clinical protocols (32.2% response rate). Lung function was measured by spirometry. Post-bronchodilator FEV1/FVC was used to measure airway obstruction and reversibility of FEV1was calculated. Current asthma was defined by self-reported doctor-diagnosis and evidence of currently active asthma. Symptom scores for asthma (CASS) and SDB were calculated. Intra-abdominal fat (IAF) was estimated using dual-energy x-ray absorptiometry (DXA). IR was calculated from fasting glucose and insulin concentrations. Results:The prevalence of current doctor-diagnosed asthma was 19.9% (95% CI 16.7–23.5%). The ratio of observed to expected cases given the age and sex distribution of the population was 2.4 (95%CI 2.1, 2.9). IAF was not associated with current doctor-diagnosed asthma, FEV1/FVC or FEV1reversibility in men or women but was positively associated with CASS independent of IR and SDB in women. A 1% increase in IAF was associated with decreases of 12 mL and 20 mL in FEV1and FVC respectively in men, and 4 mL and 7 mL respectively in women. SDB mediated 12% and 26% of these associations respectively in men but had minimal effects in women. Conclusions:In this population with an excess of doctor-diagnosed asthma, IAF was not a major factor in airway obstruction or doctor-diagnosed asthma, although women with higher IAF perceived more severe asthma
symptoms which did not correlate with lower FEV1. Higher IAF was significantly associated with lower FEV1and FVC and in men SDB mechanisms may contribute up to one quarter of this association.
Keywords:Airway obstruction, Forced Expiratory Volume, Forced Vital Capacity, Asthma, Abdominal adiposity, Sleep disordered breathing
Background
Obesity, as defined by body mass index (BMI) has been shown to be associated with a 2.5-fold increase in the risk of current doctor-diagnosed asthma in women but not in men [1] and the association appears to be specific to non-atopic asthma [2,3]. Raviv et al. [4] showed that obesity
was associated with asthma symptoms only in the least
obstructed tertile, as measured by the ratio of FEV1
(forced expired volume in one second) to FVC (forced vital capacity). Together, these findings suggest that obes-ity may produce a mild obstructive airway phenotype dis-tinct from that mediated by type 2 T-helper (Th2) cell inflammatory pathways [5]. Moreover, in one of the first studies to explore the associations between spirometric lung function and adiposity using DXA-measured fat mass, Sutherland and colleagues demonstrated correla-tions of total, trunk and abdominal fat masses with FVC
* Correspondence:[email protected] 1
Sansom Institute for Health Research, Division of Health Sciences, University of South Australia, Adelaide, SA, Australia
2
Spencer Gulf Rural Health School (SGRHS), University of South Australia and The University of Adelaide, Whyalla Norrie, SA, Australia
Full list of author information is available at the end of the article
in men and women and with FEV1in men only, using a small convenience sample. This study was unable to adjust for potential confounders or investigate potential mechan-isms and thus could not provide accurate estimates of the direct and indirect associations between adiposity and lung function and did not include a measurement of air-way obstruction [6].
Proposed mechanisms for an obesity-induced obstruct-ive airway phenotype include, amongst others, insulin re-sistance (IR) [7,8] and sleep disordered breathing (SDB) [5]. The mechanisms by which SDB could increase asthma severity are not known, but potentially involve increased vagal tone, leading to bronchoconstriction; upper airway inflammation, leading lower airway inflammation; and perturbations in central control of bronchomotor tone [5]. The authors have previously reported strong positive asso-ciations between the frequency of SDB symptoms and ex-pression of fat mass/hyperinsulinaemia, glycaemia and lipid/lean mass phenotypes in non-diabetics in the popula-tion under study which has a prevalence of abdominal obesity of 50% [9]. Thus, this population appears suited to examine this hypothesis.
Research context
The industrial, outer regional city of Whyalla in South Australia has a complex mix of social and physical envir-onmental exposures which may relate to excess asthma risk. Public perceptions about the causes of respiratory ill-health in this community may be dominated by the tangible evidence of the once visible ‘red dust’from the process of pelletising iron ore for Steelmaking and uncovered exporting of iron ore in the city [10]. An eco-logical study, using administrative data from 1977 to 2005 suggested that asthma, chronic lung disease, and lung cancer were in excess in Whyalla, but that the prevalence of smoking was similar in Whyalla when
compared with other ‘dusty’ regional South Australian
cities [11]. This suggests that local environmental or population factors might be contributing to the excess of respiratory disorders in Whyalla.
This study aimed to test the hypotheses that abdom-inal adiposity, which has been shown to be at high prevalence in this community, is associated with poorer lung function, increased severity of asthma symptoms and a higher prevalence of current doctor-diagnosed asthma through mechanisms involving IR or SDB.
Methods
Sampling and recruitment
The Whyalla Intergenerational Study of Health (WISH) cohort was established between February 2008 and July 2009. Whyalla households (n = 2500) were randomly selected from the residential housing database of the State Planning Authority. The strength of this sampling frame
was the completeness, however approach and recruitment was a complex multi-stage process due to limited contact information in the databases (residential address only). This novel sampling frame was used instead of telephone listings (Electronic White PagesW (EWPs)) due to a high proportion of households without landline telephone con-nections, which is more common in rural than metropol-itan South Australia [12]. Invitations to participate, addressed to“The Householder”, were mailed to randomly selected households, co-ordinated with a community-wide media campaign informed by a Community Advisory Group. Householders were invited to register online or by telephone, providing their telephone number and basic demographic information. One-hundred seventy-eight (7%) households responded to this approach. The second stage successfully matched 1183 of the randomly selected household addresses in the sample to names and tele-phone numbers in the EWPs. Thirdly, remaining un-matched randomly selected households were approached by door-knocking; a minimum of two attempts to contact were made and calling cards were left.
Once telephone numbers were obtained, Computer Assisted Telephone Interviewing (CATI) technology was used to recruit the adult (≥18 years) in each household who last had their birthday [13], and to collect demo-graphic, health and risk factor data and schedule clinical assessments. Interviews were conducted by trained inter-viewers under established protocols [13,14]. Participants provided written informed consent at the time of clinical assessment. Protocols and procedures were approved by the Human Research Ethics Committee of The Univer-sity of South Australia and the Aboriginal Health Re-search Ethics Committee of South Australia.
Major outcome measures
Spirometry, including bronchodilator reversibility was performed in accordance with American Thoracic Soci-ety guidelines [15] and manufacturer’s recommendations using portable ultrasonic sensor spirometers (ndd
Easy-One™) interfaced with EasyWare 2008 (ndd Medizintech
AG, Zurich Switzerland) on laptop computers. This de-vice has been demonstrated to maintain good stability during everyday use in Australian general practice and does not require daily calibration [16]. Quality control was maintained by achieving a minimum of three trials with volumes within 3% and achieving the manufac-turers recommended minimum system quality control grade. The primary spirometric outcome was airway
ob-struction measured by post-bronchodilator FEV1/FVC.
The degree of reversibility in the FEV1was calculated as:
100 x FEV1 (post-bronchodilator) – FEV1,(baseline)/
FEV1 (baseline). Secondary outcomes were
post-bronchodilator FEV1; FVC; peak expiratory flow (PEF);
FVC manoeuvre (FEF25-75%). These variables were also referenced to South Australian-derived prediction equa-tions of Gore et al. [17] and expressed as the percentage of predicted value (PPV).
Self-reported ‘ever doctor-diagnosed asthma’ was
defined as answering yes to either: (1) Have you ever been told by a doctor that you have any of the following conditions? (option 2 = Asthma); or (2) have you ever
been told by a doctor that you have asthma? ‘Current
doctor-diagnosed asthma’ was defined as ‘ever
doctor-diagnosed asthma’ plus evidence of currently active
asthma defined by positive responses to any of the fol-lowing questions: (1) During the past 12 months, did you have any symptoms of asthma? (2) During the past 12 months, did you take asthma medication that was prescribed or given to you by a doctor? (3) Do you still have asthma? The frequency of three asthma symptoms (wheeze, shortness of breath and cough; scored as never (0), occasionally (1), most days/every day (2)) and the amount of phlegm produced during cough (none (0), a little (1), several tablespoons/day or more (2)) over the past three months [18], were summed to produce a comprehensive asthma symptom score (CASS) ranging from zero indicating no asthma symptoms to eight
indi-cating the highly frequent presence of all four
symptoms.
Independent variables
Body composition was assessed using dual-energy x-ray absorptiometry (DXA, Lunar Prodigy, GE Medical
Sys-tems, Madison WI) with the manufacturer’s software
(enCORE 2003 version 7.52). Scans were performed according to the manufacturer’s protocols with partici-pants supine. Total body fat mass (g) was determined
automatically from the manufacturer’s software. Total
intra-abdominal fat (IAF) mass was estimated by defin-ing a region of interest in the abdomen by drawdefin-ing quadrilateral box with the base touching the top of the iliac crest, the upper margins touching the most inferior aspect of the ribs and the lateral borders extending to the inner border of the rib cage. IAF percentage was estimated as fat mass / (fat mass + lean mass + bone mineral content) * 100.
Fasting, morning venous blood samples were collected (approximately 40 mL) and assayed by a National Asso-ciation of Testing Authorities accredited laboratory. Fasting plasma glucose concentrations were measured using a Chemistry analyser system (Olympus AU5400, Olympus Optical C Ltd, Japan) with inter-assay CVs of 2.41% at 3.41 mmol/L and 2.21% at 19.72 mmol/L. Fast-ing serum insulin concentrations were measured in
serum collected, separated and frozen at −80°C within
two hours of collection. Radioimmunoassay was per-formed on an Abbott Architect immunoassay analyser
(Abbott Park, IL USA) with inter-assay CVs of 7.81% at 8.44 mU/L, 5.87% at 57.44 mU/L and 8.53% at 97.90 mU/L. IR was estimated from these two concen-trations using the Homeostasis Model Assessment (HOMA2) Microsoft Excel calculator from the Univer-sity of Oxford Diabetes Trial Unit (http://www.dtu.ox.ac. uk/homacalculator/index.php) which uses the equations of Levy and colleagues [19]. A SDB symptom score
(range 0–12) was computed as the sum of symptom
fre-quency from zero (never) to four (>4 times per week) for three symptoms: snorting or gasping; loud snoring; and breathing cessation, choking or struggling for breath during sleep [20].
Covariates
Height was determined to within one millimetre using a wall stadiometer (Surgical and Medical Products No. 26SM, Mentone Education Supplies, Melbourne, Austra-lia), body mass was measured to the nearest 100 g with an electronic scale (Tanita BF-681). Smoking status was defined as ‘never smoker’, ‘past smoker’ and ‘current smoker’. Gross annual household income was collected in approximate 20,000 Australian Dollar (AUD) increments and reduced to three categories of 40,000 AUD incre-ments for analysis. The number of people residing in the household was categorised as one, two, three, four, and five or more. Medication inventory was performed during clinical assessment and participants were asked if they had taken bronchodilators or any other respiratory medication in the previous 24 hours. Doctor-diagnosis of Obstructive Sleep Apnoea Syndrome (OSAS) and management of OSAS with Continuous Positive Airway Pressure (CPAP) therapy was determined by questionnaire.
Statistical analysis
of observed cases, the SPR was calculated as the ratio of observed to expected cases. The same method was used to estimate the SPR’s for current and past smoking using
2007–2008 Australian NHS data as the standard
population.
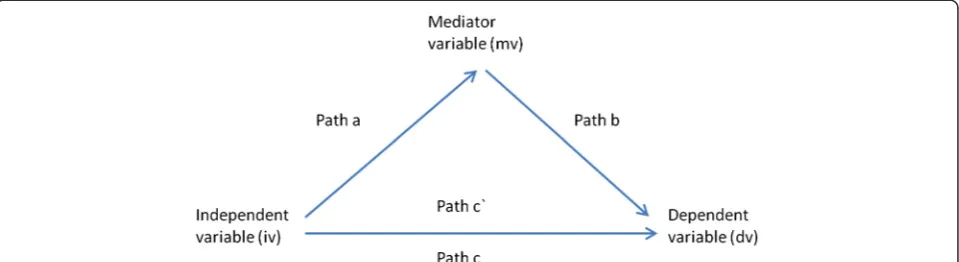
Ordinary least squares regression was used to model the associations of IAF with: spirometric outcomes and log-CASS. Prevalence ratios (PR) for the association of IAF with current doctor diagnosed asthma were esti-mated using Generalised Linear Models with Poisson distribution, log-link function and robust estimation of confidence intervals as suggested by Wolkewitz et al. 2007 [23]. Formal mediation tests were conducted in Stata 11 using -sgmediation-, which uses bootstrap ana-lyses to estimate the indirect effect of the independent variable on the dependent variable through the mediator variable, overcoming the assumption of a normal sam-pling distribution required for use of the classical Sobel test. Bootstrap analysis involves drawing a large number of samples, in this case 5000 (with replacement), from the data set, computing the indirect effect for each sam-ple, and then generating an average indirect effect across all samples. Regression paths and criteria for mediation followed those outlined by Baron and Kenny [24] and summarised in Figure 1.
Results
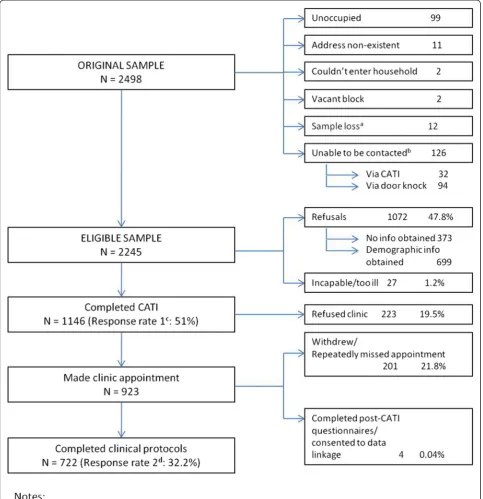
Overall, 51% of eligible households participated in the CATI and 32.2% participated in the clinical study (Figure 2).
The estimated population prevalence of current
doctor-diagnosed asthma was 19.9% [95% CI 16.7–23.5%] which
was 2.4 times higher than Australian national prevalence estimates after age- and sex-standardisation [95%CI for
the SPR 2.1– 2.9]. The prevalence of both current (23%
[95% CI 19.6–26.7%]; SPR 1.11 [95% CI 0.95 - 1.29]) and
past smoking (28.6% [95% CI 25.1 – 32.4%]; SPR 0.96
[95% CI 0.83 - 1.10]) in Whyalla were similar to those of Australia overall.
Of the 726 adults who completed comprehensive ques-tionnaires, 236 men and 348 women (n = 562, 78%) com-pleted baseline and post-bronchodilator spirometric manoeuvres of acceptable quality. In total, 98 participants did not complete spirometry tests for various reasons: opted out (n = 29); terminated spirometry protocols early (n = 66); excluded on the basis of illness, injury or doctor’s advice (n = 3). Sixty-six participants completed spirometry, but breathing manoeuvres were of unacceptable quality to provide valid and reliable data (n = 60) or technical mal-functions were experienced (n = 6).
Post-bronchodilator FEV1/FVC, FEV1, PEF and FEF25%-75% were all lower and there was a non-significant trend to-wards higher FEV1reversibility in current doctor-diagnosed asthmatics when compared with non-asthmatics. CASS was higher in current doctor-diagnosed asthmatics when compared with non-asthmatics but it did not differ by spir-ometry completion or quality grade in either group (Table 1). Neither IR nor SDB symptom scores were higher in the current doctor-diagnosed asthmatics when compared with non-asthmatics, but within the doctor-diagnosed group, IR was higher in those who did not attempt or complete an acceptable spirometry test (Table 1). A complete respiratory, metabolic and socio-demographic de-scription of the study sample by asthma diagnosis is pre-sented in Additional file 1.
Obstructive sleep apnoea syndrome (OSAS) had been doctor-diagnosed in 42 participants (5.9%) and 20 of these used CPAP to manage the condition. CPAP use was associated with a lower log CASS (1.18 ± 0.56 v 1.52 ± 0.40, p = 0.04) but non-significant differences in current doctor diagnosed asthma prevalence, IAF, IR,
SDB symptom score, post FEV1/FVC and reversibility of
[image:4.595.59.539.571.702.2]FEV1(data not shown).
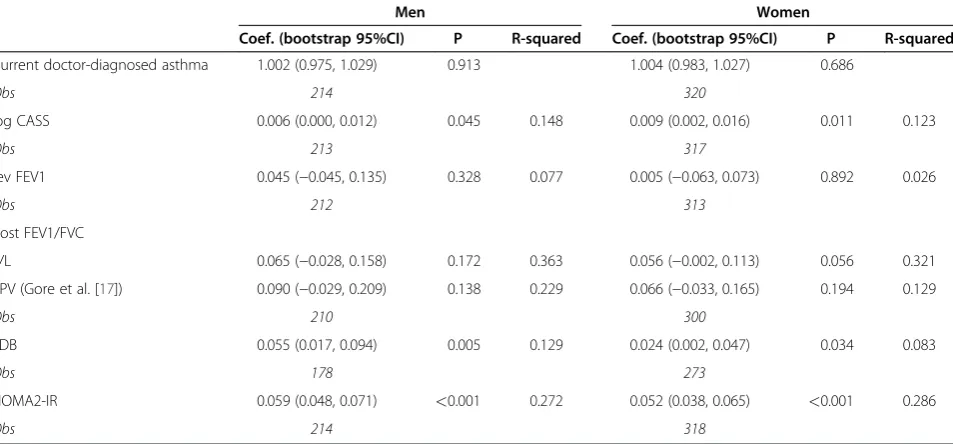
Table 2 shows the covariate-adjusted associations of IAF with current doctor-diagnosed asthma, CASS, spirometric outcomes, IR and SDB symptom frequency in men and women who completed acceptable spirometry tests. IAF was not associated with current doctor-diagnosed asthma,
Table 1 Respiratory, metabolic and socio-demographic characteristics, The Whyalla Intergenerational Study of Health (WISH, 2008–2009)
Current Doctor-Diagnosed Asthma Asthma x spirometry quality
No (n = 575) Yes (n = 151) F(df) or Chi2(df) P F(df) or Chi2(df) P
Completion/ No test 77 21
acceptability of spirometry Unacceptable 51 15
Acceptable 447 115
Outcomes, asthma symptoms
CASS, range 0-8 No test 3.62 (3.26, 3.99) 5.33 (4.64, 6.27) F(5,711) = 19.26 <0.001 F(2,711) = 1.16 0.32 Unacceptable 3.28 (2.83, 3.72) 5.23 (4.35, 6.11)
Acceptable 3.28 (3.13, 3.43) 4.56 (4.26, 4.86)
log CASS No test 1.16 (1.05, 1.27) 1.63 (1.41, 1.84) F(5,711) = 14.33 <0.001 F(2,711) = 0.55 0.58 Unacceptable 1.09 (0.95, 1.22) 1.54 (1.27, 1.82)
Acceptable 1.07 (1.03, 1.12) 1.42 (1.33, 1.51)
Outcomes, spirometry (acceptable tests only)
FEV1 reversibility, L 0.11 (0.09, 0.12) 0.12 (0.09, 0.14) F(1, 538) = 0.22 0.64
FEV1 reversibility,% 3.88 (3.27, 4.49) 5.03 (3.83, 6.24) F(1, 538) = 2.80 0.10
post FEV1, L 3.01 (2.93, 3.10) 2.76 (2.60, 2.92) F(1, 538) = 7.62 <0.01 post FVC, L 3.80 (3.70, 3.90) 3.64 (3.44, 3.83) F(1, 523) = 2.02 0.16
post FEV1/FVC,% 79.46 (78.73, 80.19) 76.14 (74.70, 77.57) F(1, 523) = 16.34 <0.001 post PEF, L/s 7.83 (7.62, 8.03) 7.23 (6.83, 7.63) F(1, 538) = 6.80 <0.01 post FEF25%-75%, L/s 3.06 (2.94, 3.17) 2.55 (2.32, 2.78) F(1, 538) = 15.16 <0.001 FEV1, ppv† 90.34 (88.79, 91.88) 84.20 (81.16, 87.24) F(1, 538) = 12.46 <0.001 FVC, ppv† 93.90 (92.44, 95.35) 91.70 (88.81, 94.60) F(1, 523) = 1.76 0.19
FEV1/FVC, ppv† 96.66 (95.81, 97.50) 91.03 (89.35, 92.70) F(1, 523) = 34.55 <0.001 PEF, ppv† 97.24 (95.50, 98.98) 92.44 (89.02, 95.85) F(1, 538) = 6.03 0.02
FEF25%-75%, ppv† 84.55 (81.90, 87.20) 71.28 (66.07, 76.49) F(1, 538) = 19.79 <0.001 Independent variables
Intra-abdominal fat,% No test 39.58 (37.26, 41.90) 39.44 (34.92, 43.96) F(5,692) = 1.16 0.33 F(2,692) = 1.71 0.18
Unacceptable 38.81 (35.92, 41.70) 33.06 (27.66, 38.47)
Acceptable 39.55 (38.57, 40.52) 39.91 (37.99, 41.83)
Mediator variables
HOMA2-IR No test 1.35 (1.09, 1.66) 2.01 (1.52, 2.52) F(5,703) = 1.51 0.19 F(2,703) = 3.18 0.04
Unacceptable 1.39 (1.06, 1.71) 1.71 (1.09, 2.34)
Acceptable 1.40 (1.30, 1.59) 1.32 (1.11, 1.54)
SDB symptom score, range 0-12 No test 1.18 (0.63, 1.73) 1.87 (0.75, 2.98) F(5,594) = 1.74 0.12 F(2,594) = 0.07 0.93
Unacceptable 1.54 (0.83, 2.25) 2.09 (0.79, 3.40)
Acceptable 0.96 (0.74, 1.18) 1.39 (0.93, 1.85)
A description of the outcome, independent and mediator variables, and covariates by current doctor-diagnosed asthma and spirometry completion and quality, The Whyalla Intergenerational Study of Health (WISH, 2008–2009).
FEV1/FVC, FEV1 reversibility, FEF25-75% or PEF and in men or women. A one percent increase in IAF was asso-ciated with a significant>1 unit increase in CASS in both men and women (0.006 and 0.009 respectively on the log scale) although the association in men was of borderline significance and was not robust to repeated bootstrap ana-lysis. The associations of CASS with both FEV1/FVC and
FEV1were different between men and women. For every
log-unit increase in CASS FEV1/FVC declined by 4%
(p <0.001) and FEV1by 295 mL in men (p = 0.007) but there were no associations in women.
A one percent increase in IAF was associated with a
12 ml and 20 mL decrease in FEV1and FVC respectively
in men and a 4 ml and 7 mL decrease respectively in women. This corresponded to reductions in the
percent-age of predicted value for FEV1of 34% in men and 16%
in women; and for FVC of 46% in men and 24% in women. IAF was positively associated with IR and SDB symptom frequency in both men and women, although the significance of the association at p <0.05 between SDB and IAF in women was not robust to repeated bootstrap analysis.
The significant associations of IAF with CASS, FEV1
and FVC were tested for mediation by IR and SDB symptom frequency in men and women. After adjust-ment for IAF, IR was not associated with any of the three outcomes in men or women (path b, data not
shown) and thus did not meet the necessary criteria for mediation. In men, after adjustment for IAF, SDB
fre-quency was significantly associated with FEV1and FVC
(path b) and mediated between 12% and 26% of the associations with IAF (Table 3). The small total ‘
effec-t’(association) between IAF and CASS in men did not
reach significance during mediation analysis and thus the 65% mediation of that association is of little signifi-cance. In women, associations between the SDB and IAF were weak and of borderline significance corresponding to relatively minor indirect effects.
Discussion
[image:7.595.61.538.123.345.2]In this population there was little evidence to support the existence of an obesity-induced obstructive airway phenotype. These findings are inconsistent with the pre-viously documented associations between central obesity and asthma, particularly mild non-atopic asthma pheno-types [1-3,25]. This may suggest the dominance of other asthma-causing agents over obesity in this population. The only indication of a link between abdominal adipos-ity and asthma was the association between greater IAF and more frequent asthma symptoms, particularly in women where there was no relation to measured airway obstruction. Thus, this association may be partly explained by greater perceived exertion from daily Table 2 Associations of intra-abdominal fat percentage with lung function and asthma outcomes, and hypothesised mediators (sleep disordered breathing score and insulin resistance) in men and women, The Whyalla Intergenerational Study of Health (WISH, 2008–2009)
Men Women
Coef. (bootstrap 95%CI) P R-squared Coef. (bootstrap 95%CI) P R-squared
Current doctor-diagnosed asthma 1.002 (0.975, 1.029) 0.913 1.004 (0.983, 1.027) 0.686
Obs 214 320
log CASS 0.006 (0.000, 0.012) 0.045 0.148 0.009 (0.002, 0.016) 0.011 0.123
Obs 213 317
rev FEV1 0.045 (−0.045, 0.135) 0.328 0.077 0.005 (−0.063, 0.073) 0.892 0.026
Obs 212 313
post FEV1/FVC
L/L 0.065 (−0.028, 0.158) 0.172 0.363 0.056 (−0.002, 0.113) 0.056 0.321
PPV (Gore et al. [17]) 0.090 (−0.029, 0.209) 0.138 0.229 0.066 (−0.033, 0.165) 0.194 0.129
Obs 210 300
SDB 0.055 (0.017, 0.094) 0.005 0.129 0.024 (0.002, 0.047) 0.034 0.083
Obs 178 273
HOMA2-IR 0.059 (0.048, 0.071) <0.001 0.272 0.052 (0.038, 0.065) <0.001 0.286
Obs 214 318
Table 3 Mediation by sleep-disordered breathing symptom frequency of associations of intra-abdominal fat with comprehensive asthma symptom score, FEV1
and FVC expressed as Litres and‘percentage of predicted values’(PPV) in men and women, The Whyalla Intergenerational Study of Health (WISH, 2008–2009)
Path a Path b Total effect (Path c) Direct effect (Path c') Bootstrapped %
Dependent variables (dv) mv regressed on IAF dv regressed on mv dv regressed on IAF dv regressed on IAF Indirect Effect Mediated
controlling for IAF controlling for mv
MEN
log CASS,n = 178 0.060 (0.025, 0.094) 0.061 (0.027, 0.095) 0.006 (−0.002, 0.013) 0.002 (−0.006, 0.010) 0.004 (0.001, 0.007) 64.7
post FEV1,n = 178
Litres 0.060 (0.025, 0.094) −0.047 (−0.080, -0.014) −0.012 (−0.019, -0.005) −0.009 (−0.017, -0.002) −0.003 (−0.006, -0.001) 23.4
PPV(Gore et al.[17]) 0.061 (0.026, 0.096) −1.462 (−2.370, -0.555) −0.344 (−0.553, -0.135) −0.255 (−0.466, -0.045) −0.087 (−0.187, -0.026) 25.8
post FVC,n = 176
Litres 0.060 (0.026, 0.095) −0.040 (−0.079, -0.002) −0.020 (−0.029, -0.011) −0.018 (−0.027, -0.009) −0.002 (−0.006, -0.000) 12.1
PPV(Gore et al.[17]) 0.061 (0.026, 0.096) −1.271 (−2.104, -0.439) −0.467 (−0.658, -0.275) −0.389 (−0.583, -0.196) −0.076 (−0.154, -0.025) 16.6
WOMEN
log CASS,n = 271 0.024 (−0.001, 0.049) 0.054 (0.023, 0.085) 0.010 (0.003, 0.016) 0.008 (0.002, 0.015) 0.001 (0.000, 0.003) 13.7
post FEV1,n = 267
Litres 0.021 (−0.004, 0.047) −0.018 (−0.044, 0.009) −0.005 (−0.010, 0.001) −0.004 (−0.010, 0.002) −0.000 (−0.002, 0.000) 8.5
PPV(Gore et al.[17]) 0.021 (−0.004, 0.047) −0.821 (−1.810, 0.167) −0.204 (−0.409, 0.001) −0.186 (−0.392, 0.020) −0.019 (−0.066, 0.001) 8.6
post FVC,n = 254
Litres 0.022 (−0.005, 0.048) −0.013 (−0.044, 0.019) −0.008 (−0.014, -0.001) −0.007 (−0.014, -0.001) −0.000 (−0.002, 0.000) 3.7
PPV(Gore et al.[17]) 0.021 (−0.005, 0.048) −0.587 (−1.551, 0.377) −0.263 (−0.461, -0.064) −0.250 (−0.449, -0.051) −0.013 (−0.065, 0.006) 4.8
Mediation by sleep-disordered breathing symptom frequency of associations of intra-abdominal fat with comprehensive asthma symptom score, FEV1and FVC expressed as volumes and‘percentage of predicted values’(PPV) in men and women, The Whyalla Intergenerational Study of Health (WISH, 2008–2009).
CASS, comprehensive asthma symptom score; FEV1, forced expiratory volume in 1 second; FVC, forced vital capacity; PPV, Percentage of Predicted Value. Criteria for mediation are: (1) significantpath cassociation; (2) significantpath aassociation; (3) significantpath bassociation with a reduction in thepath ccoefficient (c`). Covariates included in all models were age, current and past smoking, gross annual household income and number of household residents. For lung function models height and respiratory medication in the previous 24 hours were included as covariates.
BMC
Pulmonary
Medicine
2012,
12
:31
Page
8
o
f
1
1
ntral.com/1
physical tasks in more abdominally obese people rather than true airway obstruction.
The contribution of the high prevalence of abdominal obesity to the relative 2.4 case excess of current doctor-diagnosed asthma in this community would appear therefore to be low and instead be dominated by non-obesity induced phenotypes. Asthma symptoms were higher and post-bronchodilator lung function was poorer in those who reported a current doctor-diagnosis of asthma, but as previously noted asthma symptom scores were poorly correlated with measured airway ob-struction in women, who were significantly more likely than men to report a current doctor-diagnosis of asthma. Anecdotally, there is high awareness of respira-tory disease in this city which may contribute to greater knowledge of respiratory symptoms, higher levels of help-seeking by those experiencing respiratory symp-toms (which may be biased towards women) and more widespread asthma screening and diagnosis by general practitioners. In terms of other potentially contributing population factors, the city has a greater than twenty percent enrichment of blue-collar workers when com-pared with South Australia and Australia overall [26], who are largely employed in the steel industry. This may confer significantly more occupational asthma on the population over and above the 15% of cases in working aged adults estimated to be either caused or aggravated by occupational exposures from previous research [27]. The degree to which occupational exposures, environ-mental dust exposure or other population factors such as asthma awareness (population and general practi-tioners) and vigilance in help-seeking contribute to the excess of, and gender difference in, current doctor-diagnosed asthma remains to be determined in this community which has implications for community inter-ventions on asthma.
IAF was, however, associated with FEV1and FVC in
the Whyalla population. Based on age-related rates of decline in lung volumes from the US National Health and Nutrition Examination Survey (NHANES) [28] a five percent increase in IAF (adjusted for IR or SDB symptom frequency) was equivalent to two years of
age-related decline in the FEV1 (60 ml) and more
than three years of age-related decline in the FVC (100 ml) of men; the effects were up to three times smaller in women. These associations, including being three to four times weaker in women compared with men, were of similar magnitude to those of other studies [25,29-31], although the range of adiposity measures used make cross-study comparisons difficult.
We did not observe the inverse association between IR and expired lung volumes previously reported in cross-sectional studies of other populations [32,33]. Prospect-ive studies have shown that reduced lung function can
precede the development of IR and diabetes [34-39] pos-sibly through microangiopathy of alveolar capillaries and pulmonary arterioles [40,41]. Thus it is possible that the absence of a cross-sectional association between lung function and IR in this study may be due to healthy-participant bias. If those with more advanced disease (reduced lung function) and IR, were less likely to par-ticipate due to poor health (or having died) than those with earlier stage reductions in lung function without IR, then the association between lung function and IR would be underestimated.
Associations between IAF and SDB symptom fre-quency were weaker in women than in men and had
negligible mediating effects on FEV1, FVC or CASS. In
men however, SDB symptom frequency mediated be-tween 12% and 17% of the association of IAF with FVC and between 23% and 26% of the association with
FEV1. This finding is inconsistent with two small
studies (n≤20) that suggested six to eight weeks of con-tinuous positive airway pressure treatment for sleep ap-noea was not effective in improve spirometric measures of lung function [42,43] but improved asthma symptoms. These studies were unlikely to have been powered to de-tect meaningful changes in these outcomes, but they do raise caution about interpreting causal directions from these cross-sectional findings.
There is no universally applied clinical definition of asthma and case assignment in epidemiological studies is often defined by self-reported doctor-diagnosis, which has good sensitivity (91%), specificity (97%) and reason-able positive predictive value (60%) for indicating preva-lent disease [44]. The combination of measured lung function, self-reported asthma symptom frequency and doctor-diagnosed current asthma as outcomes; and the specific focus on intra-abdominal fat estimated using DXA measurements as opposed to most other studies which have relied on BMI or waist girths as measures of adiposity are particular strengths of this study. Assess-ment of SDB was limited to self-reported symptom fre-quencies which have good sensitivity (85%) but poor specificity (55%) for identifying men with obstructive sleep apnoea [20].
result in statistical or clinical significance. In Table 1, we showed that within the current doctor-diagnosed asthmatics, IR was higher in those who did not at-tempt or complete an acceptable spirometry test. As stated previously, if those asthmatics with more se-vere IR for which acceptable quality spirometric data were not available also had poorer lung function, than those without IR, then the association between lung function and IR would theoretically be underestimated. However, Table 1 also reveals evidence that CASS did not differ by spirometry completion or quality grade in either current doctor-diagnosed asthmatics or non-asthmatics which suggests non-completion of successful spirometry was not dependent on greater obstructive airway symp-tom severity indicating that this may in fact not be a source of bias.
Conclusions
In this population with a high prevalence of abdominal obesity and an excess of doctor-diagnosed asthma, IAF was not a major factor in doctor-diagnosed asthma or airway obstruction although women with higher IAF perceived more severe asthma symptoms which did not correlate with lower FEV1. Higher IAF was significantly
associated with lower FEV1 and FVC and in men SDB
mechanisms may contribute up to one quarter of this association.
Additional file
Additional file 1:Table S1.Respiratory, metabolic and socio-demographic characteristics, The Whyalla Intergenerational Study of Health (WISH, 2008-2009).
Competing interests
The authors declare no competing interests.
Authors’contributions
All authors with the exception of TJP participated in the design of the study. All authors contributed to the interpretation of results and reviewing the manuscript for important intellectual content. Additionally, MTH and TJP participated in data collection. MTH performed the statistical analysis and drafted the manuscript. All authors read and approved the final manuscript.
Acknowledgements
We acknowledge the continued support, guidance and perspective of the WISH Community Advisory Group and all the participants who have given their time to the study. The clinic staff Kate Warren, Deb Misan, Leanne Gibbons, Chris Creber, Corey Beinke-Heath and Helen Mills, and administrative staff Stephanie Coombes and Hayley-Maree Ewbank. We acknowledge also the efforts of the participant recruitment staff. We gratefully acknowledge the contribution of the North West Adelaide Health Study team in their intellectual input into the processes, protocols and measurement methods and for the training of staff. We are particularly grateful to Alicia Montgomerie. We acknowledge Dr. Natasha Howard, Mr Neil Coffee, and Dr. Catherine Paquet from the Social Epidemiology and Evaluation Research Group, University of South Australia for their assistance with obtaining population census data from the Australian Bureau of Statistics, and Scott Berry for data management and Iordan Kostadinov for assistance with the preparation of tables. Finally we acknowledge the Premiers Science Research Fund as the primary source of funds for this study
through the South Australian Population Health Intergenerational Research collaborative. We acknowledge our collaboration partners, the North West Adelaide Health Study, Florey Adelaide Male Ageing Study and the Australian Longitudinal Study of Ageing.
Funding
South Australian Premiers Science Research Fund (RAM). MTH is supported by a Post-doctoral Training Fellowship (Public Health) from the National Health and Medical Research Council (NHMRC) of Australia (# 511345). RAM is supported by an NHMRC Public Health Practitioner Fellowship.
Author details
1
Sansom Institute for Health Research, Division of Health Sciences, University of South Australia, Adelaide, SA, Australia.2Spencer Gulf Rural Health School (SGRHS), University of South Australia and The University of Adelaide, Whyalla Norrie, SA, Australia.3Centre for Rural Health and Community Development (CRHaCD), University of South Australia, Whyalla Norrie, SA, Australia.4Discipline of Medicine, The University of Adelaide, Adelaide, SA, Australia.5Population Research and Outcomes Studies, Discipline of Medicine, The University of Adelaide, Adelaide, SA, Australia.6Nutrition Physiology Research Centre, University of South Australia, Adelaide, SA, Australia.
Received: 17 January 2012 Accepted: 17 June 2012 Published: 28 June 2012
References
1. Chen Y, Rennie D, Cormier Y, Dosman J:Sex specificity of asthma associated with objectively measured body mass index and waist circumference: the Humboldt study.Chest2005,128:3048–3054. 2. Chen Y, Dales R, Jiang Y:The association between obesity and asthma is
stronger in nonallergic than allergic adults.Chest2006,130:890–895. 3. Appleton SL, Adams RJ, Wilson DH, Taylor AW, Ruffin RE:Central obesity is
associated with nonatopic but not atopic asthma in a representative population sample.J Allergy Clin Immunol2006,118:1284–1291.
4. Raviv S, Dixon AE, Kalhan R, Shade D, Smith LJ:Effect of obesity on asthma phenotype is dependent upon asthma severity.J Asthma2011, 48:98–104.
5. Lugogo NL, Kraft M, Dixon AE:Does obesity produce a distinct asthma phenotype?J Appl Physiol2010,108:729–734.
6. Sutherland TJ, Goulding A, Grant AM, Cowan JO, Williamson A, Williams SM, Skinner MA, Taylor DR:The effect of adiposity measured by dual-energy X-ray absorptiometry on lung function.Eur Respir J2008,32:85–91. 7. Choi JH, Park S, Shin YH, Kim MY, Lee YJ:Sex differences in the
relationship between metabolic syndrome and pulmonary function: The 2007 Korean National Health and Nutrition Examination Survey.Endocr J 2011,58:459–465.
8. Hickson DA, Burchfiel CM, Liu J, Petrini MF, Harrison K, White WB, Sarpong DF:Diabetes, impaired glucose tolerance, and metabolic biomarkers in individuals with normal glucose tolerance are inversely associated with lung function: the Jackson Heart Study.Lung2011,189:311–321. 9. Haren MT, Misan G, Grant JF, Buckley JD, Howe PRC, Newbury J, Taylor AW,
McDermott RA:Proximal correlates of metabolic phenotypes during 'at-risk' and 'case' stages of the metabolic disease continuum.Nutrition and Diabetes2012,2:E24.
10. Haren MT, Stokes A, Taylor J, McDermott RA:Community participation in the Whyalla Intergenerational Study of Health (WISH): looking back on the possible influences of knowledge, trust and power.Public Health Bulletin SA2011,8:41–48.
11. South Australian Department of Health:The Whyalla Health Impact Study. In. Adelaide: South Australian Department of Health; 2006.
12. Dal Grande E, Taylor AW:Sampling and coverage issues of telephone surveys used for collecting health information in Australia: results from a face-to-face survey from 1999 to 2008.BMC Med Res Methodol2010, 10:77.
13. Dillman DA:Mail and telephone surveys: The total design method. New York: Wiley-Interscience (Wiley & Sons); 1978.
15. American Thoracic Society:Standardization of Spirometry, 1994 Update. Am J Respir Crit Care Med1995,152:1107–1136.
16. Walters JA, Wood-Baker R, Walls J, Johns DP:Stability of the EasyOne ultrasonic spirometer for use in general practice.Respirology2006, 11:306–310.
17. Gore CJ, Crockett AJ, Pederson DG, Booth ML, Bauman A, Owen N: Spirometric standards for healthy adult lifetime nonsmokers in Australia. Eur Respir J1995,8:773–782.
18. Australian Centre for Asthma Monitoring (ACAM):Survey questions for monitoring national asthma indicators.InSurvey questions for monitoring national asthma indicators. Edited by Australian Insititute of Health and Welfare. Canberra; 2007.
19. Levy JC, Matthews DR, Hermans MP:Correct homeostasis model assessment (HOMA) evaluation uses the computer program.Diabetes Care1998,21:2191–2192.
20. Maislin G, Pack AI, Kribbs NB, Smith PL, Schwartz AR, Kline LR, Schwab RJ, Dinges DF:A survey screen for prediction of apnea.Sleep1995,18:158–166. 21. Australian Bureau of Statistics:Population by age and sex South Australia
(2007). Canberra: Commonwealth of Australia; 2008.
22. Australian Centre for Asthma Monitoring (ACAM):2008.InAsthma in Australia 2008. Edited by Australian Insititute of Health and Welfare. Canberra; 2008.
23. Wolkewitz M, Bruckner T, Schumacher M:Accurate variance estimation for prevalence ratios.Methods Inf Med2007,46:567–571.
24. Baron RM, Kenny DA:The moderator-mediator variable distinction in social psychological research: conceptual, strategic, and statistical considerations.J Pers Soc Psychol1986,51:1173–1182.
25. Chen Y, Rennie D, Cormier YF, Dosman J:Waist circumference is associated with pulmonary function in normal-weight, overweight, and obese subjects.Am J Clin Nutr2007,85:35–39.
26. Australian Bureau of Statistics (ABS):Population and Housing Census: Basic Community Profile, 2006.InBook Population and Housing Census. Edited by ABS ed. Canberra: Basic Community Profile, 2006; 2006.
27. Nicholson PJ, Cullinan P, Taylor AJ, Burge PS, Boyle C:Evidence based guidelines for the prevention, identification, and management of occupational asthma.Occup Environ Med2005,62:290–299.
28. Berclaz PY, Gao H, Tobian JA, Swanson DL, Webb DM, Crapo RO, Jensen RL: The impact of diabetes and age on pulmonary function: data from the National Health and Nutrition Examination Survey.Diabetes Res Clin Pract 2009,83:e1–e3.
29. Canoy D, Luben R, Welch A, Bingham S, Wareham N, Day N, Khaw KT: Abdominal obesity and respiratory function in men and women in the EPIC-Norfolk Study, United Kingdom.Am J Epidemiol2004,159:1140–1149. 30. Rossi A, Fantin F, Di Francesco V, Guariento S, Giuliano K, Fontana G,
Micciolo R, Solerte SB, Bosello O, Zamboni M:Body composition and pulmonary function in the elderly: a 7-year longitudinal study.Int J Obes (Lond)2008,32:1423–1430.
31. Rossi AP, Watson NL, Newman AB, Harris TB, Kritchevsky SB, Bauer DC, Satterfield S, Goodpaster BH, Zamboni M:Effects of body composition and adipose tissue distribution on respiratory function in elderly men and women: the health, aging, and body composition study.J Gerontol A Biol Sci Med Sci2011,66:801–808.
32. McKeever TM, Weston PJ, Hubbard R, Fogarty A:Lung function and glucose metabolism: an analysis of data from the Third National Health and Nutrition Examination Survey.Am J Epidemiol2005,161:546–556. 33. Lawlor DA, Ebrahim S, Smith GD:Associations of measures of lung
function with insulin resistance and Type 2 diabetes: findings from the British Women's Heart and Health Study.Diabetologia2004,47:195–203. 34. Engstrom G, Janzon L:Risk of developing diabetes is inversely related to
lung function: a population-based cohort study.Diabet Med2002, 19:167–170.
35. Engstrom G, Hedblad B, Nilsson P, Wollmer P, Berglund G, Janzon L:Lung function, insulin resistance and incidence of cardiovascular disease: a longitudinal cohort study.J Intern Med2003,253:574–581.
36. Lazarus R, Sparrow D, Weiss ST:Impaired ventilatory function and elevated insulin levels in nondiabetic males: the Normative Aging Study. Eur Respir J1998,12:635–640.
37. Walter RE, Beiser A, Givelber RJ, O'Connor GT, Gottlieb DJ:Association between glycemic state and lung function: the Framingham Heart Study.Am J Respir Crit Care Med2003,167:911–916.
38. Lange P, Parner J, Schnohr P, Jensen G:Copenhagen City Heart Study: longitudinal analysis of ventilatory capacity in diabetic and nondiabetic adults.Eur Respir J2002,20:1406–1412.
39. Lazarus R, Sparrow D, Weiss ST:Baseline ventilatory function predicts the development of higher levels of fasting insulin and fasting insulin resistance index: the Normative Aging Study.Eur Respir J1998,12:641–645. 40. Vracko R, Thorning D, Huang TW:Basal lamina of alveolar epithelium and capillaries: quantitative changes with aging and in diabetes mellitus.Am Rev Respir Dis1979,120:973–983.
41. Klein OL, Krishnan JA, Glick S, Smith LJ:Systematic review of the association between lung function and Type 2 diabetes mellitus.Diabet Med2010,27:977–987.
42. Ciftci TU, Ciftci B, Guven SF, Kokturk O, Turktas H:Effect of nasal continuous positive airway pressure in uncontrolled nocturnal asthmatic patients with obstructive sleep apnea syndrome.Respir Med2005, 99:529–534.
43. Lafond C, Series F, Lemiere C:Impact of CPAP on asthmatic patients with obstructive sleep apnoea.Eur Respir J2007,29:307–311.
44. Oksanen T, Kivimaki M, Pentti J, Virtanen M, Klaukka T, Vahtera J:Self-report as an indicator of incident disease.Ann Epidemiol2010,20:547–554.
doi:10.1186/1471-2466-12-31
Cite this article as:Harenet al.:Abdominal adiposity and obstructive airway disease: testing insulin resistance and sleep disordered breathing mechanisms.BMC Pulmonary Medicine201212:31.
Submit your next manuscript to BioMed Central and take full advantage of:
• Convenient online submission
• Thorough peer review
• No space constraints or color figure charges
• Immediate publication on acceptance
• Inclusion in PubMed, CAS, Scopus and Google Scholar
• Research which is freely available for redistribution