Associated Fish Assemblages
Karen M. Chong-Seng1*, Thomas D. Mannering1,2, Morgan S. Pratchett1, David R. Bellwood1,2,
Nicholas A. J. Graham1
1Australian Research Council Centre of Excellence for Coral Reef Studies, James Cook University, Townsville, Queensland, Australia,2School of Marine and Tropical Biology, James Cook University, Townsville, Queensland, Australia
Abstract
Accumulative disturbances can erode a coral reef’s resilience, often leading to replacement of scleractinian corals by macroalgae or other non-coral organisms. These degraded reef systems have been mostly described based on changes in the composition of the reef benthos, and there is little understanding of how such changes are influenced by, and in turn influence, other components of the reef ecosystem. This study investigated the spatial variation in benthic communities on fringing reefs around the inner Seychelles islands. Specifically, relationships between benthic composition and the underlying substrata, as well as the associated fish assemblages were assessed. High variability in benthic composition was found among reefs, with a gradient from high coral cover (up to 58%) and high structural complexity to high macroalgae cover (up to 95%) and low structural complexity at the extremes. This gradient was associated with declining species richness of fishes, reduced diversity of fish functional groups, and lower abundance of corallivorous fishes. There were no reciprocal increases in herbivorous fish abundances, and relationships with other fish functional groups and total fish abundance were weak. Reefs grouping at the extremes of complex coral habitats or low-complexity macroalgal habitats displayed markedly different fish communities, with only two species of benthic invertebrate feeding fishes in greater abundance in the macroalgal habitat. These results have negative implications for the continuation of many coral reef ecosystem processes and services if more reefs shift to extreme degraded conditions dominated by macroalgae.
Citation:Chong-Seng KM, Mannering TD, Pratchett MS, Bellwood DR, Graham NAJ (2012) The Influence of Coral Reef Benthic Condition on Associated Fish Assemblages. PLoS ONE 7(8): e42167. doi:10.1371/journal.pone.0042167
Editor:Richard K.F. Unsworth, Swansea University, United Kingdom
ReceivedApril 14, 2012;AcceptedJuly 2, 2012;PublishedAugust 1, 2012
Copyright:ß2012 Chong-Seng et al. This is an open-access article distributed under the terms of the Creative Commons Attribution License, which permits unrestricted use, distribution, and reproduction in any medium, provided the original author and source are credited.
Funding:This study was funded by the Australian Research Council, the Seychelles Fishing Authority, and a Western Indian Ocean Marine Science Association Marine Research Grant. The funders had no role in study design, data collection and analysis, decision to publish, or preparation of the manuscript.
Competing Interests:The authors have declared that no competing interests exist.
* E-mail: [email protected]
Introduction
An ecosystem’s ability to recover from degradation is eroded by increases in frequency, intensity and array of disturbances [1–4]. On coral reefs, increasing anthropogenic pressures (e.g. fisheries exploitation) and climate change, are compounding upon pre-existing disturbances (e.g. cyclones) and causing declines in coral cover and structural complexity [5,6], associated changes in coral and fish community composition [7–9], and shifts in the dominant benthic biota [10–12]. Documented shifts on coral reefs include changes to corallimorphs, sponges, or most often, macroalgae domination of the benthos [10–12]. Although these other benthic lifeforms are typical components of most reefs, scleractinian coral domination is considered preferable; corals function as the main provider of the complex structural habitat that is largely responsible for the high diversity of reef associated organisms, and the provision of a range of ecosystem services, such as vital food resources [13–15].
All major coral reef regions of the world have undergone declines in coral cover [5,16,17]. In conjunction with these reductions in coral cover, is an increasing documentation of shifts in the dominant benthic biota (reviewed by: [12]) that focus primarily on causes of the shifts, and subsequent changes in the benthic community composition. For example, although the
example of the former, Brazilian forests contained 26 lizard species whereas the grassland alternative contained 30 species [30]. In contrast, lakes lose their high submerged macrophyte and animal diversity following shifts to turbid eutrophic waters [31], while shifts from rangelands to desert lead to much reduced diversity [32].
The interactions between the foundational structure upon which the live reef is built, the underlying substratum, and changes in the benthic community, may hinder essential ecosystem processes required for recovery, and perpetuate an alternative community. For example, coral recruit survivorship is considered an essential process for recovery [33,34] and can be inhibited by burial and damage of new recruits by highly mobile rubble substrata during storms [35–37]. The relationships between a reef’s underlying substratum and dominant benthos are generally unknown, but knowledge of such relationships would further our understanding of the development and endurance of degraded conditions on coral reefs.
Coral reefs of the Seychelles archipelago offer a unique opportunity to assess differing benthic communities. The inner Seychelles islands are geographically isolated, were severely impacted by the 1998 mass bleaching event, and there is a good record of post-disturbance degradation [6,17,38,39]. Ten years after this major bleaching event, coral cover in the inner Seychelles ranged from ,5% coral cover to .20% coral cover, which is amongst the lowest in the region [6,40]. Individual reefs have shown highly varied responses to disturbance, and there have been reports of benthic community shifts on some reefs [28,40]. However, detailed characterisation of the benthic condition of these reefs is lacking, along with the implications of benthic condition for other aspects of the reef community. We therefore quantitatively characterised the benthos, underlying substratum, and fishes of inner Seychelles reefs to investigate: 1) if there was a link between underlying substrata and benthic condition; and 2) the relationship between benthic condition and the taxonomic and functional composition of associated fish assemblages.
Materials and Methods
Ethics Statement
A research permit for this work was granted by the Seychelles government through the Seychelles Bureau of Standards; permit number A0347.
Study Site and Sampling Design
Twenty-one carbonate fringing reefs within a 3600 km2 area around the inner Seychelles islands (4 309S, 55 309E) were surveyed in October 2010. Fishing practices in the inner Seychelles use non-destructive techniques (handlines, traps and octopus harpooning are the most widely used; [41]), and there is relatively low variability in fishing pressure along the shallow fringing reefs among the islands, with most fishing occurring in deeper water [42,43]. At each reef, four 50 m transects were laid at approximately 4 m depth, perpendicular to the reef slope. The following data were collected along each transect; 1) live benthic cover recorded at 0.5 m intervals, 2) underlying substratum quantified at 0.5 m intervals, 3) number and identity of all fish greater than 8 cm were recorded along a 5 m wide belt (to minimise disturbance, large, mobile species were counted as the transect was laid; [44]), and 4) structural complexity was recorded using both a 6-point scale and by estimating the number of small refuge holes,,10 cm diameter, along two 1061 m sub-transects (following [45]). Scleractinian corals and macroalgae were identified to genus and/or morphological group, while other
algae were identified to functional group. Other benthic organisms recorded included corallimorphs, sponges and zoanthids. For analyses, branching acroporids, massive Porites, and favids were differentiated from the rest of the coral genera (grouped as ‘other hard corals’) due to their high coverage. The underlying sub-stratum, defined as the substratum below recorded benthic cover or the top 10 mm of sand/sediment, was categorised into loose dead coral rubble, consolidated rubble (rubble pieces that were showing visual and tactile signs of amalgamation), solid carbonate pavement, or bommie (isolated coral outcrops). Fish species were assigned to 8 functional groups based on the literature and FishBase: obligate corallivores, browsing herbivores, other herbi-vores (including scrapers, grazers, excavators, detritiherbi-vores), plank-tivores, piscivores, non-coral invertivores (hereafter invertivores), omnivores (consume animal and plant material) and generalist carnivores (fish and invertebrate feeders). Additionally, the level of exploitation sustained by different fish species was assigned at four levels: primary targets, important by-catch, occasional by-catch and non-fished species [46].
Analyses
The data were organized into four matrices; i) benthic habitat (11 variables; including the two complexity measures) that was natural log transformed to improve the spread of the data, and normalised to standardize the contribution of variables measured as percent cover and those measured on different scales, ii) underlying substrata cover (4 variables), iii) fish functional group abundances (8 variables) that were square-root transformed to downweigh abundant groups [47], and iv) fish species abundances (152 species) that were also square-root transformed to downplay the influence of highly abundant species. The complexity measures were included with the benthic cover variables because these measures are thought, at least in part, to reflect the complexity provided by live benthic organisms (e.g. [6,48,49]). Within- and among-reef variation was assessed using ordination methods on dissimilarity matrices in the statistical software PRIMER; corre-lation-based principal components analysis (PCA) on Euclidean distances for the underlying substratum and benthic cover matrices (as the data is continuous and needed to be normalised; [47]), and non-metric multidimensional scaling (nMDS) on Bray-Curtis dissimilarities to account for high zero counts [47], for the fish matrices. Pairwise relationships between all variables within a matrix showed no collinearity (r,0.7; [50]). Groupings in the benthic cover PCA were assessed by overlaying slices from a hierarchical cluster analysis using group averaging of the same Euclidian distance matrix.
Relationship between Data Matrices
Comparing Variables along a Gradient of Contrasting Benthic States
A combination of cluster analysis and ordination showed the presence of contrasting benthic assemblages along a gradient from coral to macroalgae. To investigate whether there were any fish species that typified either assemblage, we ran a similarity of percentages (SIMPER) analysis using a subset of the fish species matrix that reflected the two extreme clusters of transects identified by the slice through the benthic cluster diagram. This represented transects dominated by macroalgae versus transects with high coral cover and structural complexity. An index of the fish functional group diversity was calculated using the Shannon-Weiner diversity index, H’, which takes into account both abundance and the number of functional groups (maximum n = 8). The relationships between the benthic gradient (the benthic PCA’s first principal component) and fish functional group diversity (H’), fish species richness, total fish abundance, and individual functional group abundances were examined using General Additive Models (GAM). GAMs incorporate the possi-bility of non-linear relationships between the response and predictive variables [50]. Reef was included as a random effect variable using restricted maximum likelihood estimation (REML) using the gam and gamm functions of the mgcv package in R.
Results
Benthic Reef Assemblages
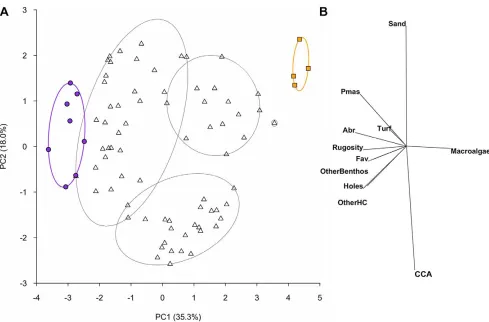
Benthic cover of reef organisms was highly variable among the 21 reefs in the inner Seychelles. Live coral cover ranged from 0 to 47% (65.1 SE) and macroalgae cover from 0 to 76% (66.7 SE) per reef (Figure S1). The first principal components axis (PC1) of the benthic PCA differentiated transects along a gradient from high coral cover (up to 58% per transect) and structural complexity (rugosity score up to 4, and up to 1150 10 cm holes) at negative PC1 scores, to high macroalgae cover (up to 95%) and low structural complexity (rugosity score down to 0.5, and as few as 30 10 cm holes) at positive PC1 scores (Figure 1). A separation from sand and sediment-laden turf to crustose coralline algae was represented by PC2. A slice through a cluster analysis at a Euclidean distance of 4 represented six groupings in the data, including two groups at extreme ends of PC1, and four intermediate groups (Figure 1).
Underlying Substrata
[image:3.612.60.549.56.378.2]The underlying substrata of the reefs varied from loose rubble to consolidated carbonate pavement. When highlighted on the underlying substrate PCA plot, transect groupings from the Figure 1. Principal components analysis of benthic habitat variables.(A) Spatial variation in benthic habitat on reefs at the transect level, shown for the first two components from a principal components analysis on natural log(x+1) transformed and normalised data. Ellipses show groupings calculated from a slice taken through a hierarchical cluster analysis at a Euclidean distance value of 4. Data symbols represent transects within reefs; filled circles and squares highlight transects within the extreme clusters for visualisation purposes. Purple circles and ellipse shows high complexity coral cluster consisting of 8 transects from 2 reefs; orange squares and ellipse shows low-complexity, high macroalgae cluster consisting of 4 transects from 1 reef; triangles are transects that fall within intermediate clusters. (B) The relative contribution of the 11 benthic habitat categories to the observed variation in reef benthic condition. Pmas – massivePorites; Abr – branchingAcropora; Fav – favids; OtherBenthos – non-coral or algae benthic organisms; OtherHC – all other scleractinian non-corals; CCA – crustose non-coralline algae.
benthic cluster analysis were not apparent, however reefs found at both extreme ends of the benthic PC1 were associated with more stable substrata. It is to be noted that the stress level of the MDS was fairly high, so although general patterns are robust, details need to be interpreted with some caution [47]. A BEST analysis (rs= 0.16, p,0.05) corroborated this pattern, finding a weak but significant correlation between the benthic and underlying sub-strata distance matrices, specifying the presence of pavement rather than rubble as the principal cause of similarity.
Fish Assemblages
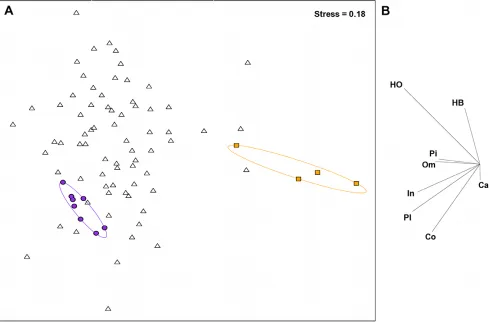
A total of 152 fish species were recorded from the study site, with 3 to 38 species observed per transect. All of the eight fish functional groups were more strongly associated with transects plotted on the left hand side of the MDS plot (Figure 2). Highlighting the transect clusters found by the benthic analysis, on the fish functional group MDS plot indicated that the more fish-depauperate reefs corresponded to reefs with the highest levels of macroalgae (BEST rs= 0.48, p,0.001). Fourteen fish species, including planktivores, invertivores, an obligate corallivore and non-browsing herbivores (a bioeroder, a scraper and two detritivores) contributed to 70% of the similarity within the cluster of transects at the high coral cover, high complexity end (herein
referred to as complex coral habitats) of the benthic PC1 (Table 1). These 14 species included a primary fishery target species, Chlorurus sordidus, and 3 important- and 3 occasional fishery by-catch species (Table 1). In comparison, only 3 species –Thalassoma herbraicum(an invertivore),Cheilio inermisand Lethrinus harak (both generalist carnivores, and the latter is an important fishery by-catch species), contributed to 70% of the similarity within the cluster of transects at the high macroalgae cover, low-complexity end (herein referred to as low-complexity macroalgae habitats) of the benthic PC1 (Table 1). One species,T. herbraicumwas common to both groups. Sixteen species explained 49.3% of the dissimi-larity between the complex coral and low-complexity macroalgae habitats and represent 5 of the 8 defined functional groups (Table 1).
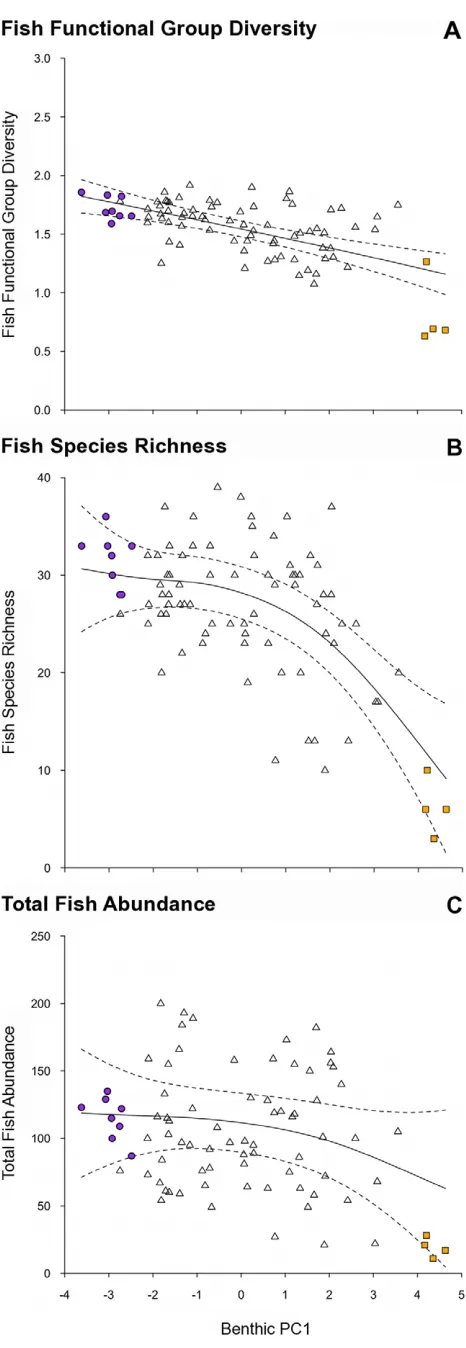
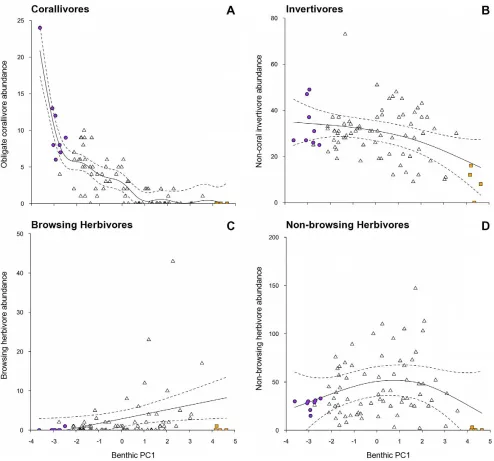
[image:4.612.62.551.63.385.2]The transition along the benthic gradient from complex coral to low-complexity macroalgae associated with PC1 (Figure 1), corresponded with a decline in fish functional group diversity (r2= 0.375, p,0.001; Figure 3a), overall fish species richness (r2= 0.434, p,0.001; Figure 3b) but not total fish abundance (r2= 0.081, p.0.05, Figure 3c) (Table 2). For the abundance of fish within functional groups, PC1 of the benthic PCA corre-sponded with a strong decline in obligate corallivore abundance (r2= 0.754, p,0.001, Figure 4a), a weak decline in invertivore abundance (r2= 0.139, p,0.05, Figure 4b), and a very weak Figure 2. Non-metric multidimensional scaling analysis of fish functional groups.(A) Spatial variation in the reef fish functional group abundances on reefs at the transect level, assessed using a non-metric multidimensional scaling plot on square-root transformed data. Data symbols represent transects within reefs. For visualisation purposes, filled circles and squares, and ellipses highlight the transects within the extreme clusters calculated from a slice taken through the Benthic data’s hierarchical cluster analysis at a Euclidean distance value of 4. Purple circles and ellipse shows high complexity coral cluster, orange squares and ellipse shows low-complexity, high macroalgae cluster. (B) The relative contribution of the 8 fish functional groups to the observed variation on reefs. HB – browsing herbivores; HO – non-browsing herbivores; Pi – piscivores; Om – omnivores; In – non-coral invertivores; Pl – planktivores; Co – obligate corallivores; Ca – generalist carnivores.
increase in browsing herbivore abundance (r2= 0.066, p,0.05, Figure 4c)(Table 2). No relationships were found between the benthic habitat gradient and the abundances of the other five fish functional groups (Table 2; non-browsing herbivorous species also Figure 4d).
Discussion
This study found markedly different fish composition along a multivariate gradient of reef benthic conditions ranging from complex coral habitats to low-complexity macroalgae habitats. Very different fish assemblages were linked with the two habitat extremes, not only in terms of species present, but also richness and diversity at both species and functional group level. The strongest relationships with the habitat gradient were found at the
overall fish assemblage scale, rather than at the individual functional group scales. Obligate corallivorous fishes were the exception, and are known for their dependence upon live corals [52]. The dependence of reef fish assemblages on the coral reef benthos has been demonstrated through numerous before-after studies of fish and benthic changes through disturbance events (reviewed by: [9,23]). In contrast, this study assesses the role of a broad array of benthic conditions following disturbance, on reef fish assemblages, providing useful insights into potential future compositions of reef fishes.
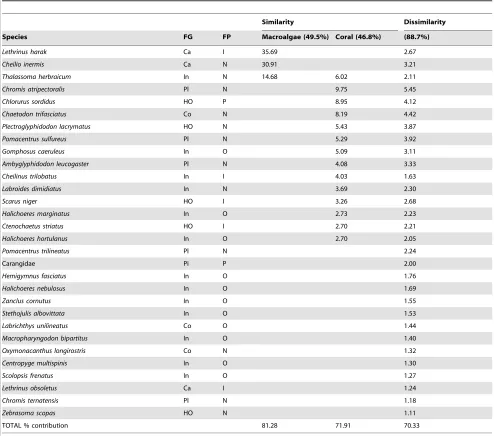
[image:5.612.62.556.88.524.2]At the extreme ends of the benthic gradient, complex coral habitats support a higher number of fish species and functional groups than low-complexity habitats dominated by macroalgae. A major consequence for many ecosystems facing degradation is ecological homogenisation, whereby multiple specialist species or Table 1.Fish taxa contributing to the similarity within, and dissimilarity between, the extreme groups of low-complexity macroalgae and complex coral.
Similarity Dissimilarity
Species FG FP Macroalgae (49.5%) Coral (46.8%) (88.7%)
Lethrinus harak Ca I 35.69 2.67
Cheilio inermis Ca N 30.91 3.21
Thalassoma herbraicum In N 14.68 6.02 2.11
Chromis atripectoralis Pl N 9.75 5.45
Chlorurus sordidus HO P 8.95 4.12
Chaetodon trifasciatus Co N 8.19 4.42
Plectroglyphidodon lacrymatus HO N 5.43 3.87
Pomacentrus sulfureus Pl N 5.29 3.92
Gomphosus caeruleus In O 5.09 3.11
Ambyglyphidodon leucogaster Pl N 4.08 3.33
Cheilinus trilobatus In I 4.03 1.63
Labroides dimidiatus In N 3.69 2.30
Scarus niger HO I 3.26 2.68
Halichoeres marginatus In O 2.73 2.23
Ctenochaetus striatus HO I 2.70 2.21
Halichoeres hortulanus In O 2.70 2.05
Pomacentrus trilineatus Pl N 2.24
Carangidae Pi P 2.00
Hemigymnus fasciatus In O 1.76
Halichoeres nebulosus In O 1.69
Zanclus cornutus In O 1.55
Stethojulis albovittata In O 1.53
Labrichthys unilineatus Co O 1.44
Macropharyngodon bipartitus In O 1.40
Oxymonacanthus longirostris Co N 1.32
Centropyge multispinis In O 1.30
Scolopsis frenatus In O 1.27
Lethrinus obsoletus Ca I 1.24
Chromis ternatensis Pl N 1.18
Zebrasoma scopas HO N 1.11
TOTAL % contribution 81.28 71.91 70.33
SIMPER analysis performed on square-root transformed abundance data. Cutoff for low contributions: 70%. Average similarity or dissimilarity reported in parentheses. Functional group (FG) acronyms defined in Figure 2 legend. Fishing pressure (FP) exerted on the species. P – primary target; I – important catch; O – occasional by-catch; N – not targeted.
groups are replaced by fewer, more generalist species or groups leading to much simpler ecosystems [53,54]. Our results appear to support this theory with the low-complexity macroalgae habitats lacking many of the more specialised coral reef fish functional groups (e.g. obligate corallivores and coral-associated planktivores; [45,55]) and also the essential groups for the provision of key ecological processes (e.g. herbivores; [56–58]). While macroalgae provide 3-dimensional structure, in comparison to the often intricate and unyielding skeletal structures of scleractinian corals, it is a more homogeneous and flexible habitat that appears to be less favourable to reef fishes [59].
[image:6.612.59.292.53.727.2]Macroalgal-dominated reefs have long been regarded as degraded reef states [11]. This study provides some empirical evidence that macroalgal-dominated reefs are unfavourable for the wider ecosystem’s ecological communities and economic potential. Nevertheless, habitats with abundant macroalgae can be naturally occurring and provide important refuges for juvenile reef-associated fishes [60]. Juvenile Cheilio inermis for example, are present only inSargassumstands in Western Australia [60]. Also, Sargassum and Turbinaria algal stands have been present on Seychelles coral reefs for some time [61,62], although the influence of human settlement on macroalgal presence is not known. Importantly, macroalgal cover has shown substantial expansion following the 1998 bleaching event [28] and is continuing to increase in cover [63]. Given the high cover of macroalgae Figure 3. Relationships between the gradient in benthic habitat condition and fish assemblage metrics.Benthic habitat condition (PC1 axis): negative values – complex coral habitats; high values – low-complexity macroalgae habitats. Fish assemblage metrics: (a) fish functional group diversity (an index calculated using the Shannon-Weiner diversity index (H’) at the functional group level), (b) fish species richness, (c) total fish abundance. Plotted are fitted parameter estimates695% confidence intervals based on GAM with Reef as a random variable. Note that (c) represents a statistically non-significant relationship. Two extreme outliers were excluded from (C) to aid visual representation, but were included in the analysis. Symbols as in previous figures. Note different scales along y-axis.
[image:6.612.318.555.515.687.2]doi:10.1371/journal.pone.0042167.g003
Table 2.Results of generalized additive mixed models (GAMM) used to model response variables with respect to the gradient in benthic habitat (Benthic PC1), with Reef as a random variable.
Response variable df F p r2
Fish functional group diversity 1.15 26.024 ** 0.375
Fish species richness 2.687 27.135 ** 0.434
Total fish abundance 1.642 3.133 NS 0.081
Obligate corallivores 7.546 26.938 ** 0.749
Browsing herbivores 1 2.789 * 0.066
Non-browsing herbivores 2.226 1.756 NS 0.094
Non-coral invertivores 1.775 4.963 * 0.139
Generalist carnivores 1 0.002 NS 20.012
Omnivores 2.336 3.593 NS 0.104
Piscivores 1 3.523 NS 0.05
Planktivores 1 2.127 NS 0.08
df: estimated degrees of freedom for smooth term (Benthic PC1; 1 = linear). p: **p,0.001, *p,0.05, NSp.0.05.
r2
: proportion of variation explained by the benthic habitat gradient (negative value = model is a worse representation than the Null model).
documented in our study, and the habitats surveyed, it is likely that some of the sites represented recently degraded reef states. Our study suggests that expansion of macroalgae on reefs will have substantial negative repercussions for associated fish diversity.
Herbivores are considered the most important functional group of fish on coral reefs through their role in mediating the competition for space between corals and algae [57,64,65]. Indeed, negative relationships exist between herbivore biomass and macroalgae cover [66–69], although a distinction has been found between herbivorous species that maintain low algal biomass, and browsing species that will consume mature macroalgae thalli [58,70]. Surprisingly therefore, there was no
[image:7.612.59.553.58.519.2]substantial increase in either of the two herbivorous functional groups along the benthic gradient found in this study. Similarly, a study of benthic changes across 7 countries in the Indian Ocean spanning the 1998 coral bleaching event found no increase in herbivore abundance in response to the increase in benthic space available for algal growth [6], while browsing species in Australia show no correlation with increasing macroalgal cover on the GBR [69] or Ningaloo reef [71]. Although browsing herbivores have been able to reverse phase shifts in small-scale experimental settings surrounded by intact reef [58], reefs with high fleshy macroalgal cover tend to have low functional redundancy amongst browsing herbivores [70], and dense macroalgal stands can inhibit Figure 4. Relationships between the gradient in benthic habitat condition and abundances of fish functional groups.Benthic habitat condition (PC1 axis): low values – complex coral habitats; high values – low-complexity macroalgae habitats. Abundances of fish functional groups: (a) obligate corallivores, (b) non-coral invertivores, (c) browsing herbivores, and (d) non-browsing herbivores. Plotted are fitted parameter estimates
695% confidence intervals based on GAM with Reef as a random variable. Note that (d) represents a statistically non-significant relationship. An extreme outlier was excluded to aid visual representation from (B), (C), and (D), but was included in the analyses. Symbols as in previous figures. Note different scales along y-axis.
herbivory [59]. Indeed, the ability of browsing herbivores to perform their vital function on macroalgae-dominated reef systems is very poorly understood.
The identified differences in the fish community with changing benthic condition are likely to have implications for ecosystem service provision [10,72–74]. Major ecosystem services associated with reef fishes include the provision of fisheries and tourism [13,75,76]. Therefore, as fish species richness and functional group diversity decreases across the benthic condition gradient, the multi-species fishery and substantial dive tourism industry of the Seychelles are likely to be negatively affected by shifts away from complex coral-dominated reefs [41,73,77]. Specifically, there was a 5-fold difference in fish abundances at the benthic extremes of our study: macroalgal-dominated reefs had an average of 19.3 (63.6 SE) fish per 250 m2compared to 105.3 (65.4 SE) fish per 250 m2 at the reef with the highest overall coral cover and complexity. Moreover, two of the five primary fishing target species, and 19 important by-catch species [46] were present on reefs with highest overall coral cover and complexity compared to no primary target species, and only one important by-catch species on low complexity and macroalgae-dominated reefs. This 5-fold difference in total fish abundance and the reduction in target species, is likely to reflect a decline in fishery potential. This contrasts with results from the Caribbean where macroalgae-dominated reefs appeared to sustain high fish species richness [78]. Similarly, studies of tourist preferences show that fish abundance and diversity play a major role in attracting and satisfying dive tourists (e.g. [79–81]).
Although we predicted that the stability of the underlying substratum would interact with the condition of the benthos, with stable substrata having higher coral cover than mobile rubble reefs, we found only weak relationships. Studies in rubble-dominant locations, such as former dynamite fishing areas, have found substantially lower coral cover on rubble versus stable rocky sites [35]. Furthermore, other macro-benthic organisms such as reef sponges have been found to have decreased growth rates on mobile rubble substrata compared to stable rock substrata [37]. Our results showed that many of the rubble dominated transects did have low coral cover (where rubble was.80%, mean coral cover was 4.9% (61.9 SE)). However, many other transects that had little rubble also had low coral cover (22/46 transects with
,5% rubble had,10% coral cover), indicating that substratum stability was not the only variable influencing coral cover. Interestingly however, both the coral-dominated and macroalgal-dominated extremes were associated with more stable substrata, suggesting that substratum stability is important in enabling these macrobenthic organisms to survive to maturity.
The multivariate gradient of benthic conditions found in this study indicates a continuum of reef states. However, in the absence of long-term time series data and/or experimental manipulations it is not possible to establish the stability of our extreme benthic state categories [82]. Similarly, the reefs in the middle of the continuum may be fairly stable in their own right, or in transition (i.e. degrading or recovering) between different characteristic equilibrium states because of various natural disturbances or perturbations [8,32,33,83]. Regardless, it is clear that more degraded reefs, in terms of coral cover, diversity and structural complexity, host more depauperate reef fish assemblages.
As coral reefs continue to degrade due to a range of anthropogenic drivers, and alterations in community compositions occur, it is imperative that we understand how changes in one aspect of an ecosystem affect the rest of the ecosystem. From a management perspective, the fact that many reefs do not exist in discrete states means that few generalisations are possible, and reef specific data may be required to implement necessary manage-ment plans [32,84]. While many previous studies have linked loss of fish diversity with loss of coral cover, the lack of reciprocal increases in herbivorous fishes to counter increases in algal cover is alarming, with negative implications for the continuation of many coral reef ecosystem processes and services if more reefs shift to macroalgal-dominated states. Clearly, prevention of further reef degradation through a reduction in anthropogenic pressures, is of critical importance because the repercussions of declining habitat condition may be far reaching.
Supporting Information
Figure S1 Proportional cover of benthic biota per site.
(TIF)
Acknowledgments
We thank J Robinson for logistical support, Seychelles Fishing Authority, Seychelles National Parks Authority, North Island and Global Vision International (Seychelles) for field assistance. Thanks to K Beaver, C Johansson, I van de Leemput, the Graham Lab and three anonymous reviewers for helpful comments.
Author Contributions
Conceived and designed the experiments: KMC NAJG MSP DRB. Analyzed the data: KMC. Wrote the paper: KMC TDM MSP DRB NAJG. Collected the data: KMC TDM.
References
1. O’Neill R (1999) Recovery in complex ecosystems. J Aquat Ecosyst Stress Recovery 6: 181–187.
2. Nystro¨m M, Folke C (2001) Spatial Resilience of Coral Reefs. Ecosystems 4: 406–417.
3. Hughes TP, Baird AH, Bellwood DR, Card M, Connolly SR, et al. (2003) Climate Change, Human Impacts, and the Resilience of Coral Reefs. Science 301: 929–933.
4. Parmesan C (2006) Ecological and Evolutionary Responses to Recent Climate Change. Annual Review of Ecology, Evolution, and Systematics 37: 637–669. 5. Bruno JF, Selig ER (2007) Regional Decline of Coral Cover in the Indo-Pacific:
Timing, Extent, and Subregional Comparisons. PLoS ONE 2: e711. 6. Graham NAJ, McClanahan TR, MacNeil MA, Wilson SK, Polunin NVC, et al.
(2008) Climate warming, marine protected areas and the ocean scale integrity of coral reef ecosystems. PLoS ONE 3: e3039.
7. Marshall PA, Baird AH (2000) Bleaching of corals on the Great Barrier Reef: differential susceptibilities among taxa. Coral Reefs 19: 155–163.
8. Halford A, Cheal AJ, Ryan D, Williams DM (2004) Resilience to Large-Scale Disturbance in Coral and Fish Assemblages on the Great Barrier Reef. Ecology 85: 1892–1905.
9. Pratchett MS, Munday PL, Wilson SK, Graham NAJ, Cinner JE, et al. (2008) Effects of climate-induced coral bleaching on coral-reef fishes: ecological and economic consequences. Oceanogr Mar Biol Annu Rev 46: 251–296. 10. Done TJ (1992) Phase shifts in coral reef communities and their ecological
significance. Hydrobiologia 247: 121–132.
11. Hughes TP (1994) Catastrophes, Phase Shifts, and Large-Scale Degradation of a Caribbean Coral Reef. Science 265: 1547–1551.
12. Norstro¨m AV, Nystro¨m M, Lokrantz J, Folke C (2009) Alternative states on coral reefs: beyond coral-macroalgal phase shifts. Mar Ecol Prog Ser 376: 295– 306.
13. Costanza R, d’Arge R, de Groot R, Farber S, Grasso M, et al. (1997) The value of the world’s ecosystem services and natural capital. Nature 387: 253–260. 14. Littler MM, Littler DS (2007) Assessment of coral reefs using herbivory/nutrient
assays and indicator groups of benthic primary producers: a critical synthesis, proposed protocols, and critique of management strategies. Aquat Conserv: Mar Freshwat Ecosyst 17: 195–215.
16. Gardner TA, Coˆte´ IM, Gill JA, Grant A, Watkinson AR (2003) Long-Term Region-Wide Declines in Caribbean Corals. Science 301: 958–960. 17. Ateweberhan M, McClanahan TR, Graham NAJ, Sheppard CRC (2011)
Episodic heterogeneous decline and recovery of coral cover in the Indian Ocean. Coral Reefs 30: 739–752.
18. Wootton JT (2002) Indirect effects in complex ecosystems: recent progress and future challenges. J Sea Res 48: 157–172.
19. Doak DF, Estes JA, Halpern BS, Jacob U, Lindberg DR, et al. (2008) Understanding and predicting ecological dynamics: are major surprises inevitable. Ecology 89: 952–961.
20. Connell SD, Russell BD, Irving AD (2011) Can strong consumer and producer effects be reconciled to better forecast ‘catastrophic’ phase-shifts in marine ecosystems? J Exp Mar Biol Ecol 400: 296–301.
21. McCormick MI (1994) Comparison of field methods for measuring surface topography and their associations with a tropical reef fish assemblage. Mar Ecol Prog Ser 112: 87–96.
22. Garpe KC, Ohman MC (2003) Coral and fish distribution patterns in Mafia Island National Park, Tanzania: fish-habitat interactions. Hydrobiologia 498: 191–211.
23. Wilson SK, Graham NAJ, Pratchett MS, Jones GP, Polunin NVC (2006) Multiple disturbances and the global degradation of coral reefs: are reef fishes at risk or resilient? Global Change Biol 12: 2220–2234.
24. Lecchini D, Carassou L, Fre´de´rich B, Nakamura Y, Mills SC, et al. (2012) Effects of alternate reef states on coral reef fish habitat associations. Environ Biol Fishes 94: 421–429.
25. Bellwood DR, Hoey AS, Ackerman JL, Depczynski M (2006) Coral bleaching, reef fish community phase shifts and the resilience of coral reefs. Global Change Biol 12: 1587–1594.
26. Bellwood DR, Baird AH, Depczynski M, Gonza´lez-Cabello A, Hoey AS, et al. (2012) Coral recovery may not herald the return of fishes on damaged coral reefs. Oecologia. doi: 10.1007/s00442–00012–02306-z.
27. Jones GP, McCormick MI, Srinivasan M, Eagle JV (2004) Coral decline threatens fish biodiversity in marine reserves. Proc Natl Acad Sci USA 101: 8251–8253.
28. Graham NAJ, Wilson SK, Jennings S, Polunin NVC, Bijoux JP, et al. (2006) Dynamic fragility of oceanic coral reef ecosystems. Proc Natl Acad Sci USA 103: 8425–8429.
29. Syms C, Jones GP (2001) Soft corals exert no direct effects on coral reef fish assemblages. Oecologia 127: 560–571.
30. Nogueira C, Colli GR, Martins M (2009) Local richness and distribution of the lizard fauna in natural habitat mosaics of the Brazilian Cerrado. Austral Ecol 34: 83–96.
31. Scheffer M, Hosper SH, Meijer ML, Moss B, Jeppesen E (1993) Alternative equilibria in shallow lakes. Trends Ecol Evol 8: 275–279.
32. Walker BH (1993) Rangeland Ecology: Understanding and Managing Change. Ambio 22: 80–87.
33. Hughes TP, Graham NAJ, Jackson JBC, Mumby PJ, Steneck RS (2010) Rising to the challenge of sustaining coral reef resilience. Trends Ecol Evol 25: 633– 642.
34. Graham NAJ, Nash KL, Kool J (2011) Coral reef recovery dynamics in a changing world. Coral Reefs 30: 283–294.
35. Fox HE (2004) Coral recruitment in blasted and unblasted sites in Indonesia: assessing rehabilitation potential. Mar Ecol Prog Ser 269: 131–139. 36. Victor S (2008) Stability of reef framework and post settlement mortality as the
structuring factor for recovery of Malakal Bay Reef, Palau, Micronesia: 25 years after a severe COTS outbreak. Estuar Coast Shelf Sci 77: 175–180. 37. Duckworth AR, Wolff CW (2011) Population dynamics and growth of two coral
reef sponges on rock and rubble substrates. J Exp Mar Biol Ecol 402: 49–55. 38. Goreau TJ (1998) Coral recovery from bleaching in Seychelles. Global Coral
Reef Alliance. Available: http://globalcoral.org/coral_recovery_from_ bleaching_in.htm. Accessed 2012 Jul 12.
39. Ahamada S, Bijoux JP, Cauvin B, Hagan A, Harris A, et al. (2008) Status of the coral reefs of the South-West Indian Ocean Island States: Comoros, Madagascar, Mauritius, Reunion, Seychelles. In: Wilkinson C, editor. Status of Coral Reefs of the World: 2008. Townsville, Australia: Australian Institute of Marine Science. 105–118.
40. Ledlie M, Graham NAJ, Bythell J, Wilson SK, Jennings S, et al. (2007) Phase shifts and the role of herbivory in the resilience of coral reefs. Coral Reefs 26: 641–653.
41. Grandcourt EM, Cesar HSJ (2003) The bio-economic impact of mass coral mortality on the coastal reef fisheries of the Seychelles. Fisheries Research 60: 539–550.
42. Daw TM, Maina J, Cinner JE, Robinson J, Wamukota A (2011) The spatial behaviour of artisanal fishers: Implications for fisheries management and development (Fishers in Space). Zanzibar, Tasmania: Western Indian Ocean Marine Science Association. 79 p.
43. Daw TM, Robinson JAN, Graham NAJ (2011) Perceptions of trends in Seychelles artisanal trap fisheries: comparing catch monitoring, underwater visual census and fishers’ knowledge. Environ Conserv 38: 75–88.
44. Halford AR, Thompson AA (1994) Visual census surveys of reef fish. Townsville, Queensland : Australian Institute of Marine Science. 24 p.
45. Wilson SK, Graham NAJ, Polunin NVC (2007) Appraisal of visual assessments of habitat complexity and benthic composition on coral reefs. Mar Biol 151: 1069–1076.
46. Grandcourt EM (1999) The population biology of a selection of exploited reef fish from the Seychelles and Great Barrier Reef. Townsville, Queensland: James Cook University. 106 p.
47. Clarke KR, Warwick RM (2001) Changes in marine communities: an approach to statistical analysis and interpretation. Plymouth: PRIMER-E Ltd. 176 p. 48. Chabanet P, Ralambondrainy H, Amanieu M, Faure G, Galzin R (1997)
Relationships between coral reef substrata and fish. Coral Reefs 16: 93–102. 49. Wilson SK, Fisher R, Pratchett MS, Graham NAJ, Dulvy NK, et al. (2008)
Exploitation and habitat degradation as agents of change within coral reef fish communities. Global Change Biol 14: 2796–2809.
50. Zuur AF, Ieno EN, Smith GM (2007) Analysing ecological data. Berlin: Springer Verlag. 672 p.
51. Clarke KR, Somerfield PJ, Gorley RN (2008) Testing of null hypotheses in exploratory community analyses: similarity profiles and biota-environment linkage. J Exp Mar Biol Ecol 366: 56–69.
52. Pratchett MS (2005) Dietry overlap among coral-feeding butterflyfishes (Chaetodontidae) at Lizard Island, northern Great Barrier Reef. Mar Biol 148: 373–382.
53. McKinney ML, Lockwood JL (1999) Biotic homogenization: a few winners replacing many losers in the next mass extinction. Trends Ecol Evol 14: 450– 453.
54. Devictor V, Julliard R, Jiguet F (2008) Distribution of specialist and generalist species along spatial gradients of habitat disturbance and fragmentation. Oikos 117: 507–514.
55. Munday PL (2004) Habitat loss, resource specialization, and extinction on coral reefs. Global Change Biol 10: 1642–1647.
56. Arthur R, Done TJ, Marsh H, Harriott V (2006) Local processes strongly influence post-bleaching benthic recovery in the Lakshadweep Islands. Coral Reefs 25: 427–440.
57. Bellwood DR, Hughes TP, Folke C, Nystro¨m M (2004) Confronting the coral reef crisis. Nature 429: 827–833.
58. Bellwood DR, Hughes TP, Hoey AS (2006) Sleeping Functional Group Drives Coral-Reef Recovery. Curr Biol 16: 2434–2439.
59. Hoey AS, Bellwood DR (2011) Suppression of herbivory by macroalgal density: a critical feedback on coral reefs? Ecol Lett 14: 267–273.
60. Wilson SK, Depczynski M, Fisher R, Holmes TH, O’Leary RA, et al. (2010) Habitat associations of juvenile fish at Ningaloo Reef, Western Australia: the importance of coral and algae. PLoS ONE 5: e15185.
61. Taylor JD (1968) Coral Reef and Associated Invertebrate Communities (Mainly Molluscan) Around Mahe, Seychelles. Philosophical Transactions of the Royal Society of London Series B, Biological Sciences 254: 129–206.
62. Stoddart D (1984) Biogeography and ecology of the Seychelles Islands. Berlin: Springer. 708 p.
63. Wilson SK, Graham NAJ, Fisher R, Robinson J, Nash K, et al. (2012) Macroalgal expansion and marine protected areas drive coral recovery following climatic disturbances. Conserv Biol. In press.
64. Hughes TP, Rodrigues MJ, Bellwood DR, Ceccarelli D, Hoegh-Guldberg O, et al. (2007) Phase Shifts, Herbivory, and the Resilience of Coral Reefs to Climate Change. Curr Biol 17: 360–365.
65. Pratchett MS, Hoey AS, Wilson SK, Messmer V, Graham NAJ (2011) Changes in Biodiversity and Functioning of Reef Fish Assemblages following Coral Bleaching and Coral Loss. Diversity 3: 424–452.
66. Fox RJ, Bellwood DR (2007) Quantifying herbivory across a coral reef depth gradient. Mar Ecol Prog Ser 339: 49–59.
67. Friedlander AM, Brown E, Monaco ME (2007) Defining reef fish habitat utilization patterns in Hawaii: comparisons between marine protected areas and areas open to fishing. Mar Ecol Prog Ser 351: 221–233.
68. Mumby PJ, Harborne AR, Williams J, Kappel CV, Brumbaugh DR, et al. (2007) Trophic cascade facilitates coral recruitment in a marine reserve. Proc Natl Acad Sci USA 104: 8362–8367.
69. Wismer S, Hoey AS, Bellwood DR (2009) Cross-shelf benthic community structure on the Great Barrier Reef: relationships between macroalgal cover and herbivore biomass. Mar Ecol Prog Ser 376: 45–54.
70. Hoey AS, Bellwood DR (2009) Limited Functional Redundancy in a High Diversity System: Single Species Dominates Key Ecological Process on Coral Reefs. Ecosystems 12: 1316–1328.
71. Johansson CL, Bellwood DR, Depczynski M (2010) Sea urchins, macroalgae and coral reef decline: a functional evaluation of an intact reef system, Ningaloo, Western Australia. Mar Ecol Prog Ser 414: 65–74.
72. Elmqvist T, Folke C, Nystro¨m M, Peterson G, Bengtsson J, et al. (2003) Response diversity, ecosystem change, and resilience. Front Ecol Environ 1: 488–494.
73. Payet R, Agricole W (2006) Climate change in the Seychelles: Implications for water and coral reefs. Ambio 35: 182–189.
74. Thrush SF, Hewitt JE, Dayton PK, Coco G, Lohrer AM, et al. (2009) Forecasting the limits of resilience: integrating empirical research with theory. Proc R Soc B 276: 3209–3217.
75. Moberg F, Folke C (1999) Ecological goods and services of coral reef ecosystems. Ecol Econ 29: 215–233.
76. Worm B, Barbier EB, Beaumont N, Duffy JE, Folke C, et al. (2006) Impacts of Biodiversity Loss on Ocean Ecosystem Services. Science 314: 787–790. 77. Graham NAJ, Wilson SK, Jennings S, Polunin NVC, Robinson J, et al. (2007)
78. Mumby PJ, Broad K, Brumbaugh DR, Dahlgren CP, Harborne AR, et al. (2008) Coral reef habitats as surrogates of species, ecological functions, and ecosystem services. Conserv Biol 22: 941–951.
79. Shafer CS, Inglis G (2000) Influence of Social, Biophysical, and Managerial Conditions on Tourism Experiences Within the Great Barrier Reef World Heritage Area. Environ Manage 26: 73–87.
80. Williams ID, Polunin NVC (2000) Differences between protected and unprotected reefs of the western Caribbean in attributes preferred by dive tourists. Environ Conserv 27: 382–391.
81. Uyarra MC, Coˆte´ IM, Gill JA, Tinch RRT, Viner D, et al. (2005) Island-specific preferences of tourists for environmental features: implications of climate change for tourism-dependent states. Environ Conserv 32: 11–19.
82. Petraitis P, Methratta E, Rhile E, Vidargas N, Dudgeon S (2009) Experimental confirmation of multiple community states in a marine ecosystem. Oecologia 161: 139–148.
83. Brown BE (1997) Disturbances to reefs in recent times. In: Birkeland C, editor. Life and death of coral reefs. New York: Chapman and Hall. 354–379. 84. Westoby M, Walker BH, Noy-Meir I (1989) Opportunistic Management for