University of Southern Queensland
Faculty of Health, Engineering & Sciences
Small Compressed Air Energy Storage Systems
A dissertation submitted by
Kayne Herriman
in fulfillment of the requirements of ENG4112 Research Project towards the
degree of a Bachelor of Engineering (Electrical and Electronic)
Abstract
Abstract
The storage of energy is emerging as a greener way to support our existing electricity networks
and improve the stability of our grids, as we step forward into a cleaner future and becomes more
dependent on intermittent renewable generation sources.
Australia is seen to be blessed with an abundant of renewable energy resources and it has been
said that Australia is the Middle East of renewables. These “free” resources substantially exceed Australia’s total energy demand, both currently and into the foreseeable future.
Most energy storage systems require the useful energy to be converted from its initial state into
another form, which is more suitable for storage. When ready to use, it’s then converted back
into a useful form. With each conversion there are losses associated which affect efficiency, for
this reason efficiencies of are not achievable.
Compressed Air Energy Storage (CAES) is not an unproven technology and on a large scale
there are two existing CAES plant in the world. The first plant ever built was in Huntorf
Germany, which was commissioned in and capable of producing for two hours. The second was in McIntosh Alabama USA, which was commissioned in and capable of producing for hours (Energy C. , 2012). Small CAES technology would dramatically lighten the loads on networks, help people who cannot connect to a power grid and
Abstract
A main goal of dissertation was to produce some correlation between the theoretical analysis and
the data from dyno testing. The isothermal and adiabatic equations used are ‘ideal’ equations
which are never actually achieved by physical machines. It was found that the dyno results were
substantially lower than the ideal equations which were used to calculate the stored energy and
specific power. This is because the theory does not take into account losses like compressor
mechanical and storage tank thermal losses, compressor and air motor thermodynamic
efficiency, air motor mechanical efficiency and friction and flow losses.
It is said that the most common solution for small to medium storage is batteries, although very
good at storing energy they are very hard to recycle and are very dangerous if not used correctly.
Yet the benefits of compressed air over electric storage are the longer lifetime of pressure vessels
and materials are entirely benign as well as life time costs are potentially lower.
Like solar energy, air is a clean and an abundant resource with specific gas characteristics, which
allows it to be compressed and expanded without any effect apart from the exchange of heat with
the immediate environment. This heat energy could be captured and used for heating our homes,
for hot water, cooking or even generating electricity. Thus, CAES is a simple and effective way
of storing energy for later use.
With a renewable energy target of or Giga Watt hours (GWhr) by , there is no better time like the present to harness the energy to provide a cleaner future for our children’s
Limitations of Use
University of Southern Queensland
Faculty of Health, Engineering & Sciences
ENG 4111 Research Project Part 1
&
ENG 4112 Research Project Part 2
Limitations of Use
The Council of the University of Southern Queensland, its Faculty of Health, Engineering &
Sciences, and the state of the University of Southern Queensland, do not accept any
responsibility for the truth, accuracy or completeness of material contained within or associated
with this dissertation.
Persons using all or any part of this material do so at their own risk, and not at the risk of the
Council of the University of Southern Queensland, its Faculty of Health, Engineering & Sciences
or the state of the University of Southern Queensland. This dissertation reports an educational
exercise and has no purpose or validity beyond this exercise.
The sole purpose of the course pair entitled “Research Project" is to contribute to the overall
education within the student's chosen degree program. This document, the associated hardware,
software, drawings, and other material set out in the associated appendices should not be used for
any other purpose: if they are so used, it is entirely at the risk of the user.
Dean
Certification of Dissertation
Certification of Dissertation
I certify that the ideas, designs and experimental work, results, analyses and conclusions set out
in this dissertation are entirely my own effort, except where otherwise indicated and
acknowledged.
I further certify that the work is original and has not been previously submitted for assessment in
any other course or institution, except where specifically stated.
K.Herriman
0050051064
_____________________________
Signature
_____________________________
Acknowledgements
Acknowledgements
During the past eight year studying with the Lectures and Staff of University of Southern
Queensland I could not have asked for a more respectable group of professionals to guide me
though my engineering degree. The knowledge and experience they have given me, not only is
invaluable but also transferable in any aspirations that I have.
I would like to thank my supervisors for this dissertation, Dr Leslie Bowtell and Dr Ray
Malpress. Their willingness to share their vast technical knowledge and provide guidance where
necessary, allowed me to further my knowledge and successful complete this dissertation. I
appreciated all the time and effort you have given me throughout this year.
Finally, I am dedicating this work to the most important people in my life; my family, in
particular my wife Sarah and daughter Sophie. Sarah at (many) times, has come second to my
studies, she has witnessed all my highs and lows throughout these past eight years but at every
stage, she has believed in me when I may have doubted my own work. I must say thank you to
her for having patience with me during this time and also bringing our daughter Sophie into this
Table of Contents
Table of Contents
CHAPTER 1... 15
1. INTRODUCTION ... 15
Background ... 15 1.1.
What is Power and Energy ... 17 1.2.
What is Compressed Air ... 18 1.3.
Compressed Air Energy Storage (CAES) ... 19 1.4.
Project Aim ... 20 1.5.
Project Objectives ... 20 1.6.
Overview of the Dissertation ... 21 1.7.
CHAPTER 2... 22
2. COMPRESSED AIR ENERGY STORAGE ... 22
Introduction ... 22 2.1.
Energy Storage Technologies ... 22 2.2.
Conventional Compressed Air Energy Storage (CAES) ... 24 2.3.
Where is it Being Used ... 24 2.4.
Table of Contents
3. THERMODYNAMICS ... 31
Introduction ... 31 3.1.
Adiabatic Compression of Air ... 31 3.2.
Isothermal Compression of Air ... 31 3.3.
Ideal Gas Law ... 32 3.4.
CHAPTER 4... 35
4. METHODOLOGY ... 35
Introduction ... 35 4.1.
Analysis of Installed Energy Storage Technologies ... 36 4.2.
Small Scale Compressed Air Storage ... 38 4.3.
Efficiency of Conversion ... 39 4.4.
Selected Equipment for Design ... 39 4.5.
Photovoltaic Cells ... 39 4.5.1.
Air Compressor Package ... 40 4.5.2.
Air Motor ... 41 4.5.3.
AC Generator ... 44 4.5.4.
Model Development Flow Diagram ... 44 4.6.
Bench Testing System ... 44 4.7.
CHAPTER 5... 46
5. RESULTS FROM ANALYSIS OF PROPOSED DESIGN ... 46
Introduction ... 46 5.1.
Theoretical Analysis ... 46 5.2.
Practical Review ... 49 5.3.
Total Energy Compressor Used to Fill Receiver ... 49 5.4.
Table of Contents
Maximum Efficiency Profile ... 51
5.6. Comparison Between Storage Devices ... 57
5.7. Estimation on Size of Receiver for SCAES ... 59
5.8. Cost ... 60
5.9. CHAPTER 6... 62
6. DISCUSSION ... 62
Introduction ... 62
6.1. The Efficiency of a Compressed Air System ... 62
6.2. Other Alternatives ... 65
6.3. CHAPTER 7... 67
7. CONCLUSION ... 67
Introduction ... 67
7.1. Achievement of Project Objectives ... 67
7.2. Change of Design ... 69
7.3. Future Work and Improvements ... 70
7.4. Bibliography ... 72
Appendix A – Project Specification ... 76
Appendix B – Extended Abstract ... 78
Appendix C – Ideal Thermodynamics Calculations ... 80
Appendix D – Evaluating True CFM Rating of an Air Compressor ... 83
Appendix E – Air Drill Details ... 84
Appendix F – Evaluating True Energy ... 88
Appendix G – Battery System Comparison ... 90
List of Figures
List of Figures
Figure 1 - Total Forecast Commercial Market for Energy Storage in Australia (Consulting, 2012)
... 15
Figure 2 - Australia's Energy Resource (Australia G. , 2011) ... 16
Figure 3 - Conversion of Atmospheric Air into Compressed Air ... 18
Figure 4 - Compressed Air Energy Storage Plant ... 19
Figure 5 - Classification of Electrical Energy Storage System According to the Energy Form .. 22
Figure 6 - Comparison of Various Storage Technologies in Terms of Power Capacity and Discharge Time (Association, 2011). ... 23
Figure 7 - First Generation (Taylor & Halnes, 2010 ) ... 28
Figure 8 - Second Generation (Taylor & Halnes, 2010 ) ... 29
Figure 9 - Third Generation (Taylor & Halnes, 2010 ) ... 29
Figure 10 - Schematic of Renewable CAES System ... 35
Figure 11 - Comparison of Various Storage Technologies (Association, 2011). ... 37
Figure 12 - Air Compressor ... 40
List of Figures
Figure 14 - Angle Drill (Air Motor) ... 42
Figure 15 - Straight Drill (Air Motor)... 42
Figure 16 - Parts Which Make up a Typical Rotary Vane Motor ... 42
Figure 17 – Direction and Air Movement Thought Rotary Vane Motor ... 43
Figure 18 - Model Flow Diagram ... 44
Figure 19 - Energy Stored in kJ / kg for Adiabatic and Isothermal ... 47
Figure 20 - Specific Power in Whr / Litre from Adiabatic and Isothermal Ideal Equations ... 48
Figure 21 - Angle Drill Dyno Test ... 50
Figure 22 - Straight Drill Dyno Test ... 50
Figure 23 - Air Drills Performance Curve ... 52
Figure 24 - Power Out Over Time ... 53
Figure 25 - Both Air Drill Best Efficiency Power Vs Time ... 55
Figure 26 - Air Motor Specification (Ltd., 2006) ... 57
Figure 27 - Energy Density for Various Batteries (Reddy, 2010 ) ... 58
List of Tables
List of Tables
Table 1 - Comparison of Existing CAES Plants ... 25
Acronyms
Acronyms
A Amps
AC Alternating Current
CAES Compressed Air
Energy Storage
CFM Cubic Feet per
Minute
dB Decibels
DC Direct Current
HCAES Hybrid Compressed
Air Energy Storage
J Joules
K Kelvin
kW Kilowatt
kWhr Kilowatt Hour
kPa kilopascals
kg Kilograms
L Litres
Li-Ion Lithium Ion
m Meters
mm Millimeter
mA Milliamps
m3 Meters Cubed
MJ Megajoules
MW Megawatt
Nm Newton meters
P Power
Pa Pascal
PSH Peak Sun Hours
PV Photovoltaic
R Universal Gas
Constant
RPM Revolutions per
Minute
SCAES Small Compressed
Air Energy Storage
W Watts
Symbols
Symbols
Torque
Gamma
CHAPTER 1 - Introduction
CHAPTER 1
1.
INTRODUCTION
Background
1.1.
Australia has a sparse population, peaky energy demand profile and extensive untapped renewable
energy resources. The energy sector understands that continuing on the path of traditional power
generation and transmission / distribution system augmentation is becoming ever-more expensive
(Consulting, 2012). The situation is seemingly right for the broad scale adoption of alternatives such
as energy storage.
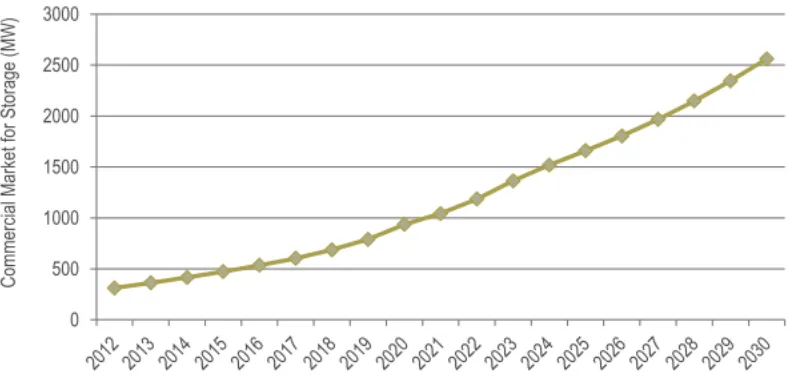
[image:15.595.99.504.415.606.2]With a projected population of million by and the total projected energy consumption of almost by (International, 2010) (Figure 1),
Figure 1 - Total Forecast Commercial Market for Energy Storage in Australia (Consulting, 2012)
CHAPTER 1 - Introduction
We need to take charge of our futures energy needs now and find more viable alternative solutions
though the storage of wind, solar, tidal and ocean energies, which Australia has been fortunate
enough to have an abundance of (Figure 2). This rich diversity of renewable energies may one day
[image:16.595.152.443.181.552.2]contribute substantially to a future with renewable electrical energy.
Figure 2 - Australia's Energy Resource (Australia G. , 2011)
Electricity supply can be divided into four stages: generation, transmission, distribution, and retail.
Although there is a growing base of renewable energy supply in Australia (e.g. wind, hydro, solar)
most electricity is generated by burning fossil fuels (e.g. coal, gas and oil) at large scale
conventional power stations (Consulting, 2012)
These generators, and their fuel, are typically located a long way from where the electricity is
consumed. Moving electricity across these long distances therefore requires a capital-intensive
CHAPTER 1 - Introduction
Balancing electricity supply and demand at all times becomes more challenging in power systems
with higher levels of renewable generation. Inevitably, a significant part of the renewable energy
supply will be intermittent, depending on weather conditions that are variable on several time
scales.
In an article from The Australian “Rooftop solar panels overloading electricity grid” it was reported
that feeding so much solar power back into the network is stressing the system and causing voltage
rises which could damage household devices. In addition to this a spokesman from Energex told
The Australian that “it is becoming more difficult for electricity distribution authorities to set up the
power system to ensure correct voltages (Hepworth, 2011).
The interest in renewable energies is increasing, which is evident with hydro power in the Snowy
Mountains, wind farms in Victoria, South Australia and Queensland, geothermal energy in South
Australia, wave power in Victoria and solar farms in all states. But with all these renewable
energies there is still one problem… Storage…
But why are we always thinking on such a large scale?
In Australia there is a potential to transform private dwelling (consisting of separate houses, semi-detached, terrace houses or townhouses) (Statistics, 2013) into small scale energy
storage stations. This would give the consumers, in this case the occupants; the power to flick a
switch and use stored energy to power their homes and alleviate stresses on the electrical network
and not to mention save money.
What is Power and Energy
1.2.
Before exploring how to store energy there are two terms, which definitions need to be clarified;
these are Powerand Energy:
Power is the rate of which work is done in Watts (W)
&
Energy is the potential to do work in Joules (J).
CHAPTER 1 - Introduction
current) at close to the speed of light. If the generator were to be turned off the current would
instantly stop.
What is Compressed Air
1.3.
Compressed air is a form of stored energy that is used to operate machinery, equipment, or
processes. Compressed air is used in most manufacturing and some service industries, often where
it is impractical or hazardous to use electrical energy directly to supply power to tools and
[image:18.595.143.413.290.479.2]equipment.
Figure 3 - Conversion of Atmospheric Air into Compressed Air
Powered by electricity, a typical air compressor takes approximately seven volumes of air at
atmospheric conditions, and squeezes it into one volume at elevated pressure (about ). The resulting high pressure air is distributed to equipment or tools, where it releases useful energy to the
operating tool or equipment as it is expanded back to atmospheric pressure. (Cunha, 2012 )
It’s important to remember that compressing air involves two different variables which are Pressure
and Volume:
Pressure (kPa) is the measure of how hard the air is pushing against the inside of whatever it is
contained in.
&
CHAPTER 1 - Introduction
Compressed Air Energy Storage (CAES)
1.4.
Compressed air energy storage is a developing technology that has the potential to meet the needs
of intermittent sustainable energy sources and high peak load electrical power demands. With a
very long service period, low cost of energy, low cost of maintenance and operation, and high
power efficiency the CAES power plant produces power by storing energy during off peak periods
(Das & McCalley, 2012 ). This is done in the form of compressed air and used on demand during
the peak periods to generate power with a turbo generator / gas turbine system.
This is not an unproven technology and on a large scale there are two existing CAES plant in the
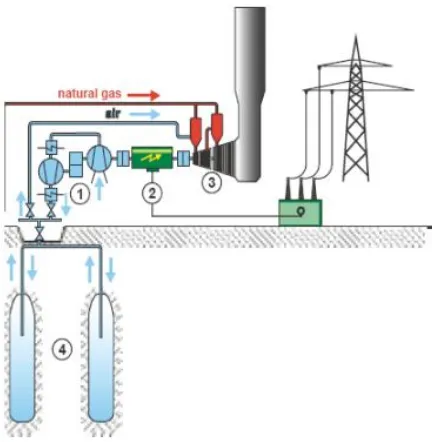
world. The first plant ever built was in Huntorf Germany, which was commissioned in and capable of producing for two hours. The second was in McIntosh Alabama USA, which was commissioned in and capable of producing for hours (Energy C. , 2012). The design behind a CAES system is to use electric power to run compressors that compresses air
into a tank / reservoir at very high pressure, and then the air is used under pressure, to turn a turbine
[image:19.595.123.474.391.644.2]creating power on demand (Figure 4).
CHAPTER 1 - Introduction
Project Aim
1.5.
To investigate the feasibility of using a Small scale Compressed Air Energy Systems (SCAES) in a
domestic household application i.e. to offset the peak demand air conditioning places on local
distribution networks and household economies.
Project Objectives
1.6.
1. Research the existing literature on renewable energies and in particular CAES.
2. Design a CAES as a storage and regeneration plant for a domestic household using
off-the-shelf componentry.
3. Identify all alternatives for the primary energy generation system. PV, wind, solar
thermal etc.
4. Investigate direct air compression from the primary energy source, e.g. wind turbine
driven compressor.
5. Identify efficiency of energy transfer of the various options
6. Identify cost effective componentry that matches the system requirements
7. Create a computational model to assist in system design and optimization
8. Use the model to analyse the potential for CAES to be employed as a cost effective
functional alternative energy storage and regeneration system for domestic households.
As time and resources permit:
9. Implement the CAES design using off-the-shelf componentry into a domestic household
CHAPTER 1 - Introduction
Overview of the Dissertation
1.7.
This dissertation is organized as follows:
Chapter 2 – Shows the outcomes of literature reviews conducted on CAES, SCAES and hybrid system. It explains the energy storage mediums which are currently being used throughout the
renewable energy sector and where CAES are currently being used energy storage.
Chapter 3 – As heat is generated from compression is it important to understand the
thermodynamic behind an ideal system and how heat relates to energy and work. In this chapter the
ideal gas law is explained and the difference between isothermal and adiabatic process.
Chapter 4 – Outlines what is required from an ideal energy source and explains how the efficiency of the system is calculated. In addition to this an overview is given of the SCAES system for this
dissertation and how dynamometer testing was conducted.
Chapter 5 – Presents and discusses the results of the theoretical analysis and practical dynamometer testing. The data is then compared to that of the storage technology of batteries.
Chapter 6 – Provides a discussion on the SCAES system and goes into depth on the systems efficiency and compares to other equipment. Other renewable energy alternatives are discussed as
the primary energy sources and whether they can drive a compressor directly.
CHAPTER 2 – Literature Review
CHAPTER 2
2.
COMPRESSED AIR ENERGY STORAGE
Introduction
2.1.
In order to better understand contemporary CAES technology and research, it was important to
perform a literature review of existing papers, books and other research material. The largest
information resource available was the internet, with selected textbooks on energy storage available
in academic libraries.
In carrying out the review it was found that there were concerns with the following:
1. The amount of losses within a system which decreased efficiencies. These losses were
mainly associated to the heat of compression.
2. The physical size of receiver for the hours of energy storage required.
Energy Storage Technologies
2.2.
Energy storage is a well-established concept yet still relatively unexplored (Connolly, 2010). A
number of very different methods exist to store “electric energy,” some of which are listed in Figure
[image:22.595.77.512.550.740.2]5.
CHAPTER 2 – Literature Review
Only two of those shown actually store the energy in electric form: super-capacitors and
superconducting magnetic energy storage, which keep the energy as electric charge or magnetic
fields respectively. These storage technologies can also be compared in terms of power quality and
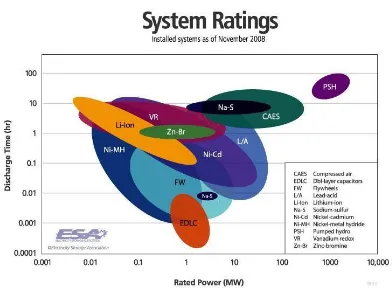
[image:23.595.96.488.184.477.2]discharge time as seen in Figure 6.
Figure 6 - Comparison of Various Storage Technologies in Terms of Power Capacity and Discharge Time (Association, 2011).
Most energy storage systems require the useful energy to be converted from its initial state into
another form which is more suitable for storage. When ready to use it is then converted back into a
useful form. In each conversion there is a loss associated with the efficiency of the conversion
process, and a comparison of several energy storage methods should take the full turn around
efficiency of the storage method into account.
Batteries actually store the energy in a chemical form, but the natural operation of the battery
converts the power to direct current electric power upon being provided with a pathway for the
power to flow. Mechanical storage includes several types of flywheels, compressed air and pumped
CHAPTER 2 – Literature Review
Energy storage systems have always had the back seat when generators can produce energy in real
time as it is being consumed. The large upfront costs of building storage system and the cost
associated with energy losses that occur in converting the energy from one form to another for
storage has made it hard for energy storage to compete.
Conventional Compressed Air Energy Storage (CAES)
2.3.
The CAES technology consists of converting excess base load energy into stored pneumatic energy
in pressure vessels or underground caverns by means of a compressor for later release though a gas
turbine as premium peaking power (Vadasz, 2009).
During compression, heat is generated which is removed before it is stored. This heat energy can be
stored in thermal energy storage for use at a later stage. In a power plant with a standard gas
turbine, approximately two-thirds of the gas is used to compress the air. It therefore makes sense to
use off-peak electrical power to pre-compress the air, and later use the compressed air in the gas
turbines when the turbines are producing electricity during peak hours. In this way, three times the
power is produced for the same fuel consumption (Primm, 2011).
Three different types of underground cavities have been considered for CAES; excavated salt
domes because salt self-seals under pressure, cavities in rock formations (either natural or
excavated) and aquifers. Due to the limited availability of natural locations, sites can be costly and
the stability of any cavern to withstand cycling temperature and pressure must be fully tested and
understood (Primm, 2011).
Where is it Being Used
2.4.
Currently two CAES plants are operational in the world, one in Huntorf, Germany, and the other in
McIntosh, Alabama, USA. Both plants use excavated salt domes for storage.
Table 1shows that the McIntosh plant has a lower total amount of energy per unit output, but this is
a new plant with a recuperator which utilises the waste heat in the turbine exhaust gases to preheat
CHAPTER 2 – Literature Review
Table 1 - Comparison of Existing CAES Plants
Huntorf, Germany
(Energy C. , 2012)
McIntosh, USA
(Energy C. , 2012)
Date of Commissioning
Storage
Two cylindrical salt cavern, each
with at a depth of
One salt cavern at depth of
Output over hours over hours
Energy Required for 1 kWhr of Electricity
electricity, gas (Total )
electricity,
gas (Total
)
Pressure Tolerance Efficiency Remarks World’s first CAES plant First CAES plant with
recuperator
Calculating the efficiency of a plant, care should be taken over the value of input energy,
particularly the value placed upon gas. The simplest method is to give gas the same value as
electricity; in this case the efficiency of Huntorf (which requires electricity and
gas for an output of electricity) would be and the efficiency of McIntosh would be . However, of gas cannot simply be converted into 1 kWhr of electricity – if 1 unit of gas is used in a combined cycle gas turbine with a realistic efficiency
CHAPTER 2 – Literature Review
Small Scale Compressed Air Storage System (SCAES)
2.5.
SCAES is the same concept of the larger CAES system just on a small scale. This technology would
dramatically lighten the loads on networks, help people who cannot connect to a power grid and
serves as an advantage to those people living in developing countries.
Dominique et al investigated the possibility of, off the gird CAES system which uses photovoltaic
(PV) panels as the energy source. Specific details of the paper were the development of PV-CAES
systems that can be operated at very low powers to optimally utilise the output of individual PV
panels.
To achieve this, a single stage isothermal compression system running at that utilises a fluid piston was designed and examined. Focus was on achieving high efficiencies that can
utilise the entire range of the electrical output of a standard residential PV panel, which may not be conducive for operating commercial compressors.
An advantage of the hybrid system was that there would be a decrease in energy losses. This is due
to the reduction in the number of moving parts / components required for the multistage conversion
of solar energy to compressed air to powering household units.
The hybrid system employs a fluid piston which increases volumetric efficiency as well as reduce
dead volume, which corresponds to the clearance between piston radius and outlet.
For different stroke lengths the liquid volume was varied and pressures monitored. In a closed
system the increase in fluid amount leads to an increase in final pressure due to the consequent
decrease in "dead volume". The compression speed ranged from and at a maximum of was achieved. At it took two hours to fill a at as an open system had an efficiency of This was lower than their designed closed system that recorded efficiency of at .
Paloheimo et al have studied CAES for portable electrical and electronic devices like mobile phones
and rural off grid connection which would help developing countries.
Assessments were made on renewability efficiency and compared the storage mediums with the
likes of batteries. During the course of the study it was obvious that different types of storage
equipment use different principles and therefore a direct comparison of storage mediums tends to be
very complex. For comparison between storage systems the following parameters were used;
CHAPTER 2 – Literature Review
For some comparisons compressed air was said to have between efficiency and an unlimited power output whereas Li-Ion battery has an efficiency of and
(Paloheimo & Omidiora, 2009).
It was said that the benefits of compressed air over electric storage are the longer lifetime of
pressure vessels compared to batteries and the materials are entirely benign as well as the costs are
potentially lower. But the costs for production of advanced pressure vessels are still high. On the
other hand, batteries provide nearly constant voltage over their entire charge level, whereas the
pressure of compressed air storage varies the charge level (Paloheimo & Omidiora, 2009).
Paloheimo et al focussed on micro turbines running a plain pressurised air. The electrical output
generated was at but required a speed of 1 . The maximum total efficiency from compressed air to electricity was at this speed.
During an electrical energy Vs volume test it was found that overall conversion efficiency was
assumed to be for a volume of . With these results it was assumed that a pressure of
is needed to obtain of energy, which in theory is limited to due to air flow. Therefore to reach of power would take minutes to fill, this is not taking into account the additional losses which would occur from pumping.
It was identified that the power density was limited by the maximum speed of the ball bearings and
main losses were from the blade profile losses and exit losses. At higher speeds the exit losses were
reduces and therefore efficiency did increase along with power density.
An overview of a mini scale compressed air storage system was reviewed by Khamis et al. The
analysis was focusing on the output pressure from the air compressor unit that can be used to
generate electricity at the generator. They identified that the main advantaged of mini CAES would
be peak shaving, spinning reserve VAR support and arbitrage.
The disadvantages were associated with energy conversion losses that are inevitable. It was estimate
CHAPTER 2 – Literature Review
According to their results the tanks released at would last for seconds and
lasted seconds. Khamis et al concluded that when the level of pressure was increased the time taken to use the reservoir was shortened. Further analysis of the DC generator found that the
output voltage produced was proportional to the speed of the micro turbine.
Khamis et al also found that the system built was capable of producing output instead of the desired ; this was due to the low input air pressure entering the micro turbine.
According to Taylor et al analysis of compressed air energy storage renewable energy sources on
power grids is creating a significant challenge for the electricity industry.
This fluctuation is dependent on the penetration of renewables, the size of the grid and the
availability of other power sources such as gas turbines, open cycle gas turbines or hydro. This is
expected to become worse as the level of installed renewable energy increases. To overcome this
“smart” energy grids with improved metering and increased demand control are expected to be the
solution.
Their technical analysis identified three generations of CAES plants.
First generation (Figure 7) refers to a conventional plant which comprises of both compression and
[image:28.595.184.400.481.702.2]generation components. The first operational system was Huntorf, Germany in and the second was McIntosh, Alabama in .
CHAPTER 2 – Literature Review
Second generation (Figure 8) is very similar to the first however advancements were made in
[image:29.595.183.404.136.312.2]technology and turn around efficiencies are approximately compared with for a first generation system.
Figure 8 - Second Generation (Taylor & Halnes, 2010 )
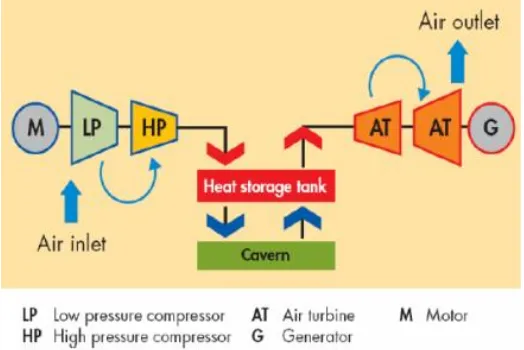
Third generation (Figure 9) or adiabatic CAES system does not use natural gas in the generation
process (as the latest design uses molten salt heat storage, heated with solar thermal power
generators). This system stores the heat of compression which is re-used during generation to warm
the compressed air. One benefit of this generation is zero carbon emissions as there is no fuel
consumption required in the turbine section.
[image:29.595.167.429.512.687.2]CHAPTER 2 – Literature Review
Large CAES plants require a suitable sealed underground cavern for air storage as above ground
vessels do not have the scale necessary. It has been found that the mined salt rock caverns are the
best option for storage, while aquifers and abandoned mines and depleted oil and gas fields are
promising. Salt cavern for CAES operated between . These pressures result in the cavern being contained between deep and a volume of or Varin Vongmanee conducted a study on the renewable energy applications for uninterruptible
power supply based on compressed air energy storage system. The study used wind energy to
produce the compressed air power via a compressor.
Varin states ‘because wind power is primarily uncontrollable as an energy source it requires a
CAES plants to store wind energy. Which then can be distributed during power outage, used during
peak hours or peak shaving, or when energy is needed and cost of energy is high’.
As wind energy is kinetic energy and requires large masses of air moving over the earth’s surface.
The wind turbine receives kinetic energy that is transformed to mechanical or electrical forms
depending on end use.
The simulation results show that the compression and expansion pressure directly depends on air
flow rate and system efficiency. With improvements to the system efficiency of thermodynamic
conversion, the system should be able to operate by increasing pressure ratio of compression, or
increasing the pressure of expansion power.
Although more stages can increase efficiency, the system is complex and incurs high initial and
maintenance cost. His proposed simulation results could be used for backup power system and peak
CHAPTER 3- Thermodynamics
CHAPTER 3
3.
THERMODYNAMICS
Introduction
3.1.
Thermodynamics can be defined as the science of energy. The name thermodynamics stems from
the Greek words therme (heat) and dynamis (power), which is most descriptive of the early efforts
to convert heat into power (Yunus Cengel, 2002).
In both large and small scale CAES system energy storage is done by compressing air adiabatically
or isothermally. This chapter gives an introduction into the equations used when calculating energy
from air and energy density.
Adiabatic Compression of Air
3.2.
An adiabatic system is one which is thermally insulated from its surroundings therefore heat is
neither supplied nor rejected. (R.K.Rajput, 2007). The heat generated during the compression cycle
is stored as thermal energy and then released during expansion to increase the flow of air though the
outlet.
Isothermal Compression of Air
3.3.
An isothermal process is a change of a system during which the temperature remains constant
(R.K.Rajput, 2007). Isothermal processes occur when the system is thermally connected to a
constant-temperature external reservoir, and when the change in the system is happening so slowly
that the system continually maintains the same temperature as the external reservoir through heat
CHAPTER 3- Thermodynamics
Ideal Gas Law
3.4.
The ideal gas law tells us that the absolute pressure of an ideal gas is given by
Where is pressure in kilopascals ( ), is the volume of the gas in cubic meters ( ), is the mass of the substance in kilograms ( ), is the universal gas constant in kilojoules per kilogram-Kelvin , and is the absolute temperature in Kelvin ( (Pauken, 2011).
In the isothermal process, remains constant and so the numerator of equation also remains
constant. As a result, for an isothermal process:
This shows that at constant temperature the volume occupied by a fixed amount of gas is inversely
proportional to the pressure on the gas (Harrison).
This relationship is known as Boyle’s Law.
The work done in the isothermal expansion from stored volume to volume is:
∫ ∫
∫
As shown in the above equation, the product remains unchanged for an ideal gas
undergoing an isothermal process, so:
To calculate the energy available in a store of compressed air that is to be expanded isothermally,
we let and be the pressure and volume of the air in the store and be the pressure of the
expanded air (atmospheric pressure if all the available energy is taken out of the compressed air by
CHAPTER 3- Thermodynamics
An adiabatic process is a change of a system during which no energy enters or leaves the system
through heat exchange. A purely adiabatic process can only occur if the system is thermally
insulated from the surroundings. The pressure and volume of an ideal gas undergoing a reversible
adiabatic process are related by:
Where is the adiabatic index of the gas, given by:
is the fluid’s specific heat capacity at constant pressure, is the specific heat capacity at
constant volume, and for a diatomic gas and for a monatomic gas. Air is essentially a diatomic gas, so we use .
In calculating the net work input in the adiabatic compression of air from atmospheric pressure to
storage pressure , we must include the work associated with moving the air from the atmosphere
into the compression volume ( ) and discharging the high pressure air ( ), causing the integration for work to become ∫ , rather than ∫ .
If the compressed air is preheated to the temperature it has after compression and then expanded
adiabatically, is equal to the network input in the compression. From equation
Which can rearrange to obtain the Pressure:
So in an adiabatic process the net work done by the system is given by:
∫ ∫
[ ]
[
]
CHAPTER 3- Thermodynamics
[ ]
The final absolute temperature of a gas undergoing an adiabatic process is as followed
( )
In practice, purely isothermal or adiabatic processes cannot occur because there is no such thing as
a perfect conductor or insulator. Processes can be very close to purely isothermal or adiabatic, and
we use the equations describing purely isothermal and adiabatic processes as means to calculate
lower and upper bounds on the amount of energy available in a store of compressed air:
Isothermal expansion at atmospheric temperature is the lower bound, and adiabatic expansion from
the temperature of the air after adiabatic compression (so leaving the expander at atmospheric
temperature and pressure) is the upper bound.
Whether a process is isothermal or adiabatic depends upon the thermal conductivity of the system
boundary and the speed at which the process occurs: a very quick process, in which little heat is
transferred between the system and its surroundings, may be considered adiabatic, and a very slow
process, in which the system’s temperature remains constant, may be considered isothermal
CHAPTER 4 – Methodology
CHAPTER 4
4.
METHODOLOGY
Introduction
4.1.
In order to evaluate the SCAES technology and compare it to existing energy storage
technologies it is important to look at what is required from an ideal energy storage system and
then do an evaluation on the existing technology.
Equipment specifications for the components of the proposed SCAES design were used to
develop a theoretical model of the system. The results were then compared against a practical
model using off the shelf items. The SCAES system for this dissertation is proposed to be
entirely renewable (Figure 10) and can be split into three distinct disciplines electrical /
mechanical and pneumatic. Where by the electrical system consists of PV cells / converter, DC
motor and AC generator and the mechanical / pneumatic system incorporates air compressor,
[image:35.612.150.466.452.679.2]CHAPTER 4 – Methodology
Analysis of Installed Energy Storage Technologies
4.2.
In order to analyse the ultimate energy storage device it is important to first identify the ideal
characteristics of such a storage system. In this research, work the focus was on addressing the
energy storage requirements for a small scale renewable energy storage system. Desired
characteristics of such an energy storage system could be a combination of the following:
High energy to weight ratio. High battery capacity. Quick recharge capacity. Long cycle life.
Low cost. Robustness.
Simple to maintain. Fast response.
Current fluctuation tolerance. Low self-discharge rate. Low effect of temperature. High cell or battery voltage. High turn-around efficiency. High depth of discharge. Low environmental impact. High safety factor.
For the purpose of this dissertation the range “Small Sized” energy storage devices are assumed
to be from to approx. . With this in mind Figure 11 below indicates the performance of a number of commercially installed storage application with respect to their time of
CHAPTER 4 – Methodology
Figure 11 - Comparison of Various Storage Technologies (Association, 2011).
Based on Figure 11 the obvious technologies for small application would be
Lithium-ion battery
Nickel-metal hydride battery Vanadium redox battery
It must be said though that this is only based on time of discharge and rated power which does
CHAPTER 4 – Methodology
Small Scale Compressed Air Storage
4.3.
As it has been said throughout this dissertation compressed air technology is not new and has
been effectively used in commercial application for many years. Some of the main advantages of
compressed air are
Can be stored for extended periods It is non-polluting
It is non-flammable It is non-toxic
Most compressed air equipment is recyclable Compressed air systems have a high cyclic life time Air motors are simple, robust and deliver a high torque Can be used within a hazardous area
As with chemical batteries and hydrogen storage, the main disadvantage of compressed air is the
indirect use of energy. Energy is required to first compress the air, after which decompressing
the air releases the energy to drive air equipment such as air motors. The conversion between
different energy carriers will result in losses, which will reduce the overall efficiency of such a
system. Additional disadvantages are
When air is compressed it heats up, and heat energy is lost to surroundings.
When compressed air is decompressed it cools down, reducing its working pressure. Moisture and particles in the air could affect or damage the equipment due to the high
working pressures required.
CHAPTER 4 – Methodology
Efficiency of Conversion
4.4.
“Efficiency” in energy storage systems most often refers to how well the system uses space or
weight to store energy (Willis & Scott, 2000 ). The efficiency of an energy device is a
quantitative expression of balance between energy input and energy output and can be defined as
follows:
With the conversion from one type of energy to another the conversion efficiency is never 100%
and the output energy is always going to be lower than what is inputted which is evident from the
equation above.
Selected Equipment for Design
4.5.
The SCAES model was designed using off the shelf equipment to store compressed air to use as
a energy source. Ideally the system would have a small footprint which is easily adaptable to any
residential house without it being an eyesore. If the design is successful the system would be
easy to assemble affordable and transportable.
Photovoltaic Cells
4.5.1.
Solar energy is the cleanest and greenest source of renewable energy generated electricity. Using
advanced cell technology the panel efficiency is said to be . An advantage of using solar panels and a clean regulated supply is once the receivers at capacity, any excess energy
generated by the panels can be fed back into the grid reducing your electricity costs and saving
CHAPTER 4 – Methodology
Air Compressor Package
4.5.2.
AC motors are typically – efficient or more when converting electricity into mechanical power. The size of the motor used during testing was and characteristically for every
the motor is rated to the compressor can output cubic feet per minute ( at
(Toolbox).
The type of compressor used was a single-acting reciprocating compressor which was air-cooled
similar to that of Figure 12. These types of compressor are said to be less efficient than other
[image:40.612.174.436.330.509.2]types (Challenge, 2003). The compressors output was and held of compressed air in the receiver. This was confirmed by the calculations as seen in Appendix D.
CHAPTER 4 – Methodology
An air pressure regulator was necessary for the air motor during testing as there needed to be at
constant pressure regardless of the rise and fall of line pressure to verify the maximum efficiency
[image:41.612.254.359.171.353.2]profile of the air tools.
Figure 13 - Air Pressure Regulator
Air Motor
4.5.3.
A pneumatic motor or compressed air engine is a type of motor which does mechanical work by
expanding compressed air. Pneumatic motors generally typically operate at and convert the compressed air to mechanical work through either linear or rotary motion. Linear motion can
come from either a diaphragm or piston actuator, while rotary motion is supplied by either a vane
type air motor or piston air motor.
Figure 14 & Figure 15 show the type of air drill which were used. Both were of rotary vane type
CHAPTER 4 – Methodology
Figure 14 - Angle Drill (Air Motor) Figure 15 - Straight Drill (Air Motor)
They operate using blades that fit into radial slots in a rotor which can be seen below in Figure
16
Figure 16 - Parts Which Make up a Typical Rotary Vane Motor
The rotary motion is a result of air pressure exerted against the exposed area of the blades. Thus,
the force produced is transmitted through the rotor gearing to the output shaft or is transmitted
directly, if no gears are used. The air is then discharged when it reaches the exhaust port (Figure
[image:42.612.147.461.383.524.2]CHAPTER 4 – Methodology
[image:43.612.143.466.74.245.2](a) Single Direction (b) Reversible Direction
Figure 17 – Direction and Air Movement Thought Rotary Vane Motor
As a load is applied to such a non-governed air motor, the speed decreases and the torque and
horsepower increase to a level where they match the load. As the load is increased, the
horsepower produced by the motor continues to increase until the motor slows to roughly half of
free speed. At this point, the motor has reached peak horsepower and will run at greatest
efficiency. If the load is increased beyond this point, the torque will continue to increase to the
stall point, but the horsepower will decrease.
In this design the air motor were off the shelf air drills, the drills characteristics can be found in
[image:43.612.92.519.521.653.2]Table 2.
Table 2 - Specification of Air Motors
Angle Drill (Figure 14)
Straight Drill (Figure 15) Chuck Capacity
Free Speed Average Air Consumption
CHAPTER 4 – Methodology
AC Generator
4.5.4.
Although not tested in this design it was proposed that electrical output was required. To do this
a generator would be required to output a voltage which could be used though an inverter. This
would ensure that the power is clean and at a usable voltage.
Model Development Flow Diagram
4.6.
Figure 18 below shows a flow diagram of the equipment listed in Section 4.5 and how it’s
[image:44.612.137.467.305.473.2]connected for the SCAES system.
Figure 18 - Model Flow Diagram
Bench Testing System
4.7.
Verification of the air compressors and air motors efficiency was a key outcome for this
CHAPTER 4 – Methodology
A small dynamometer was built to test the air motors. A dynamometer or "dyno" for short is a
device for measuring force, moment of force (torque), or power. As power is not directly
measured but calculated from the torque, the torque needed to be found using:
Where is Torque measured in Newton-meters, is the Force applied in and is the radius of the pulley. Power then can be found using torque multiplied by the angular velocity using:
Where is Power in Watts , is Torque in Newton-meters and is the angular velocity in radians per second ( ) which can be found by:
Testing was performed at six different pressures: , , , ,
and finally . With the air receiver at and compressor switched off, the air motors where run at constant torques with fixed speed near the maximum speed.
During the test the torque and speed have to be maintained until the pressure dropped below the
regulated pressure. The time which the test ran and the final tank pressure (the final tank pressure
should be the same as the set regulated pressure used in that test) needed to be recorded. This
process was repeated for different torques and speeds at all the regulated pressures.
For each of these tests, data for power out over time gives the energy released. From the initial
and final pressures in the tank, the proportion of the compressed air used can be calculated using
the ideal gas law. This identifies which power setting produces the best efficiency, that is, the
CHAPTER 5 – Results
CHAPTER 5
5.
RESULTS FROM ANALYSIS OF PROPOSED DESIGN
Introduction
5.1.
MATLAB® which is a high-level language and interactive environment for numerical
computation was used to create a model to analyse the SCAES system. A main goal was to
produce some correlation between the theoretical analysis and the data from the dyno. It was
found that the dyno results were substantially lower than the ideal equations which were used to
calculate the stored energy and specific power.
Theoretical Analysis
5.2.
Isothermal and adiabatic equations are ‘ideal’ equations that are never actually achieved by
physical machines. An actual air compressor and motor will not achieve the values that these
formulae calculate.
It can be seen from Figure 19 that the isothermal equation produces more
specific energy then adiabatic equation . This is due to the assumption that the
air stays at constant temperature during expansion. This we know to be untrue, as air drops in
temperature during expansion which is evident after periods of running an air tool they tend to be
cold. To keep the temperature constant, energy must be added and this is in the form of heat
(adiabatic process). This heat energy is seen as work in expanding the air which is why more
energy’s gained from isothermal expansion.
These figures were produced using pressures, temperatures and volumes you would see on an off
the shelf air compressor (Figure 12). The pressure range was from to a maximum of
CHAPTER 5 – Results
specific gas constant for air needed to be known which is . Temperature needs to also be converted to Kelvins ( ) before solving (Appendix C).
Using the MATLAB® script Ideal_Gas_Equations.m (Appendix I) the energy stored in Adiabatic
and isothermal compression was calculated over the entire pressure range ( – ). Figure 19 shows the energy which both curves have at , as this is when maximum power was achieved during dyno testing. As it was said above the isothermal equation produces
more stored energy which is due to the assumption that the air stays at constant temperature
during expansion.
The amount of stored energy in the isothermal process was and adiabatic process was
[image:47.612.99.499.394.678.2]CHAPTER 5 – Results
The ideal equations did indicate that at that both curves stored energy would be . This would be impractical when dyno testing as there would only be of usable energy in the receiver if the maximum pressure was
The ratio of the specific power which is a calculation commonly applied to mobile power
sources, enables the comparison of one unit or design to another. Power-to-weight ratio is a
measurement of actual performance of any power source. Figure 20 shows the specific power for
both ideal equations. This is calculated using the stored energy in the compressed air divided by
the volume of the receiver in liters. At the curves show that the adiabatic specific power is significantly lower than that of the isothermal specific power for the same pressure,
which was and respectively. As pressure increases to its indicated that more specific power per litre would be obtained from an isothermal process rather
[image:48.612.104.502.368.659.2]than adiabatic.
CHAPTER 5 – Results
Practical Review
5.3.
To produce some correlation between the ideal isothermal and adiabatic equations in Section 5.2,
a dyno test was performed (Figure 21 and Figure 22). This was done to create a performance
curves for each air motors when operated at different torques for different pressures. It was found
that the dyno results were substantially lower than the theoretical results, as the theory does not
take into account losses like compressor mechanical and storage tank thermal losses, compressor
and air motor thermodynamic efficiency, air motor mechanical efficiency and friction and flow
losses.
Total Energy Compressor Used to Fill Receiver
5.4.
In order to calculate the results the total energy used in pumping up the receiver from empty to
full needed to be calculated. This was done using the time taken to fill the receiver and the
electric motors running current. The compressor was found to draw less current when the
receiver pressure was low and more current as the pressure increased. This is due to the
compressor having to overcome the receiver pressure on each stroke before any air enters the
receiver (Klenck, 1997).
Using MATLABs® interpolation function interp1() a larger number of points could be
produced given a smoother plot over the whole time. The overall time which the compressor
took to fill the receiver was seconds which worked out that the total energy which the compressor used was This total energy will be used to calculate the efficiency of the system.
It is possible that this result could have been improved if the compressor was new. The
compressor used had been in service for years on building sites to run various air tools like drills and nail guns. The compressor had little maintenance done yet though the calculations seen
CHAPTER 5 – Results
Air Drill Dynamometer
5.5.
The dyno used for testing the air tools was very simple yet effective. A set of sliding scales were
fixed to the bed plate and attached to that was a section of V-belt. The maximum weight of the
scales was with increments of . This allowed for the torque of the system to be measured though a lever also attached to the bedplate. This lever was used to apply a fixed load
to the V-belt in the pulley once the air drills were running.
To find the power of the air drill we must refer back to Section 4.7 where it stated that torque
was a product of force multiplied by the radius of the pulley. The size of the pulley for testing
had a diameter of . Once the torque was known (which for each test the only variable was the force applied) the power could be deduced. This was done by using the torque and
multiplying it by the angular velocity.
[image:50.612.302.544.394.694.2]The layout of the dyno can be seen in Figure 21 and Figure 22 below.
[image:50.612.73.303.394.693.2]CHAPTER 5 – Results
Maximum Efficiency Profile
5.6.
In order to find the maximum efficiency profile for each air drill a number of tests were
performed. The idea was to create a profile for each regulated pressure using five or six different
torques and speed settings. It was also important to record the time taken to use the compressed
air from a full receiver to the set regulated pressure which would be used to find the energy that
could be obtained.
The data was then entered into two MATLAB® scripts: Test_Straight_Drill.m and Test_
Angle_Drill.m (Appendix I). For each individual pressure it was seen that the power would
slowly increase, peak and drop off. Where the peak occurred was the maximum output of the
drill for that pressure.
When combining all these results the maximum efficiency profile for both air drills can be seen
below in Figure 23. Maximum power is said to be achieved when the air motor is operating at
about half its free speed and this is where they are most efficient (Air Motors, 2012) this being
the case the maximum power was produced by the angle drill at outputting , and the straight drill at outputting .
Looking at the specification for the straight drill in Appendix E, it states that the power output
for the straight drill is at , which if we compare to the straight dill air motor graphs in Figure 23 it works out to be at . There was no information found regarding power output for the angle drill to make comparison.
CHAPTER 5 – Results
CHAPTER 5 – Results
Once the maximum efficiency profile was produced the total energy for the system could be
found using Figure 24; power out over time curve. This represented the time each test lasted for
at each of the pressures tested. The graphs output can give the amount of energy in due to the relationship power has to time.
Figure 24 show the combined total time which the maximum output power lasted for, this was
seconds for the angle drill and seconds for the straight drill. This gave an efficiency of
[image:53.612.80.531.309.662.2]CHAPTER 5 – Results
To find the true efficiences of the air drills some calculations had to be performed. This was done
to find what proportion of the compressed air was used, in relation to the mass (kg) of the air in
the receiver, using the ideal gas law. The results for both air tools can be seen in Appendix F.
From the results it was found that the angle drills energy output was and for the straight drill.
The efficiency of the system is defined as the ratio of compressed air output to input power
which was explained in Section 4.4. Using this ratio and knowing that the total input energy for
the compressor was (Section 5.4) the efficiency of the air drill were calculated: Angle drills efficiency:
Straight drill efficiency:
This shows that the efficiency of the system to be between which is due to all the losses in the system which were mentioned in Section 5.3.
To confirm that the system efficiencies were indeed correct a further test using the maximum
efficiency profile was performed to find the actual performance of the drills. This was done using
Tank_Usage.m script in Appendix I.
To perform this test the regulator was set at as this is where the maximum power output was achieved for both drills in Figure 23. With a full receiver and compressor switched off the
air drills were run at their maximum efficiency. The results from this test can be seen below in
CHAPTER 5 – Results
Figure 25 - Both Air Drill Best Efficiency Power Vs Time
Using Figure 25 and MATLABs® interpolation function, the kilowatt hours of each drill could be
calculated. To find the are under the curve, MATLABs® step function trapz() was used with a
step internal of one second. This would result in the answer being in kilowatts per second ( )
which is also the same as kilojoules (kJ).
To find the total energy of the system the following relationship was used:
CHAPTER 5 – Results
The efficiency was then calculated using the energy from the air tools over the energy used by
the compressor to fill the tank:
Angle drills efficiency:
Straight Drill efficiency:
The results from the maximum efficiency profile during this test now confirm that the efficiency
of the system is only .
Knowing the energy which the air drills outputted the power-to-weight ratio for the drills could
also be calculated using the receiver volume of . It was found that the angle drills specific power was and straight drills specific power was .
Therefore like it was stated earlier the results for the ideal equations were not able to be
reproduce though practical testing. Where the ideal equation achieved an energy output of
approx. at in practice, the system was only able to achieve of energy. If this system was able to output a continuous at then using the compressor input energy ( we can work the efficiency out to be . This wasn’t the case; after all the testing was complete the efficiency was only . To further compare results between the theory and practical the specific power of the system also was substantially
CHAPTER 5 – Results
Figure 26 - Air Motor Specification (Ltd., 2006)
It must be noted that the results after testing the air motor did not compare to actual real life data
for air motor designed for this application. Figure 26 shows the details of a air motor which uses and the performance at maximum torque is at . The straight drills maximum performance was for second and for this to be achieved it used approx.
. The performance at maximum torque was at . If a larger tank were used and a compressor that could keep up with demand then this result could have been better.
This information confirms that if an air motor of this type was as a replacement for the air drill,
then a lot more stored air would be needed for this to operate correctly and for the required
amount of time.
Comparison Between Storage Devices
5.7.
In Section 4.2 it explained the desired characteristics of a storage device which we will look at
now to give some comparison between the findings from the theoretical analysis and the dyno
testing. It was found from the results that the characteristics for this SCAES system where.
CHAPTER 5 – Results
Simple to maintain. Low environmental impact
Quick recharge capacity