Int. J. Electrochem. Sci., 7 (2012) 5172 - 5184
International Journal of
ELECTROCHEMICAL
SCIENCE
www.electrochemsci.org
Reduction of Graphene Oxide Via Ascorbic Acid and Its
Application for Simultaneous Detection of Dopamine And
Ascorbic Acid
Xu Zhu1, Qin Liu2, Xiaohua Zhu2, Chunlan Li1, Maotian Xu1,*, Yong Liang2,* 1
Henan Key Laboratory Cultivation Base of Nanobiological Analytical Chemistry, Department of Chemistry, Shangqiu Normal University, Shangqiu 476000, People’s Republic of China
2
Department of Chemistry and Environment, South China Normal University, Guangzhou 510631, People’s Republic of China
*
E-mail: [email protected]; [email protected]
Received: 20 April 2012 / Accepted: 14 May 2012 / Published: 1 June 2012
A new approach to synthesize graphene was applied by reduction of graphene oxide using ascorbic acid. Chitosan/graphene modified electrode could be employed for simultaneous determination of dopamine and ascorbic acid. The modified electrode showed excellent electrocatalytic activity towards the oxidation of DA and AA. The calibration curves for DA and AA were obtained in the range of 0.3-1067.5M and 0.6-1378.1M, respectively. Detection limits were 0.1M and 0.01M for DA and AA, respectively. The present method was applied to the determination of AA and DA in human serum samples and the results were quite promising.
Keywords: graphene; chitosan; dopamine; ascorbic acid; electrochemistry
1. INTRODUCTION
overcome these problems, various modified electrodes have been constructed such as organic redox mediators modified electrodes [5], polymers modified electrodes [3, 6], nanoparticles modified electrodes [7-9], boron-doped diamond modified electrode [10], carbon-ceramic modified electrodes [11], pyrolytic graphite modified electrodes [12, 13], screen-printed carbon modified electrode [14], carbon ionic liquid modified electrode [15] and carbon nanotube modified electrodes [16].
Graphene is a monolayer form of carbon with a two-dimensional (2D) honeycomb lattice. It has shown many intriguing properties, including high mobility of charge carriers [17, 18], unique transport performance [19, 20], high mechanical strength [21, 22], and extremely high thermal conductivity [23, 24]. The unique prosperities attracted tremendous attention from fundamental research and possible applications. The unexpected properties, where electrons obey a linear dispersion relation and behave like massless relativistic particles, resulting in the observation of a number of very peculiar electronic properties such as the quantum Hall effect [25] and transport via relativistic Dirac fermions [18]. Their unusual electronic and robust transport properties [26] may be useful in the electronics or in the related regions. Shang et al. reported an electrochemical method for selective detection of dopamine based on multilayer graphene nano flake films [27].
Ever since the discovery of the advantageous properties of graphene, the challenge has been to produce graphene sheets in a bulk quantity [17, 28-31]. So far, many methods have been developed to produce graphene. Mechanical cleavage of graphite originally led to the discovery of graphene sheets [32, 33]. However, the low productivity makes it unsuitable for large-scale utilization. Later, epitaxial growth allows the fabrication of a patterned graphene structure [28, 34, 35]. Furthermore, rapidly thermal expanded graphite was applied to make graphene sheets, but it hardly produces complete exfoliation of graphite to the atomic level of individual graphene sheets [36, 37]. Then, chemical reduction of exfoliated graphene oxide sheets with hydrazine hydrate and hydroquinone as the reducing agents was proposed [38-42]. However, the excessive reducing agents employed in this approach could contaminate the resulting materials and introduced defects in graphene sheets [43, 44]. Recently, electrochemical reduction of exfoliated GO was reported [45].
Here we report a new approach to the synthesis of high quality graphene nanosheets in large scale by reduction of GO using ascorbic acid. This method is rapid and green as nontoxic solvents are used which will not result in contamination of the products; meanwhile, the productivity is also high enough. The modified electrode fabricated by graphene and chitosan can be applied for simultaneous determination of dopamine and ascorbic acid. While the chitosan was the matrix with pH = 4.0, the positive-charged DA was repelled by chitosan, resulting in the potential of DA a positive shift and the peak separations between AA and DA. Therefore, it can realize the simultaneous determination of dopamine and ascorbic acid in their mixture.
2. EXPERIMENTAL
2.1. Reagents
Co., Ltd. 0.1M phosphate buffer solution (PBS, pH 4.0, adjusted with HCl) was used as the supporting electrolyte. All other reagents were of analytical grade. Doubly distilled water was used throughout the whole experiments.
2.2. Apparatus
Electrochemical measurements were performed on a CHI660D electrochemical workstation (Chenhua Instrument Company of Shanghai, China) with conventional three-electrode cell. A bare glassy carbon (GC) electrode or the modified electrode was used as the working electrode. A saturated calomel electrode (SCE) and a platinum wire were used as the reference and counter electrodes, respectively.
2.3. Preparation of graphene
Graphene oxides were synthesized directly from graphite according to Hummers method [46]. The reduced graphene was prepared by using ascorbic acid as the reduction agent. GO and 0.1M AA was mixed with a volume ration of 1:1 and sonicated for 30min at 60oC, the reduction products were centrifuged at 10000r/s to remove the supernatant. Then, excess 30% H2O2 was added to the black suspension to oxide the remaining AA by sonicating for 30min at 60oC. After ultrasonic, the resulted mixture were collected by centrigugation at 10000r/s, washed with ethanol and water 3 times respectively and dried at 120 oC.
2.4. Fabrication of the Chitosan-Graphene composite film
0.5mg graphene was added to 1mL 0.5% chitosan to form homogenous dispersion with ultrasonication for 2h. Prior to the surface modification, the bare GC electrode was polished carefully with 1.0 m, 0.3 m and 0.05 m alumina power, respectively, and rinsed with deionized water, followed by sonicated in acetone and doubly distilled water successively and dried through air drying. Then, an aliquot of 5L of the mixture was coated on the electrode, and then the solvent was evaporated under an infrared lamp to obtain the chitosan-graphene composite film modified glass carbon electrode (Chi/GR/GCE).
3. RESULTS AND DISCUSSION
3.1. Characterization of synthesized graphene
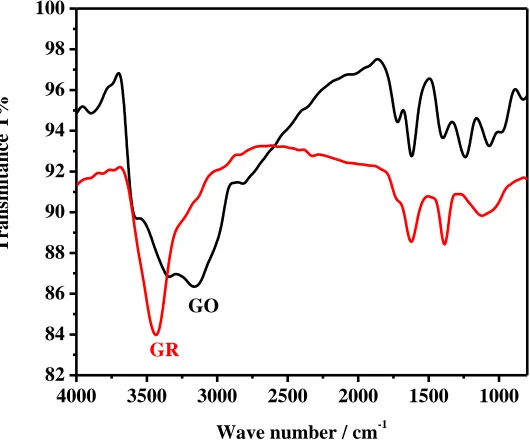
The absorption of reduced graphene red shifts from 230 to 260nm, suggesting that the electronic conjugation within graphene sheets is restored after the reaction [47]. The recovery of the electronic conjugation within graphene sheets is extremely important for increasing the peak current of AA and DA [48], which is proved by cyclic voltammetric measurements as follow. The formation of reduced graphene is also confirmed by FT-IR (Fig. 1B), some of the bands around 3400, 3150, 1730, 1630, 1400, 1250, and 1077 cm-1 which are attributed to the residual oxygen functionalities on GO still present on the GR surface with a lower transmitance after the reduction [49].
250 300 350 400 450 500 550 600
0.0 0.2 0.4 0.6 0.8 1.0
b
a 230nm
260nm
A
bs
o
rba
nce
[image:4.596.160.434.228.448.2]Wavelength / nm
Figure 1A. UV-Visible spectra of (a) graphene oxide, (b) graphene in water.
4000 3500 3000 2500 2000 1500 1000
82 84 86 88 90 92 94 96 98 100
GR
GO
Tra
ns
m
ita
nce T%
Wave number / cm-1
[image:4.596.167.432.513.734.2]
3.2. Electrocatalytic oxidation of AA and DA
0.6 0.4 0.2 0.0 -0.2
-4 -3 -2 -1 0 1
DA
AA
I
/
A
E / V vs. SCE
A
0.6 0.4 0.2 0.0 -0.2
-6 -4 -2 0 2 4
DA AA
I
/
A
E / V vs. SCE
[image:5.596.162.453.112.591.2]B
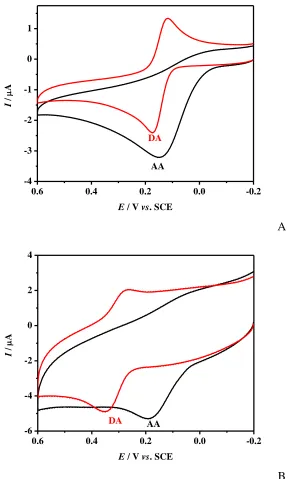
Figure 2. (A) CVs at bare electrode in 0.1M PBS (pH 4.0) containing 0.1mM DA and 0.2mM AA in each case. Scan rate: 50mV s-1. (B) CVs at Chi/GR/GCE in 0.1M PBS (pH 4.0) containing 0.1mM DA and 0.2mM AA in each case. Scan rate: 50mV s-1.
of Chi/GR/GCE. The anodic and cathodic peak potentials of DA appear at 369mV and 268mV. The separation of anodic and cathodic peak potentials is 87mV, indicating that the reversibility of DA at Chi/GR/GCE is considerably improved. The peak potential for the oxidation of AA shifts from 163mV to 182mV by the modification of chitosan and graphene. The results above demonstrate that chitosan-graphene composite dramatically enlarge the peak separation between AA and DA. The enlarged separation of the anodic peak potential, coupled with the increased sensitivity, renders simultaneous determination of AA and DA feasible.
3.3. Effects of scan rate and accumulation time on the electrochemical response of AA and DA
0.6 0.4 0.2 0.0 -0.2
-10 -8 -6 -4 -2 0 2 4 6 8
20406080 100 120 140 160 180 200 1.5 2.0 2.5 3.0 3.5 4.0 C u r r e n t / A
Scan rate / mv/s
I
/
A
E / V vs. SCE
A
0.6 0.4 0.2 0.0 -0.2
-8 -6 -4 -2 0 2 4
6 7 8 9 1011121314 1.2 1.4 1.6 1.8 2.0 2.2 C u rr en t / A
(Scan rate)1/2 / (mV/s)1/2
I
/
A
E / V vs. SCE
[image:6.596.160.456.249.696.2]B
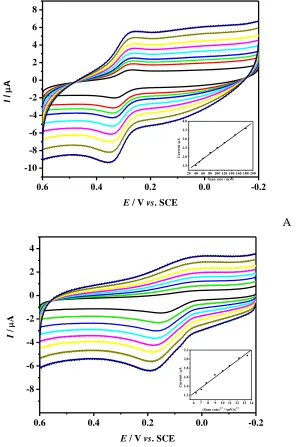
A study on the effect of scan rate on the response of Chi/GR/GCE toward oxidation of AA and DA showed that the CVs of AA and DA depended on the scan rate. The typical illustrative CVs of AA and DA are shown in Fig. 3.
The anodic peak currents of both compounds linearly increased with the scan rate over the range of 20-180 mV/s, suggesting that the electron transfers for AA and DA at the Chi/GR/GCE are absorption controlled [50, 51]. Hence, we further investigated the effects of accumulation time on the determination of AA and DA at the Chi/GR/GCE. The obtained results showed that the peak current of AA rapidly increased, when there was an increase in the accumulation time and the maximum peak currents were obtained at 25s for both AA and DA. Therefore, an accumulation time of 25s was used in the following experiments.
3.4. Effect of pH on the electrochemical oxidation of AA and DA
2 4 6 8 10
0.0 0.4 0.8 1.2 1.6 2.0 2.4 2.8
I p,a
/
A
pH
AA DA
A
2 4 6 8 10
-0.1 0.0 0.1 0.2 0.3 0.4 0.5 0.6
E p
,a
/
V
pH
AA DA
2 3 4 5 6 7 8 9 10 11
0.14 0.16 0.18 0.20 0.22 0.24
Ep
pH
C
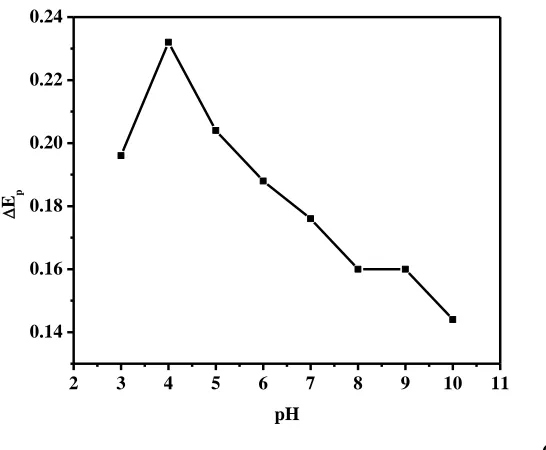
Figure 4. Effect of pH on (A) the peak current, the potential (B) and (C) the separation of the peak potentials (Ep) for the oxidation of 60 M DA and 300 M AA in 0.1 M PBS. DPV conditions: scan rate, 20 mV s-1; amplitude, 50mV; pulse width, 50ms; pulse period, 200ms.
Since differential pulse voltammetry (DPV) has much higher current sensitivity and better resolution than cyclic voltammetry, it was used in the determination of AA and DA concentration. The effect of pH value on the determination of AA and DA in the mixture at Chi/GR/GCE was carefully investigated by DPV in a wider pH range (pH 2.0-10.0), since proton took part in the electrode reaction process of AA and DA [8, 50]. It can be seen from Fig. 4A that the peak current of AA in solution with pH ≤ 4.0 is large and then decreased with pH increasing. In fact, AA with a pKa of 4.17 [52] exists mainly as a neural form in the solution with pH ≤ 4.0, and in the anionic form in the solution with pH ≥ 5.0, and it may have repulsive electrostatic interactions with the surface of the modified electrode. In the case of DA, while the peak current initially increased together with an increase in the pH, once it reached its maximum value at about pH 4.0, and any further increase in the pH resulted in a related decrease in the DA peak current [8]. The dependence of the peak potentials of the AA and DA oxidation on the pH is shown in Fig. 4B. With the pH increasing in the measurement solution, all the peak potentials of AA and DA shifted to more negative values. This is a consequence of a deprotonation step involved in all oxidation processes that is facilitated at higher pH values. Fig. 4C shows the effect of pH on the separation of peak potentials. A seen in Fig. 4C the maximum separation of peak potentials for AA-DA is observed at pH 4.0. In order to obtain high sensitivity and selectivity, pH 4.0 was selected as an optimum pH value for the determination of AA and DA in their mixture.
[image:8.596.167.440.84.309.2]
Chi/GR/GCE with the peak potentials at about 182mV and 369mV, respectively. The separation of peak potentials at Chi/GR/GCE is 187mV for AA-DA, which is large enough to determine AA and DA simultaneously.
0.6 0.5 0.4 0.3 0.2 0.1 0.0 -0.1 -0.2
-8 -6 -4 -2 0 2 4
b
a
I
/
A
[image:9.596.168.425.139.350.2]E / V vs. SCE
Figure 5. CVs of bare GCE and Chi/GR/GCE (curve a, b, respectivity) in the presence of 100 M DA and 200 M AA in 0.1 M PBS (pH 4.0). DPV conditions are the same in Fig. 4.
3.5. Simultaneous determination of AA and DA
Simultaneous determination of AA and DA at Chi/GR/GCE was carried out using differential pulse voltammetry. Differential pulse voltammetry has much higher current sensitivity and better resolution compared to cyclic voltammetry [53].
0.8 0.6 0.4 0.2 0.0 -0.2
-9 -8 -7 -6 -5 -4 -3
o n ml kj
i h gf e dc b a
0 100 200 300 400 500 600
0.5 1.0 1.5 2.0 2.5 3.0 3.5 4.0 4.5
C
u
r
r
e
n
t
/
A
[AA] / M
I
/
A
E / V vs. SCE
0.8 0.6 0.4 0.2 0.0 -0.2
-10 -9 -8 -7 -6 -5 -4 -3 -2
j i h gf e d c b a
0 50 100 150 200 250 300
1 2 3 4 5 6 7 8
C
u
r
r
e
n
t
/
A
[DA] / M
I
/
A
E / V vs. SCE
B
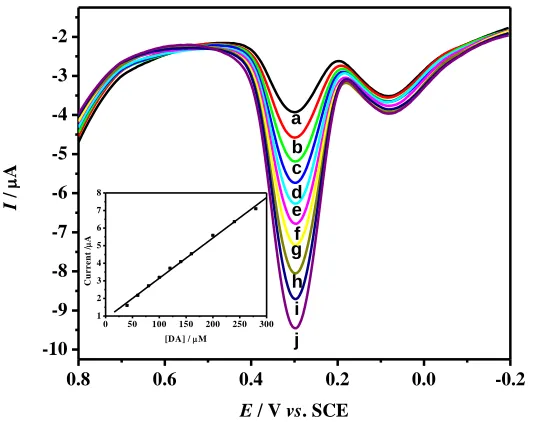
Figure 6. A) DPVs of AA at Chi/GR/GCE in the presence of 83.3 mM DA in 0.1 PBS (pH 4.0). AA concentrations (from a to o): (a) 60; (b) 80; (c) 100; (d) 120; (e) 140; (f) 160; (g) 200; (h) 240; (i) 280; (j) 320; (k) 360; (l) 400; (m) 440; (n) 500; (o) 560 M AA. DPV conditions are the same as in Fig. 4; B) DPVs of DA at Chi/GR/GCE in the presence of 83.3 mM AA in 0.1 PBS (pH 4.0). DA concentrations (from a to j): (a) 40; (b) 60; (c) 80; (d) 100; (e) 120; (f) 140; (g) 160; (h) 200; (i) 240; (j) 280 mM DA. DPV conditions are the same as in Fig. 4.
Also, the contribution of charging current to the background current is negligible in DPV. In ternary mixture, concentration of one species changed, and the other species remained constant. From Fig. 6A the peak current of AA increases linearly with increase in AA concentration from 0.6 M to 1678.1 M with linear function Ip, AA (A) = 0.66187 + 0.00633 CAA (M) with a correlation coefficient of R = 0.9991. Inset shows calibration curve. The peak current of DA increases linearly with increase in DA concentration from 0.3 M to 1067.5M with linear function Ip, DA (A) = 0.8530 + 0.02294 CDA (M) with correlation coefficient of R = 0.9983 as shown in Fig. 6B. The concentration limit for AA and DA that can de detected was found to be 0.01M and 0.1M, respectively. Therefore, simultaneous measurement of the two analytes is possible. Moreover, to evaluate the reproducibility of Chi/GR/GCE, the peak currents of 3 successive measurements by DPV in ternary mixture solution of 100M AA and 16M DA was determined. The relation standard deviation (R.S.D.) of 0.23% and 0.2% were obtained for AA and DA, respectively, indicating that the Chi/GR/GCE is not subject to surface fouling by the oxidation products [53]. As the electrode fabrication is very easy and low cost, the present modified electrode seems to be great utility for making voltammetric sensor for the detection neurotransmitters.
3.6.Determination of AA and DA in real samples
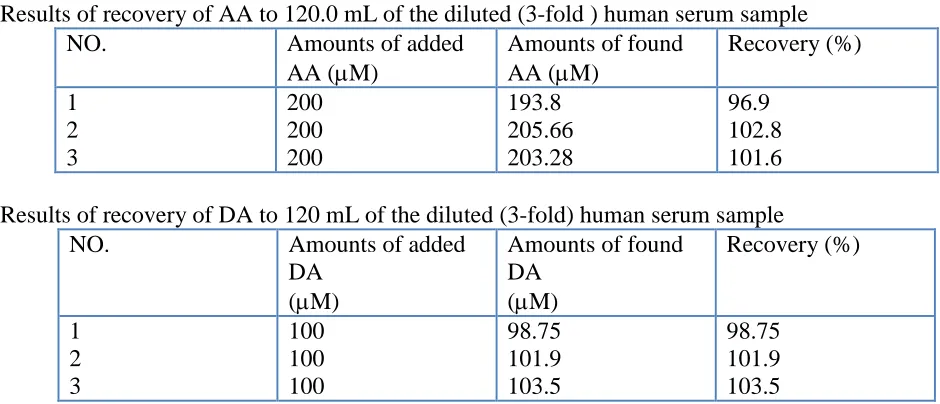
[image:10.596.163.441.75.286.2][image:11.596.50.520.177.379.2]
human serum sample. The results are summarized in Table 1. The good recoveries of the mixture samples indicate the successful applicability of the proposed method to simultaneous determination of AA and DA.
Table 1. Determination of AA and DA in human serum sample (n = 3).
Results of recovery of AA to 120.0 mL of the diluted (3-fold ) human serum sample
NO. Amounts of added
AA (M)
Amounts of found AA (M)
Recovery (%) 1
2 3
200 200 200
193.8 205.66 203.28
96.9 102.8 101.6 Results of recovery of DA to 120 mL of the diluted (3-fold) human serum sample
NO. Amounts of added
DA (M)
Amounts of found DA
(M)
Recovery (%)
1 2 3
100 100 100
98.75 101.9 103.5
98.75 101.9 103.5
4. CONCLUSION
A simple, rapid and green method was used to synthesize the reduced graphene, which was used to fabricate the modified electrode. Owing to the special properties of chitosan/graphene composite, electroactive substances such as ascorbic acid and dopamine had different oxidation peak potentials at Chi/GR/GCE. The Chi/GR modified electrode greatly catalyzed the electrooxidation reactions of AA and DA, improving their electrochemical reversibility and oxidation peak separation. Thus, the large peak separation between AA and DA allow their individual or simultaneous analysis through DPV technique. The proposed method could be applied to the determination of AA and DA in real samples with quite promising results.
ACKNOWLEDGEMENTS
Dr. Xu Zhu and Qin Liu contributed equally to this work. The authors greatly appreciate the supports of the National Natural Science Foundation of China (Nos. 21045003 and 21175091).
References
1. R. C. Retna, T. Okajima and T. Ohsaka, J. Electroanal. Chem., 543 (2003) 127. 2. J. W. Mo and B. Ogorevc, Anal. Chem., 73 (2001) 1196.
5. A. R. Zare, N. Nasirizaden and M. A. Mazloum, J. Electronanl. Chem., 577 (2005) 25.
6. J. Argüello, V. L. Leidens, H.A. Magosso, R. R. Ramos and Y. Gushikem, Electrochim. Acta, 54 (2008) 560.
7. S. Thiagarajan and S. M. Chen, Talanta, 74 (2007) 212.
8. J. S. Huang, Y. Liu, H. Q. Hou, and T. Y. You, Biosens. Bioelectron., 24 (2008) 632. 9. J. Wang, Electroanalysis, 17 (2005) 7.
10.P. S. Siew, K. P. Loh, W. C. Poh and H. Zhang, Diamond Relat. Mater., 14 (2005) 426. 11.A. Salimi, H. Mam-Khezri and R. Hallaj, Talanta, 70 (2006) 823.
12.R. P. Silva, A. W. O. Lima and S. H. P. Serrano, Anal. Chim. Acta, 612 (2008) 89. 13.R. T. Kachoosangi and R. G. Compton, Anal. Bioanal. Chem., 387 (2007) 2793. 14.K. S. Prasad, G. Muthuraman and J. M. Zen, Electrochem. Commum., 10 (2008) 559. 15.A. Safavi, N. Maleki, O. Moradlou and F. Tajabadi, Anal. Biochem., 625 (2009) 82.
16.S. B. Hocevar, J. Wang, K. P. Deo, M. Musameh and B. Ogorevc, Electroanalysis, 17 (2005) 417. 17.K. S. Novoselov, A. K. Geim, S. V. Morozov, D. Jiang, Y. Zhang, S. V. Doubonos, I. V.
Grigorieva and A. A. Firsov, Science, 306 (2004) 666.
18.K. S. Novoselov, A. K. Geim, S. V. Morozov, D. Jiang, M. I. Katsnelson, I. V. Grigorieva, S. V. Doubonos and A. A. Firsov, Nature, 438 (2005) 197.
19.Y. B. Zhang, Y. W. Tan, H. L. Stormer and P. Kim, Nature, 438 (2005) 201.
20.H. B. Heersche, P. Jarillo-Herrero, J. B. Oostinga, L. M. K. Vandersypen and A. F. Morpurgo, Nature, 446 (2007) 56.
21.S. Stankovin, D. A. Dikin, G. H. B. Dommet, K. M. Rohlhaas, E. J. Zimney, E. A. Stach, R. D. Piner, S. T. Nguyen and R. S. Ruoff, Nature, 442 (2006) 282.
22.C. Lee, X. Wei, J. W. Kysar and J. Hove, Science, 321 (2008) 385.
23.A. P. Yu, P. Ramesh, M. E. Itkis, E. Bekyarova and R. C.Haddon, J. Phys. Chem. C, 111 (2007) 7565.
24.A. A. Balandin, S. Ghosh, W. Z. Bao, I. Calizo, D. Teweldebrhan, F. Miao and C. N. Lau, Nano Lett., 8 (2008) 902.
25.Y. B. Zhang, Y. Tan, H. L. Stormer and P. Kim, Nature, 438 (2005) 201.
26.X. L. Li, X. R. Wang, L. Zhang, S. Lee and H. J. Dai, Science, 319 (2008) 1229.
27.N. G. Shang, P. Papakonstantinou, M. McMullan, M. Chu, A. Sramboulis, A. Potenza, S. S. Dhesi and H. Marchetto, Adv. Funct. Mater., 18 (2008) 1.
28.28. C. Berger, Z. M. Song, T. Li, X. Li, A. Y. Ogbazghi, R. Feng, Z. Dai, A. N. Marchenkov, E. H. Conrad, P. N. First and W. A. D. Heer, J. Phy. Chem. B, 108 (2004) 19912.
29.A. Dato, V. Radmilovic, Z. Lee, J. Phillips and M. Frenklach, Nano Lett., 8 (2008) 2012.
30.K. S. Kim, Y. Zhao, H. Jang, S. Y. Lee, J. M. Kim, K. S. Kim, J. H. Ahn, P. Kim, J. Y.Choi and B. H. Hong, Nature, 457 (2009) 706.
31.A. Reina, X. Jia, J. Ho, D. Nezich, H. Son, V. Bulovic, M. S. Dressselhaus and J. Kong, Nano Lett., 9 (2009) 30.
32.K. S. Novoselov, D. Jiang, F. Schedin, T. J. Booth, V. V. Khotkevich, S. V. Morozov and A. K. Geim, Proc. Natl. Acad. Sci. USA, 102 (2005) 10451.
33.A. K. Geim and K. S. Novoselov, Nat. Mater., 6 (2007) 183.
34.K. S. Novoselov, A. K. Geim, S. V. Morozov, D. Jiang, Y. Zhang, S. V. Dubonos, I. V. Grigorieva and A. A. Firsov, Science, 306 (2004) 666.
35.A. Charrier, A. Coati, T. Argunova, Y. Garreau, R. Pinchaux, I. Forbeaux, J. M. Debever, M. Sauvage-Simkin and J. M. Themlin, J. Appl. Phy., 92 (2002)2479.
36.C. Berger, Z. M. Song, X. B. Li, X. S. Wu, N. Brown, C. Naud, D. Mayou, T. B. Li, J. Hass, A. N. Marchenkov, E. H. Conrad, P. N. First and W. A. D. Heer, Science, 312 (2006) 1191.
38.S. Stankovich, R. D. Piner, X. Q. Chen, N. Q. Wu, S. T. Nguyen and R. S. Ruoff, J. Mater. Chem., 16 (2006) 155.
39.S. Stankovich, D. A. Dikin, R. D. Piner, K. A. Kohlhaas, A. Kleinhammes, Y. Y. Jia, Y. Wu, S. T. Nguyen and R. S.Ruoff, Carbon, 45 (2007) 1558.
40.D. Li, M. B. Muller, S. Gilje, R. B. Kaner and G. G. Wallace, Nat. Nanotechnol., 112 (2008) 8192. 41.G. X. Wang, J. Yang, J. Park, X. L. Gou, B. Wang, H. Liu, and J. Yao, J. Phy. Chem. C, 112
(2008) 8192.
42.G. Williams, B. Seger and P. V. Kamat, ACS Nano, 2 (2008) 1487.
43.X. L. Li, G. Y. Zhang, X. D. Bai, X. M. Sun, X. R. Wang and H. J. Dai, Nat. Nanotechnol., 3 (2008) 538.
44.V. C. Tung, M. J. Allen, Y. Yang and R. B. Kaner, Nat. Nanotechnol., 4 (2009) 25.
45.H. L. Guo, X. F. Wang, Q. Y. Qian, F. B. Wang and X. H. Xia. ACS Nano, 3 (2009) 2653. 46.W. S. Hummers and R. E. Offeman, J. Am. Chem. Soc., 80 (1958) 1339.
47.D. Li, M. B. Muller, S. Gilje, R. B. Kaner and G. G. Wallace, Nat. Nanotechnol., 3 (2008)101. 48.C. S. Shan, H. F. Yang, D. X. Han, Q. X. Zhang, A. Ivaska and L. Niu, Biosens. Bioelectron., 25
(2010) 1504.
49.Y. Xu, H. Bai, G. Lu, C. Li and G. Shi, J. Am. Chem. Soc., 130 (2008) 5856.
50.D. Zheng, J. Ye, L. Zhou, Y. Zhang and C. Yu, J. Electroanal. Chem., 625 (2009) 82.
51.A. J. Bard and L. R. Faulkner, Electrochemical Methods: Fundamentals and Applications, Wiley, New York (2000).
52.S. Shahrokhian, H. R. Zare-Mehrjardi, and H. Khajehsharifi, J. Solid State Electrochem., 13 (2009) 1567.
53.M. Revanasiddappa, S. S. Gurukar, S. M. Jose, F. D. S. Stanislaus and V. V. Thimmappa, Sens. Actuators B, 145 (2010) 643.