Int. J. Electrochem. Sci., 9 (2014) 4793 - 4804
International Journal of
ELECTROCHEMICAL
SCIENCE
www.electrochemsci.orgPhysical Modeling
and
M
athematical Simulation of
f
luid Flow
inside
an Oil/water
S
eparator tank
and
it E
ffect on
Flow
Accelerated Corrosion
A. Martínez-Gómez1, M. Díaz-Cruz1,*
, A. Cervantes-Tobón1, J. L. González-Velázquez1, J. G. Godínez-Salcedo1, R. Macías-Salinas2
.
1Instituto Politécnico Nacional, Departamento de Ingeniería Metalúrgica, Laboratorios Pesados de Metalurgia UPALM, Col. Zacatenco, Del. G. A. Madero, 07738, México, D.F.
2Instituto Politécnico Nacional, Departamento de Ingeniería Química, UPALM, Col. Zacatenco, Del. G. A. Madero, 07738, México, D.F.
*
E-mail: [email protected]
Received: 25 April 2014 / Accepted: 29 May 2014 / Published: 16 June 2014
The physical separation of oil/water in the oil production process is carried out in separation tanks, where the separation of water carries aggressive compounds, which cause significant corrosion damage to inner walls of the separator tank. The flow behavior of such fluids, causing a gradual detachment and entrainment in some zones of the walls of the separator, this phenomenon is known as Flow Assisted Corrosion. In this paper the design and construction of a physical scale model (1/26) of an original separator tank was made which flowed a NACE ID-196 brine combined with kerosene and added with H2S at distinct flow rates, with the objective of observing this phenomenon. Similarly, a
solid separator geometry prototype was built in the SolidWorks software later to carry out virtual simulations with ANSYS Fluent software to be able to compare with experimental results. The effect of flow rate (flow accelerated corrosion) on the surface of API 5L X-70 (steel use in this work) on the corrosion rate was evaluated and the corrosion products formed have been characterized using Scanning Electron Microscopy (EDX), X-ray Diffraction (XRD) and Linear Polarization technique (values of corrosion rate). XRD analysis showed that the corrosion products are mainly composed of a mixture of oxides and sulfides.
Keywords: Two-phase separator, API 5L X-70 steel, Flow assisted corrosion, ANSYS simulation.
1. INTRODUCTION
aimed to increase the capacity of the unit, while the size and weight of the equipment is reduced, has been done mainly by using physical scale models [1]. A more economical way to analyze the two-phase separation phenomenon is the CFD (computational fluid dynamics), which provides detailed results of the flow characteristics and is suited for any complex geometry. However, computational solutions based solely on mathematical models, only approximate reality with different degrees of accuracy, therefore, the solutions obtained by these calculations, must be validated by experimental models that reproduce as close as possible the computational models [2]. Therefore, the objective of this work is to combine these two techniques to perform for an extensive study of the oil/water separation in separator tanks and analyze its effect on phenomenon flow assisted corrosion. The experiment consists on the design and construction of a physical model and to do the CFD mathematical simulations in conjunction with electrochemical tests to observe the effect of the flow on the corrosion of steel used in the manufacture of separator tanks.
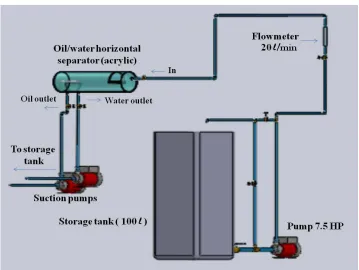
[image:2.596.119.478.366.636.2]2. EXPERIMENTAL PROCEDURE 2.1 Materials and equipment
Figure 1. Representative diagram of the experimental equipment.
The experimental procedure of this research was divided into three parts: i) physical simulation, ii) mathematical simulation and iii) laboratory electrochemical tests.
In order to simulate oil/water flow inside of the separator tank, synthetic brine added with kerosene and H2S was prepared. The physical model was constructed according to the set up shown in
[image:3.596.125.479.187.332.2]
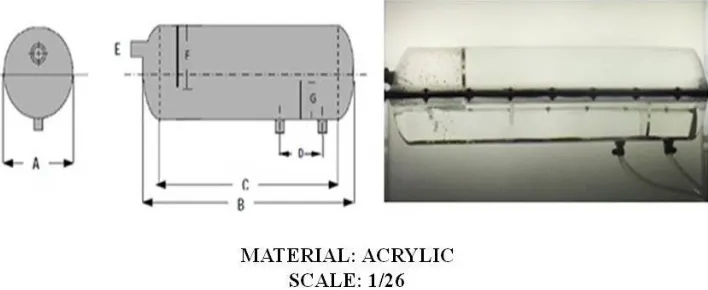
actual separator tank, following the criteria of similarity of Froud and Reynolds. The brine was stored in a 100 l tank to be fed into the separator tank model by a pump for corrosive fluids. The flow rate was controlled manually with the help of a rotameter. A couple of suction pumps at the outlet of the tank were used to control the flow inside the separator tank and to maintain the level constant. The Figure 2 shows the drawing of the model.
Figure 2. Representation of the model.
2.2 Physical simulation
To observe fluid characteristics inside the separator tank, water was fed at different flow rates (1-10 l/min), with a tracer added at a time (t) equal to zero, taking photographs every second until the tracer completely exited (tf) the device. This process was repeated three times to average the results.
2.3 Mathematical simulation
[image:3.596.114.485.189.488.2]
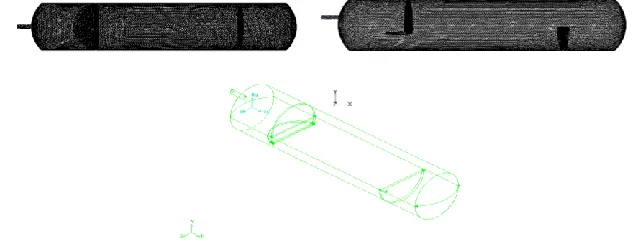
Figure 3. Acrylic separator designed in solid works.
The mesh of the tank walls and internals consisted of 77,713 nodes, while the hybrid network consisted of 417.571 cells. Figure 4 shows different views of the mesh of the separator tank constructed. This model was identical to the physical model described in the previous section.
Figure 4. Meshing the separator.
2.4 Electrochemical tests
2.4.1 Corrosion rate measurements
[image:4.596.140.456.345.470.2]
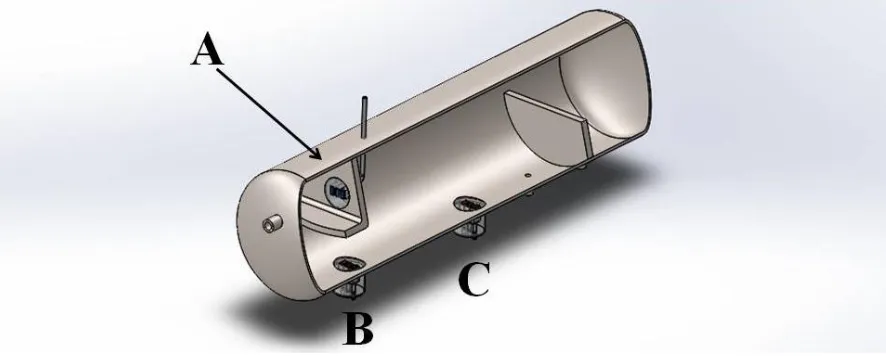
Figure 5. Location of the electrochemical specimens in the separator.
As shown in Figure 5 the probe A was placed on the front face of the impingement plate where the incoming feed impacts the plate. The probe B was placed B 11.35 cm from the inlet side end while the probe C was placed at 34 cm from the inlet end at the bottom of the tank.
2.5 Characterization of corrosion products.
The morphology and chemical composition of the corrosion products formed on electrochemical probes surface (A, B and C) were characterized using a scanning electron microscopy (SEM), Jeol JSM 6300 operated at 20 kV equipped with a X ray energy dispersive analysis system (EDS).
2.6 Structural characterization by XRD
X-ray Diffraction (XRD) was used to identify the corrosion products formed on API 5L X-70 steel, with a scanned range from 20° to 90° and a step width of 0.02°, using a D8 Focus Bruker X ray diffractometer with Cu K radiation.
3. RESULTS AND DISCUSSION 3.1 Physical model
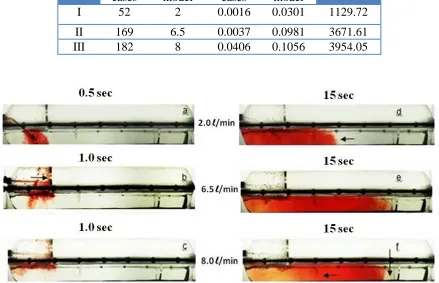
Table 1. Study cases.
CASE Flow rate (LPM) Rate (m/s) Re
Real cases
Physical model
Real cases
Physical model
I 52 2 0.0016 0.0301 1129.72
II 169 6.5 0.0037 0.0981 3671.61
[image:6.596.79.518.147.430.2]III 182 8 0.0406 0.1056 3954.05
Figure 6. Mixing tracer patterns.
Figure 6 shows photographs of the mixing tracer pattern taken at 0.5 and 15 sec after injection, for the three flow rates studied (2, 6.5 and 8 l/min). At 0.5 sec and 2 l/min it is observed that the tracer contacts the liquid within the separator, an inmediate turbulence is formed. At 1.0 sec and 6.5 l/min is due to a higher moment of injection, the incoming flow impacts the impact plate, and the tracer mixes with the liquid within the separator at a slower rate, therefore a less turbulent behavior is observed. At 1.0 sec and 8 l/min the impact on the impact plate is less turbulent than the previous case.
[image:7.596.58.541.103.342.2]
3.2 Mathematical simulation
Figure 7. Velocity vector fields by CFD at 15 sec transversal-longitudinal cut.
[image:7.596.65.533.397.724.2]
Figure 7 shows velocity vectors filed in a longitudinal out of the separator tank, at different flow rates and after 0.5 and 1.5 sec of injection of the oil/water mixture. The results agree with the physical simulation shown in Figures 6a, b, c. In the first figure, the fluid is a 2 l/min, and is observed that the feed flow impact the bottom of the separator tank, because it enters at a relatively high rate, hitting the bottom of the separator (arrow), causing turbulence (triangle). Phase separation in this condition is not favorable. At 6.5 l/min, is observed that the flow is laminar and approaches to an ideal phase separation at relatively low rates. This low transport rate favors flow assisted corrosion (FAC) for stagnancy material drag, causing a gradual loosening in the inner zone of the separator. The wall thinning caused by FAC in piping systems may lead to catastrophic failures of system components (in this case the tank separator) and may also result in serious fatalities as reported by Ahmed et al. [4]. Furthermore, is also observed that the rate at which the fluid contacts the separator is significantly lower than in Case I, due to the impact with shock plate. In this case a sheet behavior generally is presented along the separator, reaching a further stabilization and therefore a better phase separation. In case III, the fluid enters at a higher speed and causes different recirculation zones inside the separator, there is also observed recirculated flow (marked with a triangle) and few areas of sheet flow. However, higher velocities than previous experience and thus shorter residence times which is not suitable for phase separation due to this turbulence.
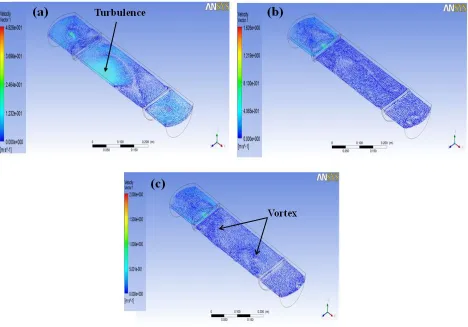
Figures 8a, b, c show the flow velocity profiles of the cases I, II and III respectively viewed from the center plane of the separator. 8a image shows a high turbulence at the center of the separator (arrowed) also in this area the highest within the device rates are attained, this behavior is not observed in the case II, where the flow is observed in the mostly of the sheet type, as mentioned, this favors a proper separation of phases. In case III observed vortex [5] in the body separator (indicated by arrow).
3.3 Linear polarization studies
Table 2. Probes A, B and C exposed to NACE 1D-196 Brine + 1 bar H2S.
Flow rate Probe A [impingement plate] (mpy) Probe B [11.35cm] (mpy) Probe C [34 cm] (mpy)
2 l/min 5.75025 1.6546
6.5 l/min 34.392 4.182 1.538
8 l/min 83.7066 7.8776 13.8266
corresponds to the feed flow 8 l/min. This is due both to the flow rate and the behavior are same in this zone where, according to the velocity profiles obtained in Step I, the velocity in this area is slightly higher than in cases I and II. Figure 9 shows a graph of the results from Table 2.
2 6.5 8
0 20 40 60 80 100
C
o
r
r
o
si
o
n
r
a
te
(m
p
y
)
Flow rate (l / min)
Probe A Probe B Probe C
Figure 9. Corrosion Rate of API 5L X-70 steel probes A, B and C in Brine NACE 1D-196 added with 1382.7 ppm of H2S.
3.4 SEM surface characterization
[image:9.596.159.410.161.365.2] [image:9.596.152.444.460.706.2]
Figure 10 shows the micrographs of the corrosion products obtained for the three samples under study at different magnifications; the specimen A, as described above, was placed in shock plate, wherein the fluid directly impacts at high flow rates, the probe B and C were placed in the liquid recovery zone to 11.35 cm and 34 cm from feed inlet, respectively. The layer to formed on the steel surface is composed of salts (characteristics of the brine) and iron oxides and have characteristic and congruent morphology with previous studies [6] have mostly cactus form on the surface, as it can be seen from best micrographs obtained at higher magnifications (7, 8, 9). In the three cases is a layer of amorphous and porous corrosion products on the surface and being visibly most abundant for the specimens A and B.
Figure 11. EDX mapping for sample of API 5L X-70 steel with back scattered image, C, O, Cl, Mn, Fe, S and Si analysis.
[image:10.596.67.530.247.615.2]
3.5 XRD Characterization of corrosion products
0 20 40 60 80 100
0 5000 10000 15000 20000 25000
Fe2O3 Monoclinic Magemite
Fe9S11 RombohedralSmithite Fe3O4 Cubic Magnetite
FeS Hexagonal Troilite
*
*
API 5L X-70 Brine + Kerosene + 1382.7 ppm of H2S
In
te
n
si
ty
2
Figure 12. X-ray diffraction analysis (XRD) of corrosion products in API 5L X-70 steel surface in brine added with kerosene and H2S.
The study by X-ray diffraction of the corrosion products formed is revealed by Figure 12, API 5L X-70 surface is formed with a mixture of oxides and sulfurs as report A. Hernández et al [10]. The surface steel mainly formed oxides as cubic magnetite, monoclinic magemite, rombohedral smithtite and hexagonal troilite. The different crystal structures of iron sulfides formed in H2S containing corrosive
media were describe in detail by D. Rickard et al [11]. Troilite is a common composed of hexagonal crystal and is consider a protective layer. The presence of some oxides as Fe2O3 and Fe3O4 as reported by E.S. Sherif et al [12] partially protects the steel surfaces from further dissolutions and leads in turn to the appearance of a passive region on the behavior of the corrosion rate.
4. CONCLUSIONS
An experimental study for the characterization of fluid flow was made in a biphasic separator at different flow rates using the conventional technique of stimulus-response (injection of a tracer) approach and computational fluid dynamics (CFD).
[image:11.596.88.515.96.394.2]
A feed rate of 6.5 l/min and 8 l/min mostly laminar flow occurs and consequently dead and different areas where the fluid remains stagnant or traveling at very low flow rates. However recirculations and/or eddies are also observed, likewise can cause flow assisted corrosion.
According to the results it is seen that the flow rate being fed to separator is very important in the transport of hydrocarbons and its separation. With the results, the most affected areas which served for studies with electrochemical techniques to determine the flow assisted corrosion was determined.
Characterization studies carried out by SEM showed that the corrosion products formed on the surfaces of the API 5L X-70 steel are composed of a mixture of oxides with sulfides. The probes B and C of API 5L X-70 steel showed the best behavior with respect to the corrosion rate because in this case the flow rate does not have some significant effect on the formation of corrosion products, due to its corrosion products are more stable and uniform in surface, although at a lower amount as could it be seen, that the presence of sulfides ( hexagonal troilite, and rombohedral smithite) helps the better protection work as oxides (monoclinic maghemite, rhombohedral hematite and cubic magnetite) only are partially protective. The present study provides a physical modeling and mathematical simulation of fluid inside of a separator tank in combination with the study of the effect of this in the flow accelerated corrosion (FAC) with the measure of the corrosion rate by the electrochemical technique polarization resistance (Rp). Therefore it is something new that has not been performed in the area of corrosion in particular for a separator tank.
ACKNOWLEDGEMENTS
The authors are also greatful for the financial support to the group of Pipeline Integrity Analysis (GAID-IPN), CONACYT and SIP-IPN.
References
1. M. P. Jhon, E-Journal of Advanced Maintenance, 4 (2012) 63. 2. S. Nesic, Chem. Eng. Comm., 194 (2006) 141.
3. ASTM G59-97 (Reapproved 2003)”Standard Test Method for Conducting Potentiodynamic Polarization Resistance Measurements” (Houston TX: NACE, 2003).
4. W. H. Ahmed, M. M. Bello, A. Al-Sarkhi, M. El-Nakla, Nuclear Engineering and Design, 252 (2012) 52.
5. E. P. Rivero, P. Granados, F. F. Rivera, M. Cruz and I. González, Chem. Eng. Sci., 65 (2010) 3042. 6. S. Seal, K. Sapre, A. Kale, V. Desai, M. Gopal, P. Jepson, Corros. Sci., 42 (2000) 1623.
7. P.R. Rhodes, Corros. Sci., 57 (2001) 923.
8. I. Hamada and K. Yamauchi, Metall. Mater. Trans. A Phys. Metall. Mater. Sci., 5 (2010) 56.
9. CH. Ren, D. Liu, Z. Bai and T. Li, Mater. Chem. Phys., 93 (2005) 305.
10.A. Hernández-Espejel, M.A. Dominguez-Crespo, R. Cabrera-Sierra, C. Rodriguez-Meneses, E.M Arce-Estrada, Corros. Sci., 52 (2010) 2258.
11.D. Rickard and G. Luther, Chem. Rev., 107 (2007) 514.
12.El-Sayed M. Sherif, Abdulhakim A. Almajid, Khalil Abdelrazek Khalil, Harri Junaedi and F.H. Latief, Int. J. Electrochem. Sci., 8 (2013) 9360.