Int. J. Electrochem. Sci., 10 (2015) 10445 - 10453
International Journal of
ELECTROCHEMICAL
SCIENCE
www.electrochemsci.org
Short Communication
Preparation and Electrochemical Performance of Mg-doped
Li
4Ti
5O
12Nanoparticles as Anode Materials for Lithium-Ion
Batteries
Fuyun Li, Min Zeng*, Jing Li, Hui Xu
School of Materials Science and Engineering, Southwest University of Science and Technology, Mianyang 621010, P R China
*
E-mail: zengmin@swust.edu.cn
Received: 14 September 2015 / Accepted: 5 October 2015 / Published: 4 November 2015
Mg-doped Li4Ti5O12 nanoparticles with a grain size of around 200 nm were synthesized successfully
using a simple solid-state reaction route. The effects of Mg2+ doping on Li4Ti5O12 were systematically
investigated by XRD, XPS, TEM, HRTEM and EDS. These indicated that Mg ions were uniformly dispersed into Li4Ti5O12 lattice and Mg2+ doping during sintering can effectively inhibit the growth of
Mg-doped Li4Ti5O12 particles without changing the structure of Li4Ti5O12. The charge–discharge
cycling tests and EIS analysis were conducted to study their electrochemical performance. The initial discharge capacity of the Mg-doped Li4Ti5O12 electrodes was 190mAhg–1 at 1 C and the discharge
capcity of 179mAhg–1 was retained after 100 cycles. Moreover, the discharge capacity of 150mAhg–1 was maintained even at a high rate of 5 C after 100 cycles, whereas the undoped electrodes only exhibited a capacity of 134mAhg–1 under the same condition. The excellent electrochemical performance of doped electrodes can be ascribed to the unique properties of nanomaterials and excellent electrical conductivity due to Mg2+ doping.
Keywords: Li4Ti5O12, nanosized materials, Mg2+ doping, lithium storage capacity.
1. INTRODUCTION
(good Li-ion intercalation and deintercalation reversibility, excellent Li-ion mobility and no structural change during charge–discharge process) [8-10]. However, the poor electrical conductivity (σ < 10–13 S cm–1) and the sluggish lithium ion diffusion coefficient (<10–8 cm2 s–1) of Li4Ti5O12 greatly limit its
rate performance [2, 11]. To improve the electrical conductivity of Li4Ti5O12, many effective methods
have been proposed, including synthesis of nanosized Li4Ti5O12 [12-13], doping with conductive metal
ions (Zn2+, Cr3+, Ni2+, Mg2+) [14-17] or non-metal ions (F–) [18] in Li, Ti or O sites, and coating conductive materials on Li4Ti5O12, such as carbon coating layer [19-20], N-Doped Carbon coating
layer [21] and TiO2 nano-coating layer and so on [22].
Based on the merits mentioned above, we considered if the synthesis of nanosized Li4Ti5O12
with Mg2+ doping can further improve the electrochemical performances of Li4Ti5O12, as the so-called
“Synergistic Effect”. It should be noted that the ionic radius of Mg2+
(0.66 Å) was nearly the same as that of Li+ (0.68 Å), and Mg ions were easily incorporated into the Li sites. In this work, nanosized Li4Ti5O12 with Mg2+ doping was prepared by a cheap method of the nanosized raw materials. The
effects of nanosized materials and Mg2+ doping on the electrochemical performances of Li4Ti5O12 have
been studied at ambient temperatures.
2. EXPERIMENTAL
2.1. Preparation of Li4Ti5O12 and Mg-doped Li4Ti5O12
The Li4Ti5O12 (LTO) and Mg-doped Li4Ti5O12 (Mg-LTO) samples were synthesized by a solid
state reaction. The starting materials were powers of Li2CO3 (AR, Chengdu kelong Chemical Agents
Co. Ltd), nanosized TiO2 (P25, Degussa) and MgO (99.9%, 50nm, Aladdin Co.). The raw materials
were dissolved in ethanol slurry according to the stoichiometric quantities of Li4Ti5O12 and
Li3.8Mg0.2Ti5O12. About 8 wt% excess Li2CO3 was added to compensate for Li volatilization during
the calcination process. Next, the mixture was ball-milling for 6 h and then the slurry was dried at 80 °C for 8 h. After being absolutely dried, the mixture was calcined at 800 °C for 8 h in air.
2.2. Characterizations and testing
The samples were initially characterised by X-ray diffraction using an X-ray diffraction analyzer with Cu-Kα radiation (XˊPert PRO, PANalytical). The surface chemical composition and the oxidation valence states of both samples were measured on an X-ray photoelectron spectroscopy (XPS), using a Perkin-Elmer model PHI 5600 XPS system. The more detailed structural information was measured on a transmission electron microscope (TEM) and a high-resolution transmission electron microscope (HRTEM, Tecnai F20, FEI). The morphology and doped element distribution of Mg-LTO were investigated by means of field emission scanning electron microscope (Ultr55, Zeiss) .
Subsequently, an appropriate amount of N-methylpyrrolidone (NMP) solvent was slowly introduced and wetly mixed to produce electrode slurry. The uniform slurry was coated onto a copper foil using a scraper and dried at 120 °C for 24 h to remove the solvent. Then the electrodes were punched into disks and assembled into half cells in an Ar-filled glove box. Li foils were used as the counter electrodes and the polypropylene microporous films (Celgard 2300) were employed as the separators. The commercial electrolyte was 1 M solution of LiPF6 in ethylene carbonate (EC) and dimethyl
carbonate (DMC) with in a volume ratio of 1:1. The charge–discharge measurement at room temperature was carried out using a LAND test system with cut-off voltage of 1.0–2.5 V (vs. Li/Li+) at various constant current densities (1–5 C). Electrochemical impedance spectroscopy (EIS) was measured by means of a CHI760C electrochemical station in the frequency range of 0.01 Hz to 10 kHz.
3. RESULTS AND DISCUSSION
X-ray diffraction patterns of the pristine LTO and Mg-LTO are presented in Fig. 1(a). The diffraction peaks of both samples were sharp and strong, suggesting their high crystallinity. The diffraction patterns of LTO with and without MgO are in good agreement with cubic spinel LTO (JCPDS 49-0207). Moreover, the ionic radius of Mg2+ (0.66 Å) was nearly the same as that of Li+ (0.68 Å), and hence Mg ions were easily incorporated into the Li sites [3]. No secondary peaks belonging to MgO were detected in the XRD patterns of Mg-LTO in Fig. 1(a), which indicated that the doped Mg ions might be introduced into Li sites in the LTO lattice without changing its structural characteristics.
The surface chemical composition and the oxidation valence states of LTO and Mg-LTO were examined by X-ray photoelectron spectroscopy (XPS) measurement, as shown in Fig. 1(b-d). The XPS survey spectra of LTO and LTO are shown in Fig. 1(b). A new peak at around 310 eV for the Mg-LTO can be seen clearly, which can belong to Mg (KLL), indicating the presence of Mg in the surface of Mg-LTO. Fig. 1(c) and (d) show the typical high-resolution XPS spectra of Ti 2p for LTO and Mg-LTO, respectively. Two broad peaks at about 463.8 and 458.1 eV correspond well with characteristic Ti 2p1/2 and Ti 2p3/2 peaks of Ti4+ in Fig. 1(c) [3, 10]. It can be clearly seen that almost
all of the peak areas are attributed to Ti4+ and only a tiny peak area assigns to Ti3+ with a content of 3.68%. However, the curve of Ti 2p in Mg-LTO has a blue shift when compared to LTO. This indicates that treatment with Mg2+ doping changed the surface bonding of LTO. Moreover, it can be seen that the contents of Ti3+ at 2p3/2 and 2p1/2 in Fig. 1(d) are 15.68% and 17.23%, respectively, which
Figure 1. (a) XRD images of LTO and Mg-LTO. (b) XPS survey spectra of LTO and Mg-LTO. Ti2p
XPS spectra of (c) LTO and (d) Mg-LTO.
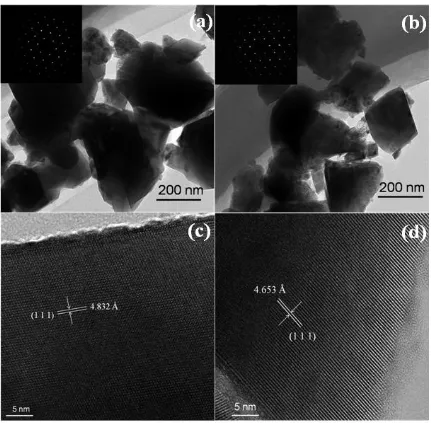
The TEM micrographs and SEAD images of LTO and Mg-LTO are observed in Fig. 2(a) and (b). Compared with the LTO shown in Fig. 2(a), Mg-LTO (Fig. 2(b)) had smaller grain size around 200 nm, indicating that Mg2+ doping during sintering can effectively inhibit the growth of Mg-LTO particles. Small size will make grains contact with electrolyte more sufficiently, and hence enhance the
electrochemical property of the electrode. The insets in the images show selected area electron diffraction (SAED) images of the as-synthesized products. The regular distribution of sharp spots reveals that the LTO and Mg-LTO samples are monocrystal materials with a good crystal structure.
The HRTEM patterns (Fig. 2(c) and (d)) of LTO and Mg-LTO show that the structure of both samples is well crystallized. As shown in Fig. 2(c), the interplanar spacing of pristine LTO is 4.832 Å, which is well consistent with the lattice space (111) facets of spinel LTO [22]. However, the (111) facet of the Mg-LTO sample is ca. 4.653 Å (Fig. 2(d)), which is a bit smaller than the pristine LTO. This can be due to substitution of Mg2+ for Li+. The ionic radius of Mg2+ and Li+ is similar, but the electrovalence of Mg2+ is twice that of Li+. Thus, the ionic bonding interactions between Mg2+ and [TiO6] octahedrons are stronger than that between Li+ and [TiO6] octahedrons, which decreases the
interplanar spacing.
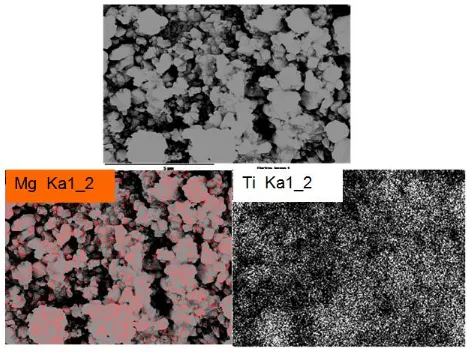
bright spots correspond to the presence of the elements Ti and Mg, which demonstrates that the Ti and Mg is uniformly distributed in the Mg-LTO crystal structure by means of the high temperature solid-stated reaction. This result reveals that the Mg2+ may be introduced into Li sites in the LTO instead of separated phase.
Figure 2. TEM micrographs and corresponding SEAD images (insets) of (a) LTOand (b) Mg-LTO. HRTEM patterns of (c) LTO and (d) Mg-LTO.
[image:5.596.82.513.157.580.2][image:6.596.61.528.162.514.2]
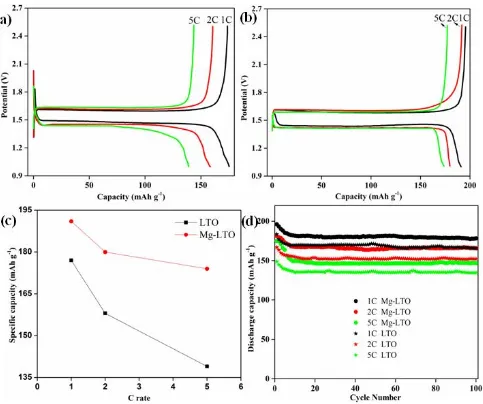
current densities is an innate material response, but the difference in discharge capacities of two electrodes was magnified with the increase in the rate shown in Fig. 4(c) (e.g., 14 mAh g–1 at 1 C, 22 mAh g–1 at 2 C and 34 mAh g–1 at 5 C). The discussion mentioned above indicates that Mg2+ doping can effectively improve the performance of LTO at high rate.
Figure 3. SEM image and the corresponding elemental mapping of Mg and Ti in the Mg-LTO.
The flat plateau position of the charge and discharge curves for both samples at about 1.7 and 1.5 V can be ascribed to the redox reactions of Ti4+/Ti3+ in LTO. The charge curve moves to higher potential and the discharge curve moves to lower potential with increasing of the charge–discharge current densities, which is due to the polarization of the electrode. Moreover, the charge–discharge voltage plateaus of the Mg-LTO are slightly closer to the theoretical voltage plateau (1.55 V) than the pristine LTO. This result demonstrates that, with the increase of the current densities, the Mg-LTO displays a smaller electrode polarization than the pristine LTO; manifesting that Mg2+ doping can enhance the electrode reaction kinetics.
[image:7.596.58.541.310.714.2]
still displayed a discharge capacity of 150 mAh g–1. On the basis of previous results, the higher-than-theoretical capacity could be attributed to the possible occupation at the 8a sites of nanosized LTO by Li+ when the 16c sites of the spinel structure exceed the storage limit [23]. The co-occupation of 8a and 16c sites in the surface region is predicted to be more momentous in nanosized materials that have larger specific surface area, leading to storage properties of surface region different from those of the bulk [24]. In addition, Mg-LTO exhibits higher rate capability than LTO electrodes at different rates. For instance, Mg-LTO offers a capacity of about 165mAhg–1, while LTO only displays an inferior capacity of 150 mAh g–1 at 2 C rate after 100 cycles. Two complementary aspects clearly account for this considerable rate capability improvement (relative to LTO): (1) Compared with the pristine LTO, Mg-LTO had smaller grain size around 200 nm, and small size will make grains contact with electrolyte more sufficiently. (2) Mg2+ doping may promote the electrical conductivity of Mg-LTO. These factors result in significant improvement of the electrode kinetics, and hence the specific capacity of Mg-LTO electrode is larger than that of LTO electrode.
[image:8.596.112.479.258.561.2]
To further gain insight into the reason of improved performance of Mg-LTO, electrochemical impedance spectroscopy (EIS) measurements were conducted (Fig. 5). The resulting Nyquist plots show a depressed semicircle in the high frequency region, and an inclined straight line in the low frequency region. The semicircular arc of the Mg-LTO electrode was smaller compared with the LTO electrode. The relatively small semicircular arc displays an overall smaller charge transfer resistance at the electrode/electrolyte interface after Mg2+ doping. The inclined line in the low-frequency region is corresponded to Li+ diffusion in the bulk of the material [18]. The Mg-LTO electrode displayed a larger slope, which may be used to imply a higher Li+ mobility in the solid than the LTO. This result agrees with the electrochemical testing results (Fig. 4).
Figure 5. Nyquist impedance spectra of LTO and Mg-LTO materials.
4. CONCLUSIONS
References
1. Y. C. Yang, B. H. Qiao, X. M. Yang, L. B. Fang, C. C. Pan, W. X. Song, H. S. Hou and X. B. Ji, Adv. Funct. Mater., 24 (2014) 4349.
2. S. Chen, Y. L. Xin, Y. Y. Zhou, Y. R. Ma, H. H. Zhou and L. M. Qi, Energ Environ. Sci., 7 (2014) 1924.
3. D. Z. Kong, W. N. Ren, Y. S. Luo, Y. P. Yang and C. W. Cheng, J. Mater. Chem. A, 2 (2014) 20221.
4. L. F. Shen, E. Uchaker, X. G. Zhang and G. Z. Cao, Adv. Mater., 24 (2012) 6502.
5. K. Song, D. H. Seo, M. R. Jo, Y. Kim, K. Kang and Y. M. Kang, J. Phys. Chem. Lett., 5 (2014) 1368.
6. E. Kang, Y. S. Jung, G. H. Kim, J. Y. Chun, U. Wiesner, A. C. Dillon, J. K. Kim and J. Lee, Adv. Funct. Mater., 21 (2011) 4349.
7. Q. Y. Zhang and X. Li, Int. J. Electrochem. Sci., 8 (2013) 7816.
8. C. C. Yang, H. C. Hu, S. J. Lin and W. C. Chien, J. Power Sources, 258 (2014) 424.
9. M. D. Ji, Y. L. Xu, Z. Zhao, H. Zhang, D. Liu, C. J. Zhao, X. Z. Qian and C. H. Zhao, J. Power Sources, 263 (2014) 296.
10.C. C. Chen, Y. N. Huang, C. H. An, H. Zhang, Y. J. Wang, L. F. Jiao and H. T. Yuan, ChemSusChem, 8 (2015) 114.
11.C. F. Lin, B. Ding, Y. L. Xin, F. Q. Cheng, M. O. Lai, L. Lu and H. H. Zhou, J. Power Sources, 248 (2014) 1034.
12.E. Pohjalainen, T. Rauhala, M. Valkeapää, J. Kallioinen and T. Kallio, J. Phys. Chem. C, 119 (2015) 2277.
13.L. F. Shen , X. G. Zhang , E. Uchaker , C. Z. Yuan and G. Z. Cao, Adv. Energy Mater., 2 (2012) 691.
14.T. Zhou, Y. B. Lin, G. Y. Zhao, Y. D. Huang, H. Lai, J. X. Li, Z. G. Huang and S. H. Wu, Int. J. Electrochem. Sci., 8 (2013) 1316.
15.S. Y. Li, M. Chen, Y. Xue, J. Wu, X. G. Zhang and Z. B. Wang, Ionics, 21 (2015) 1545. 16.C. C. Zhang, D. Shao, Q. Z. Gao, Y. H. Lu, Z. T. Liu, X. Y. Yu, Y. P. Fang and D. Y. Chen, J.
Phys. Chem. C, 119 (2015) 2277.
17.W. Wang, B. Jiang, W. Y. Xiong, Z. Wang and S. Q. Jiao, Electrochim. Acta, 114 (2013) 198. 18.Y. Ma, B. Ding, G. Ji and J. Y. Lee, ACS Nano, 7 (2013) 10870.
19.Y. C. Kuo and J. Y. Lin, Electrochim. Acta, 142 (2014) 43.
20.C. G. Nava-Dino, R. G. Bautista-Margulis, J. E. Mendoza-Negrete, G. Llerar-Meza, J. P. Flores de los Rios, G. López-Ocaña, M. I. Ferrer-Sánchez, J. G Chacón-Nava and A. Martínez-Villafañe, Int. J. Electrochem. Sci., 10 (2015) 3820.
21.L. Zhao, Y. S. Hu, H. Li, Z. X. Wang and L. Q, Chen. Adv. Mater., 23 (2011) 1385.
22.Y. Q. Wang, L. Gu, Y. G. Guo, H. Li, X. Q. He, S. Tsukimoto, Y. C. Ikuhara and L. J. Wan, J. Am. Chem. Soc., 34 (2012) 7874.
23.W. J. H. Borghols, M. Wagemaker, U. Lafont, E. M. Kelder and F. M. Mulder, J. Am. Chem. Soc., 131 (2009) 17786.
24.Z. Zhong, C. Ouyang, S. Shi and M. Lei, ChemPhysChem, 9 (2008) 2104.